Journal of Biophysical Chemistry
Vol.2 No.4(2011), Article ID:8432,4 pages DOI:10.4236/jbpc.2011.24050
The binding site for acute corticosterone effects on N-methyl-D-aspartate receptor-mediated Ca2+ signals in mouse hippocampal slices
1Department of Correlative Study in Physics and Chemistry, Graduate School of Integrated Basic Sciences, Nihon University, Tokyo, Japan;
2Department of Physics, College of Science and Technology, Nihon University, Tokyo, Japan;
3Department of Integrated Sciences in Physics and Biology, College of Humanities and Sciences, Nihon University, Tokyo, Japan; *Corresponding Author: msaito@chs.nihon-u.ac.jp;
4Department of Biophysics and Life Sciences, Graduate School of Arts and Sciences, The University of Tokyo, Tokyo, Japan.
Received 27 July 2011; revised 28 September 2011; accepted 9 October 2011.
Keywords: Corticosterone; Ca2+ Signal; NMDA Receptor; Glucocorticoid Receptor; Hippocampus
ABSTRACT
We have examined acute effects of corticosterone (CORT) on N-methyl-D-aspartate (NMDA) receptor-mediated Ca2+ signals in adult mouse hippocampal slices. We found so far that the 30 min preincubation of CORT induced a significant decrease of the peak amplitude of NMDAinduced Ca2+ elevation in the CA1 region. The membrane non-permeable bovine serum albumin-conjugated CORT also induced a similar effect in the CA1 region. Therefore the acute CORT effects should be induced via putative surface CORT receptors. A possible candidate is a classical intracellular glucocorticoid receptor (GR). To confirm this speculation, we here examined the effects of dexamethasone (DEX: an agonist of GR) and CORT with RU38486 (an antagonist of GR) on NMDA-induced Ca2+ signals. As a result, DEX induced a similar effect to the suppressive CORT effect in the CA1 region, and RU38486 inhibited the suppressive CORT effect. These results indicate that the surface CORT receptor should be GR bound to plasma membrane.
1. INTRODUCTION
Corticosterone (CORT) is a principal glucocorticoid synthesized in the rodent adrenal cortex and secreted in response to stress. There are a series of studies about the chronic and genomic effects of corticosteroids in the hippocampus [1,2]. The stress-induced increase in CORT secretion is known to produce neuronal cell damage. Exogeneous application of a high dose of CORT has been shown to elicit the neuronal atrophy in the hippocampus [3]. Rats exposed to restraint stress for 3 weeks exhibited the neuronal atrophy identical to that seen in rats treated with a high dose of CORT for 3 weeks [4]. In addition to these classical genomic effects, which are actuated via intracellular steroid receptors, glucocorticoids act acutely on neuronal excitability [5,6]. The longterm potentiation (LTP) of the population spike amplitude was also acutely (within 1 h) suppressed by a high concentration of glucocorticoids [7]. It has also been demonstrated that CORT dosage for 20 min significantly suppresses the development of LTP in the CA1 region of 4-week-old rat hippocampal slices [8,9].
It is well known that Ca2+ influx via N-methyl-D-aspartate (NMDA) receptors plays a crucial role in the induction of LTP. The acute effects of CORT (appearing within 30 min) on NMDA receptor-mediated Ca2+ signal transduction, however, have not been well elucidated in the hippocampus. In our previous study, we examined the acute CORT effects on NMDA-induced Ca2+ signals in mouse hippocampal slices by using Ca2+ imaging technique. As a result, the 30 min preincubation of CORT induced a significant decrease of the peak amplitude of NMDA-induced Ca2+ elevation in the CA1 region [10]. The membrane non-permeable bovine serum albuminconjugated CORT (BSA-CORT) also induced a similar suppressive effect in the CA1 region. Therefore the acute CORT effect should be induced via putative surface CORT receptors. A possible candidate for surface CORT receptors is a classical intracellular glucocorticoid receptor (GR). If this speculation is confirmed, it will bring a new view into the steroid research because it leads to the conclusion that GRs may drive both classical genomic pathways and non-genomic pathways. However, there is not enough evidence on the speculation by physiological experiments although it is supported in part by some biochemical experiments [11-13]. In the present study, to confirm the speculation, we examined the effects of dexamethasone (DEX; an agonist of GR) and CORT with RU38486 (an antagonist of GR) on NMDAinduced Ca2+ signals in mouse hippocampal slices.
2. MATERIALS AND METHODS
2.1. Chemicals
CORT, DEX, RU38486, cremophor EL and fura-2/AM were purchased from Sigma (St. Louis, MO, USA). All other chemicals were of the highest purity commercially available.
2.2. Slice Preparation
Brain slices (coronal, 300 mm thick) were prepared from 7-week-old male ddY mice after exposure to an overdose diethylether anesthesia. In order to stabilize the plasma glucocorticoid level, mice used in all experiments were decapitated at the same moment (10 am) in the circadian cycle. Following decapitation, the brain was quickly removed and placed in ice-cold oxygenated artificial cerebrospinal fluid (ACSF) (composition in mM: NaCl 124, KCl 5, CaCl2 2, NaHCO3 22, MgSO4 2, NaH2PO4 1.24, glucose 10, pH 7.4, bubbled with 95% O2/5% CO2). Slices were then prepared using a microslicer (DTK-1000; Dosaka-EM, Kyoto, Japan). The slices were recovered in ACSF at 30˚C for 60 min and held at room temperature until use. All experiments using animals were conducted in accordance with the institutional guidelines.
2.3. Ca2+ Measurement
Measurement of intracellular Ca2+ concentration [Ca2+]i was performed using the Ca2+-sensitive indicator fura-2. Prior to Ca2+ signal measurements, the slices were loaded for 30 min at room temperature with 10 mM fura-2/AM (from 1 mM stock solution in dimethyl sulfoxide (DMSO)) in the presence of 0.01% cremophor EL in 7.2 mL of ACSF. After loading with fura-2, the slices were washed in ACSF for 30 min, and then preincubated with CORT, DEX and RU38486 solutions for 30 min. These solutions were prepared at the appropriate dilution with low-Mg2+ ACSF (control solution) (composition in mM: NaCl 124, KCl 5, CaCl2 2, NaHCO3 22, MgSO4 0.1, NaH2PO4 1.24, glucose 10, pH 7.4, gassed with 5% CO2 /95% O2) from the stock solution in DMSO. The final concentration of DMSO was less than 0.05% in each case, and 0.05% DMSO was also contained in the control solution.
For fluorescence measurements of [Ca2+]i, a digital fluorescence microscope system, consisting of an inverted microscope (TE 300; Nikon, Tokyo, Japan) equipped with a xenon lamp for excitation and a CCD camera (C4742-95; Hamamatsu Photonics, Hamamatsu, Japan), was used. Preincubated brain slices were placed in a chamber on the microscope stage. The whole hippocampus fell within the microscope field by using a 4 × fluorescence objective (Nikon, Tokyo, Japan). The slices were then perfused with the preincubation solution kept at 30˚C. At 150 s after the onset of recording, the perfusion solution was replaced to the solution containing 1 mM NMDA.
For Fura-2 measurements, the excitation wavelength was varied discretely between 340 nm and 380 nm, and [Ca2+]i was expressed as the ratio (F340/F380) of the 510 nm fluorescence intensity at 340 nm excitation (F340) to that at 380 nm excitation (F380). In each acquisition trial, consecutive fluorescence images were acquired at 5 s intervals for 350 s. Figure 1 shows examples of a series of obtained images. The fluorescence images were then analyzed with AQUACOSMOS system (Ver.1.3; Hamamatsu Photonics, Hamamatsu, Japan). Eight ROIs (regions of interest), each of which consists of 5 × 5 pixels (100 × 100 mm), were put on the dendritic layer of each hippocampal subfield, and the fluorescence data of those ROIs were averaged.
2.4. Statistical Analysis
The data were expressed as mean ± SEM. The significance of observed differences between groups was examined using the Tukey-Kramer posthoc multiple comparisons test when one way analysis of variance tests yielded p < 0.05. When comparing only one pair, twotailed Student’s t test was used for statistical analysis.
3. RESULTS AND DISCUSSION
Figure 2 shows the typical time courses of NMDAinduced Ca2+ signals obtained from the CA1 region. In this figure, the Ca2+ signal is expressed as the change (D(F340/F380)) in F340/F380 from basal level. The response to continuous NMDA exposure was characterized by a transient elevation in [Ca2+]i followed by decay to a plateau within 150 s (see also Figure 1). The transient elevation in [Ca2+]i was due to NMDA receptor-mediated Ca2+ influx, because no response to NMDA application was observed in the slices preincubated with 100 mM of NMDA antagonist MK-801 (data not shown). In the con-
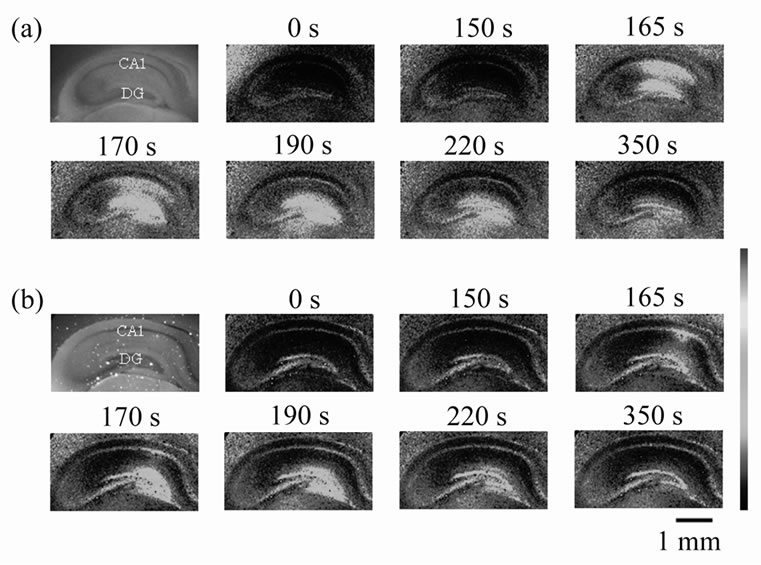
Figure 1. Fluorescence images of mouse hippocampal slices preincubated with (a) the control solution and (b) 1 mM DEX solution. Upper left one of each column is a fluorescence image of each slice. The other pseudo-colored images demonstrate [Ca2+]i in the slices. The color bar shows the low (blue) to high [Ca2+]i (red). The time above each pseudo-colored image shows the time from the onset of experiment. At 150 s, 1 mM NMDA was applied.
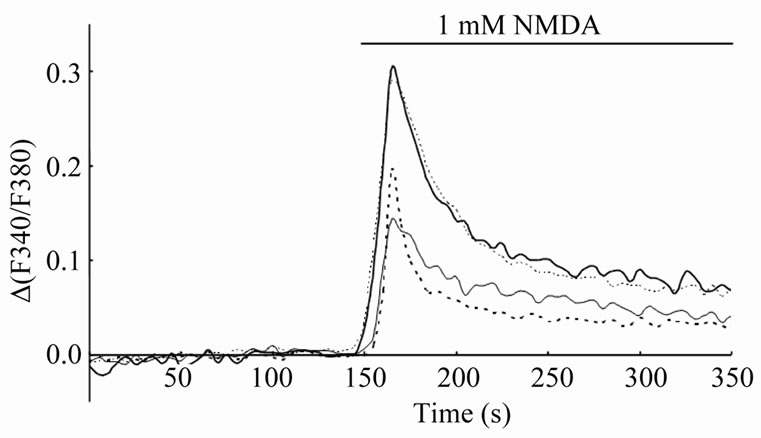
Figure 2. Typical time courses of NMDA-induced Ca2+ signal in the CA1 region. The vertical scale (D(F340/F380)) is the change in F340/F380 from basal level. Thick line; control, thin line; 1 mM CORT dosage, thick-dotted line; 1 mM DEX dosage, thin-dotted line; 1 mM CORT dosage with 5 mM RU38486.
trol slices preincubated with the control solution for 30 min, the peak amplitudes of [Ca2+]i elevation, which are the maximal values of D(F340/F380), were 0.26 ± 0.02 (n = 15) in the CA1 region (Figure 3) and 0.27 ± 0.01 (n = 15) in the dentate gyrus (data not shown). In the CA1 region, the peak amplitude of [Ca2+]i elevation was decreased by preincubation with 1 mM CORT (Figure 2). The decreased peak amplitude was 67.3% ± 13.1% (n = 9, p < 0.05) compared with control (Figure 3). In contrast, the CORT dosage did not significantly affect the Ca2+ signal in the dentate gyrus. It was 97.2% ± 5.8% (n = 9) compared with control (data not shown). Similar results were also obtained in our previous study [10]. In the previous study, we also showed that the membrane
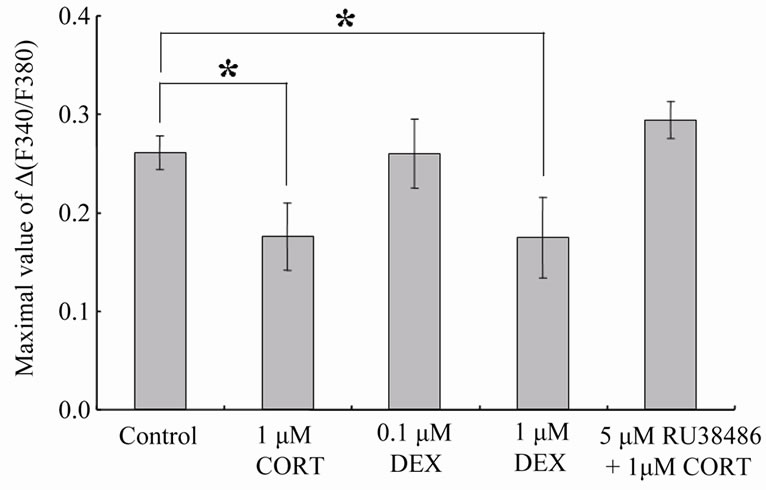
Figure 3. The peak amplitudes of NMDA-induced Ca2+ signal elevation in the CA1 region. The peak amplitudes are the maximal values of D(F340/F380). The data are expressed as means ± SEM. *p < 0.05 compared with control.
non-permeable BSA-CORT induced a similar suppressive effect in the CA1 region. According to the classical view of the steroid action, CORT is thought to penetrate into the cytoplasm of neurons, bind to intracellular receptors and induce genomic effects through new protein synthesis, resulting in the modulation of Ca2+ signals [1- 4]. Our results, however, suggest that CORT may bind to putative surface CORT receptors. In addition, the possibility of genomic mechanisms was excluded as an explanation for the suppressive CORT effect, because cycloheximide, an inhibitor of protein synthesis, did not abolish the suppressive CORT effect [10].
A possible candidate for surface CORT receptors is a classical intracellular glucocorticoid receptor, GR, which may be bound to plasma membranes. To confirm this speculation, we examined the effects of DEX (an agonist of GR) on NMDA-induced Ca2+ signals. In the CA1 region, the peak amplitude of [Ca2+]i elevation was decreased by preincubation with 1 mM DEX (Figure 1(b) and Figure 2), and as expected, the DEX dosage did not significantly affect the Ca2+ signal in the dentate gyrus (Figure 1(b)). In the CA1 region, the decreased peak amplitude was 67.0% ± 15.6% (n = 8, p < 0.05) compared with control (Figure 3). However, 0.1 mM DEX induced no significant effects on the peak amplitude of [Ca2+]i elevation although DEX action upon GR is almost 10 times stronger than that of CORT at the same concentration [14] (In the case of CORT, significant suppressive effects were observed from 0.4 mM [10]). Therefore we further examined the effect of 1 mM CORT with 5 mM RU38486 (an antagonist of GR) on NMDA-induced Ca2+ signals. As the result, the suppressive CORT effect in the CA1 region disappeared by the coexistence of RU38486 (Figure 2). The peak amplitude of [Ca2+]i elevation was 112.7% ± 7.1% (n = 8) compared with control (Figure 3).
4. CONCLUSIONS
We have observed so far the acute suppressive effects of CORT on NMDA receptor-mediated Ca2+ signals in the CA1 region of mouse hippocampal slices. From the present results, we conclude that the binding site inducing the suppressive CORT effect should be a classical intracellular glucocorticoid receptor, GR, bound to plasma membrane. Our conclusion is also supported by other reports that the immunoreactivity of antibodies against GR was associated with plasma membranes from hippocampal and hypothalamic neurons [11] and that specific CORT binding to neuronal membranes occurred in different brain areas with moderate affinity (Kd = 120 nM) [12,13]. Classical GRs are expressed in the cytoplasm of cultured hippocampal neurons [15]. GRs may drive both classical genomic pathways [16] and non-genomic pathways (the current study) in hippocampal neurons.
REFERENCES
- Nair, S.M., Werkman, T.R., Craig, J., Finnell, R., Joels, M. and Eberwine J.H. (1998) Corticosteroid regulation of ion channel conductances and mRNA levels in individual hippocampal CA1 neurons. The Journal of Neuroscience, 18, 2685-2696.
- Reagan, L.P. and McEwen, B.S. (1997) Contoversies surrounding glucocorticoid-mediated cell death in the hippocampus. Journal of Chemical Neuroanatomy, 13, 149 -167. doi:10.1016/S0891-0618(97)00031-8
- Wooly, C.S., Gould, E. and McEwen, B.S. (1990) Exposure to excess glucocorticoids alters dendritic morphology of adult hippocampal pyramidal neurons. Brain Research, 531, 225-231. doi:10.1016/0006-8993(90)90778-A
- Watanabe, Y., Gould, E. and McEwen, B.S. (1992) Stress induces atrophy of apical dendrites of hippocampal CA3 pyramidal neurons. Brain Research, 588, 341-345. doi:10.1016/0006-8993(92)91597-8
- Landfield, P.W. and Pitler, T.A. (1984) Prolonged Ca2+ dependent afterhyperpolarizations in hippocampal neurons of aged rats. Science, 226, 1089-1092. doi:10.1126/science.6494926
- Lupien, S.J. and McEwen, B.S. (1997) The acute effect of corticosteroids on cognition: Integration of animal and human model studies. Brain Research Reviews, 24, 1-27. doi:10.1016/S0165-0173(97)00004-0
- Vidal, C., Jordan, W. and Zieglgansberger, W. (1986) Corticosterone reduces the excitability of hippocampal pyramidal cells in vitro. Brain Research, 383, 54-59. doi:10.1016/0006-8993(86)90007-7
- Kawato, S., Yamada, M. and Kimoto, T. (2001) Neurosteroids are 4th generation neuromessengers: Cell biophysical analysis of steroid signal transduction. Advances in Biophysics, 37, 1-30. doi:10.1016/S0065-227X(03)80002-3
- Shibuya, K., Takata, N., Hojo, Y., Furukawa, A., Yasumasu, N., Kimoto, T., Enami, T., Suzuki, K., Tanabe, N., Ishii, H., Mukai, H., Takahashi, T., Hattori, T. and Kawato, S. (2003) Hippocampal cytochrome P450s synthesize brain neurosteroids which are paracrine neuromodulators of synaptic signal transduction. Biochimica et Biophysica Acta, 1619, 301-316.
- Sato, S., Osanai, H., Monma, T., Harada, T., Hirano, A., Saito, M. and Kawato, S. (2004) Acute effect of corticosterone on N-methyl-D-aspartate receptor-mediated Ca2+ elevation in mouse hippocampal slices. Biochemical and Biophysical Research Communications, 321, 510-513. doi:10.1016/j.bbrc.2004.06.168
- Lipositz, Z. and Bohn, M.C. (1993) Association of glucocorticoid receptor immunoreactivity with cell membrane and transport vesicles in hippocampal and hypothalamic neurons of the rat. Journal of Neuroscience Research, 35, 14-19. doi:10.1002/jnr.490350103
- Towle, A.C. and Sze, P.Y. (1983) Steroid binding to synaptic plasma membrane: Differential binding of glucocorticoids and gonadal steroids. Journal of Steroid Biochemistry, 18, 135-143. doi:10.1016/0022-4731(83)90079-1
- Guo, Z., Chen, Y.Z., Xu, R.B. and Fu, H. (1995) Binding characteristics of glucocorticoid receptor in synaptic plasma membrane from rat brain. Functional Neurology, 10, 183-194.
- Ballard, P.L., Carter, J.P., Graham, B.S. and Baxter, J.D. (1975) A radioreceptor assay for evaluation of the plasma glucocorticoid activity of natural and synthetic steroids in man. The Journal of Clinical Endocrinology & Metabolism, 41, 290-304. doi:10.1210/jcem-41-2-290
- Packan, D.R. and Sapolsky, R.M. (1990) Glucocorticoid endangerment of the hippocampus: Tissue, steroid and receptor specificity. Neuroendocrinology, 51, 613-618. doi:10.1159/000125400
- Nishi, M., Ogawa, H., Ito, T., Matsuda, K.I. and Kawata, M. (2001) Dynamic changes in subcellular localization of mineralocorticoid receptor in living cells: In comparison with glucocorticoid receptor using dual-color labeling with green fluorescent protein spectral variants. Molecular Endocrinology, 15, 1077-1092. doi:10.1210/me.15.7.1077