Health
Vol.5 No.5(2013), Article ID:31931,7 pages DOI:10.4236/health.2013.55116
Calculation of compact amplitude-integrated EEG tracing and upper and lower margins using raw EEG data*
![]()
Department of Biomedical Engineering, Tsinghua University, Beijing, China; #Corresponding Author: dinghy@mail.tsinghua.edu.cn
Copyright © 2013 Dandan Zhang, Haiyan Ding. This is an open access article distributed under the Creative Commons Attribution License, which permits unrestricted use, distribution, and reproduction in any medium, provided the original work is properly cited.
Received 11 March 2013; revised 15 April 2013; accepted 15 May 2013
Keywords: Amplitude-Integrated EEG; Digital Algorithm; Upper Margin; Lower Margin; Compact Tracing
ABSTRACT
Amplitude-integrated EEG (aEEG) is a popular method for monitoring cerebral function. Although various commercial aEEG recorders have been produced, a detailed aEEG algorithm currently is not available. The upper and lower margins in the aEEG tracing are the discriminating features for data inspection and tracing classification. However, most aEEG devices require that these margins be measured semi-subjectively. This paper proposes a step-by-step signal-processing method to calculate a compact aEEG tracing and the upper/lower margin using raw EEG data. The high accuracy of the algorithm was verified by comparison with a recognized commercial aEEG device based on a representative testing dataset composed of 72 aEEG data. The introduced digital algorithm achieved compact aEEG tracing with a small data size. Moreover, the algorithm precisely represented the upper and lower margins in the tracing for objective data interpretation. The described method should facilitate aEEG signal processing and further establish the clinical and experimental application of aEEG methods.
1. INTRODUCTION
Electroencephalography (EEG) constitutes a valuable tool for the continuous evaluation of cerebral function. However, conventional EEG has certain difficulties in clinical brain monitoring, mainly because it is inconvenient to discern long-term EEG trends by inspecting the full-size recording (usually 8 - 10 s per page, i.e., paper speed is about 30 mm/s).
To improve the clinical utility of EEG, researchers in the 1960s developed a simplified EEG monitoring system known as the cerebral function monitor (CFM) [1]. This system uses ongoing amplitudes in a singlechannel EEG. Raw EEG data from biparietal electrodes are compressed over long periods of time to obtain a tracing called the amplitude-integrated EEG (aEEG). Thus, long-term changes and trends in background electrocortical activity can be observed relatively quickly and interpreted easily by physicians and nurses who do not have detailed training in neurophysiology. The general term CFM refers to a family of aEEG recorders that are designed based on the schematic of an analog prototype proposed by Maynard et al. [1]. The terms aEEG and aEEG tracing denote the output of a CFM or other aEEG recorders. Bedside aEEG recording, which provides useful information about brain function prior to clinical manifestation, is currently one of the most popular clinical brain-monitoring methods, especially in pediatric practice [2]. Various commercial aEEG devices and embedded aEEG modules are produced by medical equipment manufacturers. Although substantial research has been performed on aEEG and CFMs, to our knowledge a detailed algorithm for aEEG processing is not available.
The upper and lower margins of the aEEG shape the top and bottom envelopes of the tracing, reflecting the maximum/minimum peak-to-peak amplitudes of the EEG signals. There are 2 main classification methods for aEEG interpretation. The first method is the simple voltage criterion proposed by al Naqeeb et al. [3], which considers the amplitude of the upper/lower margin as the only differential feature. This method defines the normal amplitude as having a lower margin >5 μV and upper margin >10 μV, moderately abnormal amplitude as having a lower margin <5 μV and upper margin >10 μV, and suppressed amplitude as having a lower margin <5 μV and upper margin <10 μV. The second classification method is the pattern criterion, which is based on the recognition of certain defined patterns [4].
In both classification methods, the primary focus is on the upper and lower margins of the aEEG [5]. Unfortunately, the amplitude of the aEEG margins, which serves as an important discriminating index, usually is measured semisubjectively with the naked eye from the voltage scale on printed paper [6,7]. In most cases, a line is drawn manually through the upper and lower margins of the aEEG tracing, with half of the voltage peaks (for the upper margin) or troughs (for the lower margin) below the line and half above [3,8-13]. Therefore, potential bias may be introduced in the assessed amplitudes.
To evaluate the aEEG data quantitatively and to establish the aEEG method in a wider application area, this paper introduced a detailed signal-processing method to obtain a compact aEEG with strictly defined upper and lower margins. The algorithm was employed to calculate aEEG tracings from the raw EEG data of 72 normal/abnormal infants. The acquired aEEG results were compared with the corresponding aEEG tracings exported from a commercial CFM to assess the accuracy of the method.
2. SIGNAL PROCESSING OF aEEG ALGORITHM
2.1. Asymmetrical Filtering
According to Maynard [14], the human EEG is composed of rhythmic activities (e.g., alpha waves in adult) and nonrhythmic activities. The latter attenuate at a rate of approximately 12 dB per decade while they are transferred through the skull and scalp. To give equal weight to the energy of nonrhythmic components at each frequency, an asymmetrical filter has been integrated into the CFM that provides a higher frequency with greater amplification [15] (Figure 1(a)). Based on this EEG feature, we produced a flat band-pass filter and gave it an asymmetrical gain with a slope of 12 dB per decade in the frequency range of 2 - 15 Hz (linear-phase FIR filter designed using the Parks-McClellan algorithm [16]. The filter gave weighted amplification to components at different frequencies in the EEG, while simultaneously attenuating low-frequency artifacts (Figure 1(b)). Figure 1 compares the frequency responses of the typical analog filter used in the CFM with those of the filter designed in the digital aEEG algorithm. As shown in this illustration, the filters have similar frequency features.
 (a)
(a)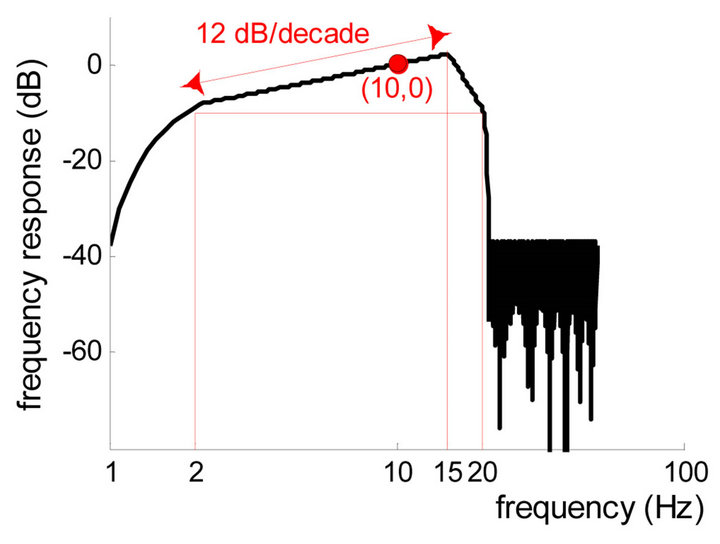 (b)
(b)
Figure 1. Frequency responses of the filters in the CFM and in the algorithm. (a) Schematic diagram of the frequency response of the analog CFM filter, adapted from [15]; (b) Frequency response of the digital aEEG filter in the algorithm. Passband is from 2 to 20 Hz.
2.2. Absolute Value Evaluation
It is technically difficult to register a full-band EEG; DC-coupled amplifiers and a DC-stable electrode-skin interface are necessary [17]. Since the commonly used EEG amplifier has a finite time constant, EEG usually is a biphasic signal without a DC component (i.e., without slow potentials). To acquire the amplitude information of EEG data with a biphasic nature, a fullwave rectifier is employed in CFMs [15]. Accordingly, absolute value evaluation is adopted in the digital algorithm, taking the place of the traditional electronic component to obtain rectified EEG signals (Figure 2(b)).
2.3. Envelope Detection
The purpose of the aEEG method is to monitor the brain function by displaying the amplitude trend of brain activity. It is the boundary of the EEG waveform (i.e., the envelope) and not the EEG itself (i.e., the carrier) that characterizes the tendency of amplitude changes. Mathematically, the envelope is defined as the complex modulus of the analytic signal of the carrier, of which the latter can be calculated using the Hilbert transform. Classical envelope detection in CFM is performed using a diode and a resistor-ca-
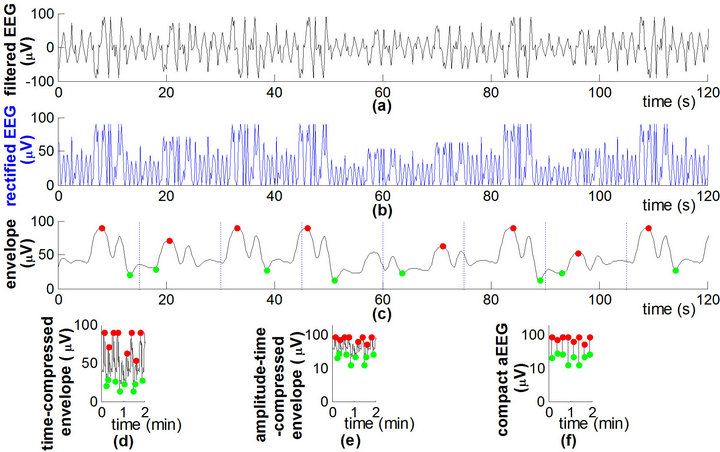
Figure 2. Signal flow graph and calculation parameters of the aEEG algorithm. Signal processing of the aEEG algorithm (schematic diagram). (a) Filtered EEG; (b) Full-wave rectified EEG.; (c) Envelope of the rectified signal, with maximum (red dot) and minimum (green dot) in each 15-s epoch; (d) Timecompressed envelope; (e) Amplitude-time compressed envelope, i.e., aEEG tracing transformed from the envelope; (f) Compact aEEG tracing composed of vertical lines.
pacitor pair with a 0.5-s time constant [15].
In the digital algorithm, a 5-order Butterworth filter was used to acquire the EEG envelope. The process of envelope extraction produces a smooth line approximately drawn through the peaks of the rectified EEG (Figure 2(c)), which concisely represents the amplitude feature of the raw EEG data.
2.4. Tracing Compression
To obtain a bird’s-eye view of the cerebral function over a long duration, the EEG envelope was compressed in the scales of time (x-axis) and amplitude (y-axis). Time compression was achieved by laterally compressing the tracing (Figure 2(d)) (time-scale reference: 6 cm/h [18]). In amplitude compression (Figure 2(e)), the envelope was drawn with a log-scale yaxis (common logarithm, i.e., base 10) to reduce the dynamical range of large fluctuations in the raw EEG (e.g., burst-suppression activities during seizures). However, signals <10 μV were plotted on the linear axis, giving prominence to depressed cerebral activity with low amplitudes.
2.5. Segmentation and Terminal Point Extraction
In an aEEG tracing acquired by envelope compression, many pixels overlap and cover each other; the pixels on the upper and lower edges of an aEEG tracing contain most of the information on cerebral activity (Figure 2(e)). Therefore, the data size of the aEEG can be largely decreased for the sake of data storage and transfer. To obtain a compact aEEG, we simplified the full tracing into a series of vertical lines (Figure 2(f)). More specifically, the envelope of the rectified EEG was divided into nonoverlapping epochs of 15 s durations. The maximum and minimum amplitudes in each epoch were detected as the upper and the lower terminal points of the associated aEEG vertical line. The time resolution of the compact aEEG was 15 s [19].
In practice, the terminal point of the vertical line does not necessarily equal the maximum or minimum of the epoch. To render the algorithm robust against a noisy environment, the high-amplitude noise (e.g., large, sharp waves produced by some clinical interventions) and low-amplitude noise (e.g., electromagnetic interference produced by other medical devices or mains supply) were depressed. This was done by picking up the terminal point near (but not at) the upper/lower edge in the algorithm. In particular, data in each 15-s epoch (i.e., 1500 points, given a sampling frequency of 100 Hz) were sorted and arranged in an ascending order of amplitude. The position of the selected terminal point in the sorted data was defined as the terminal position with the percentage unit. According to the definition, the upper terminal position is a percentage near and <100% while the lower terminal position is a percentage near and >0%; the specific values depend mainly on the signal-to-noise ratio of the EEG, which will be optimized in Section 3.2.
2.6. Margin Calculation
The upper and lower margins of the aEEG reflect the maximum and minimum fluctuations in cerebral activity. In an aEEG tracing composed of vertical lines, the upper and lower margins were depicted easily using the connecting lines of the terminal points (Figure 3(a)). To obtain a smooth and representative margin, the median amplitude of every successive 20 terminal points (i.e., every 5-min segment, given a time resolution of 15 s) was defined as the upper/lower margin of the aEEG in the algorithm (Figure 3(b)). The digital aEEG algorithm and the calculation parameters described above are summarized in Figure 4.
3. EVALUATION OF THE ALGORITHM
3.1. Testing Dataset
To verify the proposed algorithm, 72 infant aEEG tracings and simultaneous EEG data (duration = 137 ± 32 min, sampling frequency = 100 Hz) were analyzed retrospectively. The data were registered using a commercially available CFM (Olympic CFM 6000, Natus, Seattle, WA). Two detecting electrodes were fixed in P3 and P4 in the international 10 - 20 system with a ground electrode placed in Fz. The aEEG tracings covered all 3 aEEG background patterns defined
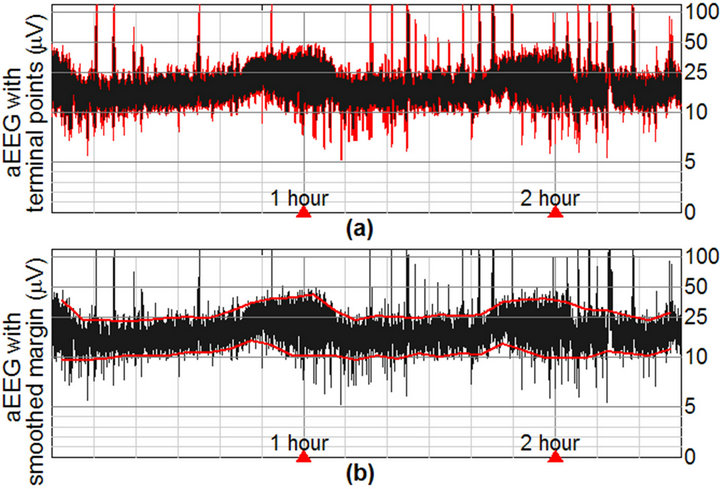
Figure 3. An aEEG tracing (black) with upper and lower margins (red). (a) Unsmoothed margin represented by the connecting line of neighboring terminal points; (b) Smoothed margin averaged in each 5-min segment. Shown aEEG was registered in a full-term infant with normal neurodevelopment.

Figure 4. Signal flow graph and calculation parameters of the aEEG algorithm.
by al Naqeeb et al. [3], thus forming a complete testing dataset for the aEEG algorithm. The 72 infants were suspected of nervous system disorders; therefore, CFM monitoring was integrated into their clinical routine.
All infants were patients in the neonatal ward of Peking University First Hospital, Beijing, China during April to December 2009. The diagnoses of these infants included hypoxic-ischemic encephalopathy (HIE, N = 21), seizures (N = 18), white matter damage (N = 17), intraventricular hemorrhage (N = 11), and normal neurodevelopment (N = 5, control cases). Informed consent was obtained from the parent or legal guardian of each infant. The average postmenstrual age, calculated by adding the weeks of gestational age to the postnatal age, was 42.1 ± 6.5 weeks (range: 31 - 69 weeks). The infant aEEG characteristics are found in [18,20]. Some representative aEEG tracings in the testing dataset are displayed in the left column of Figure 5.
3.2. Error Rate Assessment and Parameter Optimization
Digital aEEG tracings (represented by the x and y coordinate values of each pixel) were exported from the Olympic CFM 6000 to obtain the upper and lower terminal points of the aEEG vertical line in each 15-s epoch. The results were compared with the corresponding terminal points, which were calculated based on the proposed algorithm using the simultaneously recorded EEG data on the same CFM.
We defined the error rate (ER) of the aEEG algorithm as the sum of the amplitude differences of each terminal point pair (i.e., terminal point in CFM tracing vs. the corresponding terminal point in algorithmic tracing) divided by the sum of the amplitudes of each terminal point in the CFM tracing. Accordingly, the ERs of the upper and lower terminal points, denoted as ERU and ERL, respectively, were defined as
 (1)
(1)

Figure 5. Comparison between the aEEG tracings in the Olympic CFM 6000 (left column) and those calculated using the proposed algorithm (right column). (a1,a2) Postmenstrual age (PMA) = 33 weeks; (b1,b2) PMA = 36 weeks; (c1,c2) PMA = 41 weeks; (d1,d2) PMA = 47 weeks. Green dashed line in right column represents the upper/lower margin of aEEG. All infants were diagnosed as having normal neurodevelopment. The aEEG tracings display normal amplitudes.
 (2)
(2)
where AU and AL are the amplitudes of the upper and lower terminal points, respectively. The superscripts “CFM” and “a” indicate whether the amplitude was measured in the CFM tracing or in the algorithmic tracing, respectively.
Considering ERU and ERL as objective functions, the upper and lower terminal positions in the algorithm (as described in Section 2.5) can be optimized using an exhaustive method. Keeping other parameters fixed (refer to Figure 4), we searched for the optimized value of the upper and lower terminal positions to minimize ERU and ERL. Figure 6 shows the curves of ERU and ERL in the terminal position ranges of 80% - 100% and 0% - 20%, respectively. The minimum of ERU was 2.6% at the upper terminal position of 93%, while the minimum of ERL was 4.9% at the lower terminal position of 9%. The aEEG tracings calculated using the optimized upper/lower terminal positions are displayed in the right column of Figure 5 for convenient comparison of the aEEGs of the 2 methods. In addition to the normal aEEGs shown in Figure 5, some typical abnormal aEEG tracings calculated using the raw EEG data in the testing dataset are shown in Figure 7. To conserve space, the CFM tracings are not displayed.
4. DISCUSSION
The present paper introduces a digital algorithm to acquire a compact aEEG tracing composed of vertical lines. Compared with the full-size tracing obtained by compressing the envelope of the rectified EEG, the compact version of the aEEG is faster to calculate and easier to save. In addition, the upper and lower margins of the aEEG are defined properly in the compact-
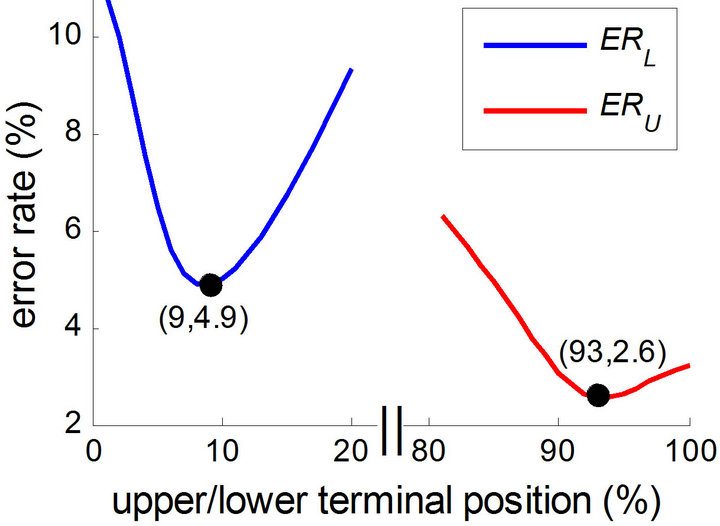
Figure 6. Error rate of upper (ERU) and lower (ERL) terminal points assessed on the testing dataset. ERU and ERL are regarded as functions of the upper and lower terminal positions, respectively. Note that the time axis is not continuous in the figure.
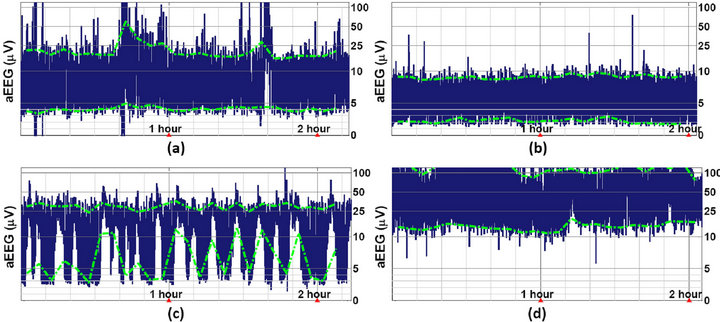
Figure 7. Abnormal aEEG tracings calculated using the proposed algorithm. (a) Moderate HIE, PMA = 45 weeks. The aEEG displays a moderately abnormal amplitude; (b) Severe HIE, PMA = 36 weeks. The aEEG displays a suppressed amplitude; (c) Seizures caused by primary carnitine deficiency, PMA = 40 weeks; (d) West syndrome (or infantile spasms), PMA = 46 weeks.
tracing based on the 2 terminal points of each vertical line. The smoothed margins depicted on the aEEG tracing provide an objective measurement of the trend of the intensity of the cerebral activity, which can largely improve the quality of the aEEG evaluation.
Nonparametric statistics were used to describe the amplitude of aEEG in this paper. The upper/lower margin was smoothed using the median (not the mean) of every 20 terminal points. We optimized the position of the terminal point in the amplitude-sorted data (as shown in Figure 5), instead of optimizing the amplitude itself. The main reason to select nonparametric measures such as the median and percentiles is that they are noise-proof and, thus, insensitive to outliers with extremely high amplitudes. Moreover, the amplitude of the aEEG is not normally distributed, such that nonparametric statistics are more suitable [3,5, 20,21].
As one of the most popular commercial CFMs, the Olympic CFM 6000 CFM was selected in the present study as the standard aEEG recorder to collect reliable aEEG and simultaneous EEG signals. The 72 aEEG data in the testing dataset were carefully selected from hundreds of infant aEEGs: 1) to cover all 3 of the aEEG patterns defined in the voltage classification, and 2) to contain data with different levels of signalto-noise ratios. The error rates of the upper and lower terminal points were 2.6% and 4.9%, respectively, which are acceptable values for clinical application and general research use.
The proposed algorithm has been employed to analyze aEEG data from a large population of infants, and a related article was published in a top journal of pediatrics [20]. Although our clinical and research practice has verified that the algorithm and the calculation parameters shown in Figure 4 are robust in various environment, some of the parameters may need to be adapted using a calibrated method (i.e., as shown in Section 3) if raw EEG data are collected under very special circumstances.
The upper and lower margins of the aEEG contain most of the useful information on cerebral function. There was an initial CFM type called CFAM [22,23] that displayed lines representing the maximum, mean, and minimum amplitudes of the aEEG tracing. This CFM type was helpful for objectively assessing the aEEG margins [24,25]. Unfortunately, this methodology currently is not employed in most CFM products; only aEEG tracings are presented graphically, and so visual inspection is needed to determine the tracing margins in these commercial devices. In this paper, we managed to obtain the accurate amplitude of the aEEG margin, which largely enhanced the objectivity of data interpretation. Quantitative aEEG margins can be obtained along with graphical tracing in some new digital aEEG devices (e.g., the NicoletOne monitor [19]) or in some off-line software (e.g., Brainz Analyze Research [5]). We believe that the aEEG algorithm, including margin display and quantitative output, can be used successfully for both individual CFMs and full-scale EEG monitoring systems.
In summary, a digital signal-processing method was proposed to obtain a compact aEEG tracing with upper and lower margins using raw EEG data. The tracings were compared with those of commercial devices, revealing high consistency. Digitalized aEEG tracing makes it feasible to postprocess the signal and to integrate aEEG features into an automatic classification or diagnosis system. Using the algorithm, researchers can obtain accurate amplitudes of the upper and lower margins for further analysis, thus facilitating the statistical research of large-scale clinical trials. We believe that the step-by-step processing method described in this article provides valuable information on aEEG signal processing. Moreover, this method should help researchers to investigate aEEG tracings without a CFM, potentially promoting the clinical establishment of the aEEG method.
5. ACKNOWLEDGEMENTS
The authors are grateful to Lili Liu, MD (Peking University First Hospital) for her invaluable help in data collecting and sorting.
REFERENCES
- Maynard, D., Prior, P.F. and Scott, D.F. (1969) Device for continuous monitoring of cerebral activity in resuscitated patients. British Medical Journal, 4, 545-546. doi:10.1136/bmj.4.5682.545-a
- Hellström-Westas, L., Rosén, I., de Vries, L.S. and Greisen, G. (2006) Amplitude-integrated EEG classification and interpretation in preterm and term infants. NeoReviews, 7, e76-e86. doi:10.1542/neo.7-2-e76
- Al Naqeeb, N., Edwards, A.D., Cowan, F.M. and Azzopardi, D. (1999) Assessment of neonatal encephalopathy by amplitude-integrated electroencephalography. Pediatrics, 103, 1263-1271. doi:10.1542/peds.103.6.1263
- Toet, M.C., Hellström-Westas, L., Groenendaal, F., Eken, P. and de Vries, L.S. (1999) Amplitude integrated EEG 3 and 6 hours after birth in full term neonates with hypoxic-ischaemic encephalopathy. Archives of Disease in Childhood—Fetal and Neonatal Edition, 81, F19-F23. doi:10.1136/fn.81.1.F19
- Bowen, J.R., Paradisis, M. and Shah, D. (2010) Decreased aEEG continuity and baseline variability in the first 48 hours of life associated with poor short-term outcome in neonates born before 29 weeks gestation. Pediatric Research, 67, 538-544. doi:10.1203/PDR.0b013e3181d4ecda
- Kuint, J., Turgeman, A., Torjman, A. and Maayan-Metzger, A. (2007) Characteristics of amplitude-integrated electroencephalogram in premature infants. Journal of Child Neurology, 22, 277-281. doi:10.1177/0883073807299860
- Toet, M.C. and Lemmers, P.M. (2009) Brain monitoring in neonates. Early Human Development, 85, 77-84. doi:10.1016/j.earlhumdev.2008.11.007
- Burdjalov, V.F., Baumgart, S. and Spitzer, A.R. (2003) Cerebral function monitoring: A new scoring system for the evaluation of brain maturation in neonates. Pediatrics, 112, 855-861. doi:10.1542/peds.112.4.855
- Horan, M., Azzopardi, D., Edwards, A.D., Firmin, R.K. and Field, D. (2007) Lack of influence of mild hypothermia on amplitude integrated-electroencephalography in neonates receiving extracorporeal membrane oxygenation. Early Human Development, 83, 69-75. doi:10.1016/j.earlhumdev.2006.05.004
- Olischar, M., Klebermass, K., Kuhle, S., Hulek, M., Kohlhauser, C., Rücklinger, E., Pollak, A. and Weninger, M. (2004) Reference values for amplitude-integrated electroencephalographic activity in preterm infants younger than 30 weeks’ gestational age. Pediatrics, 113, e61-e66. doi:10.1542/peds.113.1.e61
- Shalak, L.F., Laptook, A.R., Velaphi, S.C. and Perlman, J. M. (2003) Amplitude-integrated electroencephalography coupled with an early neurologic examination enhances prediction of term infants at risk for persistent encephalopathy. Pediatrics, 111, 351-357. doi:10.1542/peds.111.2.351
- Shany, E., Goldstein, E., Khvatskin, S., Friger, M.D., Heiman, N., Goldstein, M., Karplus, M. and Galil, A. (2006) Predictive value of amplitude-integrated electroencephalography pattern and voltage in asphyxiated term infants. Pediatric Neurology, 35, 335-342. doi:10.1016/j.pediatrneurol.2006.06.007
- Thornberg, E. and Thiringer, K. (1990) Normal pattern of the cerebral function monitor trace in term and preterm neonates. Acta Paediatrica Scandinavica, 79, 20-25. doi:10.1111/j.1651-2227.1990.tb11324.x
- Maynard, D.E. (1969) A note on the nature of the nonrhythmic components of the electroencephalogram. Activitas Nervosa Superior, 11, 238-241.
- Prior, P.F. and Maynard, D.E. (1986) Monitoring cerebral function. ELSEVIER, Amsterdam, 91-92.
- McClellan, J.H. and Parks, T.W. (2005) A personal history of the Parks-McClellan algorithm. IEEE Signal Process Magazine, 22, 82-86. doi:10.1109/MSP.2005.1406492
- Vanhatalo, S., Voipio, J. and Kaila, K. (2005) Full-band EEG (FbEEG): An emerging standard in electroencephalography. Clinical Neurophysiology, 116, 1-8. doi:10.1016/j.clinph.2004.09.015
- Hellström-Westas, L., de Vries, L.S. and Rosén, I. (2003) An atlas of amplitude-integrated EEGs in the newborn. The Parthenon Publishing Group, New York, 12-17.
- Niemarkt, H.J., Andriessen, P., Peters, C.H., Pasman, J.W., Blanco, C.E., Zimmermann, L.J. and Bambang Oetomo, S. (2010) Quantitative analysis of amplitude-integrated electroencephalogram patterns in stable preterm infants, with normal neurological development at one year. Neonatology, 97, 175-182. doi:10.1159/000252969
- Zhang, D., Liu, Y., Hou, X., Zhou, C., Luo, Y., Ye, D. and Ding, H. (2011) Reference values for amplitude-integrated electroencephalogram in infants from preterm to 3.5 months of age. Pediatrics, 127, e1280-e1287. doi:10.1542/peds.2010-2833
- Sisman, J., Campbell, D.E. and Brion, L.P. (2005) Amplitude-integrated EEG in preterm infants: Maturation of background pattern and amplitude voltage with postmenstrual age and gestational age. Journal of Perinatology, 25, 391-396. doi:10.1038/sj.jp.7211291
- Maynard, D.E. and Jenkinson, J.L. (1984) The cerebral function analysing monitor. Initial clinical experience, application and further development. Anaesthesia, 39, 678- 690. doi:10.1111/j.1365-2044.1984.tb06477.x
- Sebel, P.S., Maynard, D.E., Major, E. and Frank, M. (1983) The cerebral function analysing monitor (CFAM). A new microprocessor-based device for the on-line analysis of the EEG and evoked potentials. British Journal of Anaesthesia, 55, 1265-1270. doi:10.1093/bja/55.12.1265
- Frank, M., Maynard, D.E., Tsanaclis, L.M., Major, E. and Coutinho, P.E. (1984) Changes in cerebral electrical activity measured by the cerebral function analysing monitor following bolus injections of thiopentone. British Journal of Anaesthesia, 56, 1075-1081. doi:10.1093/bja/56.10.1075
- Verma, U.L., Archbald, F., Tejani, N.A. and Handwerker, S.M. (1984) Cerebral function monitor in the neonate. I: Normal patterns. Developmental Medicine & Child Neurology, 26, 154-161. doi:10.1111/j.1469-8749.1984.tb04426.x
NOTES
*Tsinghua-Yue-Yuen Medical Sciences Fund (20200588); China Postdoctoral Science Foundation (20110490310).