Journal of Environmental Protection
Vol.07 No.10(2016), Article ID:71021,25 pages
10.4236/jep.2016.710118
Portrait and Classification of Individual Haze Particulates
Clara Yuan Li1*, Mingshuai Ding2*#, Yang Yang2*, Pengcheng Zhang2#, Yao Li2, Yuecun Wang2, Longchao Huang2, Pingjiong Yang2, Ming Wang2, Xiao Sha2, Yameng Xu2, Chaowei Guo2, Zhiwei Shan2#
1Weston High School, Weston, MA, USA
2Center for Advancing Materials Performance from the Nanoscale (CAMP-Nano) & Hysitron Applied Research Center in China (HARCC), State Key Laboratory for Mechanical Behavior of Materials, Xi’an Jiaotong University, Xi’an, China
![]()
Copyright © 2016 by authors and Scientific Research Publishing Inc.
This work is licensed under the Creative Commons Attribution International License (CC BY 4.0).
http://creativecommons.org/licenses/by/4.0/


Received: August 2, 2016; Accepted: September 25, 2016; Published: September 29, 2016
ABSTRACT
Haze (known as “Mai” 霾 in Chinese) threatens the health of billions of people across the globe. To begin solving this problem without severely slowing down the economy, one has to mechanistically and geographically pinpoint the sources of these pollutants, the key of which is to thoroughly characterize and fingerprint the particulates. Here we present a broad survey and classification of thousands of individual airborne particulates by using the Scanning Electron Microscope (SEM) to measure their diverse morphologies and chemistries, which could eventually be organized into a “haze fingerprint database”. For instance, one collection in Xi’an City, China during March-April 2014 yielded 494 airborne particulates that settled on silicon wafers placed outside the window of a 3rd floor office. These 494 particulates were manually imaged with high resolution (down to 2 nm), elementally mapped using Energy-dispersive X-ray Spectroscopy (EDS), and were identified and categorized into presumed source classes such as construction activities (Ca, Al, Si-O), coal burning (sulfates), biologic (pollen, bacteria), automotive, mining, steel making, and etc. About 20% of the particulates have mysterious origins, as it is still unclear how they were formed, and a fraction of them contained clearly hazardous elements such as lead and chromium. For future work, we propose using unmanned aerial vehicles with a special “rolling film” substrate that can autonomously collect airborne particulates, a customized SEM auto-imaging system, and machine learning software to establish an online open-access database. The end goal would be to monitor and analyze the particulate pollutants that are pumped into our atmosphere every day, and precisely track down their sources so we can better model and police the quality of the air around us.
Keywords:
PM2.5, PM10, Air Pollution, Fingerprint, Robot

1. Introduction
Air is essential to our everyday living, and with the rapidly decreasing air quality brought about by industrialization and urban development, how to reliably maintain our clear blue skies has become an increasingly urgent concern. China is one of the many countries that suffer tremendously from this problem [1] [2] . In 2013, measurements revealed that PM2.5 was threatening about 1.3 million・km2 and 800 million people in China [3] [4] . The daily average PM2.5 concentrations of 74 major cities exceeded almost twice the US EPA standard for 2/3 of time in January 2013 (The highest daily concentration of 772 µg/m3 even broke the world record) [3] [4] . This is a serious issue not only because pollution hinders the vision and dampens the mood of people, but also because haze [5] has been shown to lead to sharp increases in respiratory diseases [6] . A study on 312,944 people in nine European countries revealed a close correlation between lung cancer and particulate matter air pollution (the hazard ratio for PM10 and PM 2.5 are 1.22 per 10 μg/m3, and 1.18 per 5 μg/m3 respectively) [7] . Furthermore, Chinese air pollution has become a global problem due to the long-range transport of haze from China to North America, the Pacific, and the Arctic [8] . To fight this monstrous condition, the Chinese State Council released the Atmospheric Pollution Prevention and Control Action Plan in 2013, aiming to reduce PM2.5 by 25% before 2017, with an investment exceeding $50 billion from the government [9] . But, there is currently still no economically satisfactory way to resolve the haze hazard. One of the main challenges is pinpointing the exact sources of pollution. In 2014, in order to ensure air quality during an APEC meeting in Beijing, the Chinese government restricted car use, halted factory productions, and gave government employees a weeklong holiday in a large swathe of area around Beijing. This led to dazzling blue skies [10] . Unfortunately, this method is not a sustainable long-term solution, as cities cannot regularly shut down factories and offer holidays at will without severely impacting the economy. Reliable alternative solutions must be employed to recreate these blue skies in major industrial cities around the world. In addition, some PM2.5 particulates are more hazardous than others, and must be regarded with more urgency in our efforts to rid the atmosphere of harmful pollutants. A small portion of the Xi’an sample contained toxic elements such as Lead (Pb) and Chromium (Cr), which are known to cause long-term toxic effects on the human body.
Our recent Scanning Electron Microscopy (SEM) characterizations of airborne particulates indicate that they have highly diverse morphologies and chemistries (see Figure 1). Combined with Energy Dispersive Spectroscopy (EDS) chemical analysis, these individual “portraits” could be used as a high-resolution and full-spectrum “fingerprint” of the haze, containing complete information about the quality of the air around
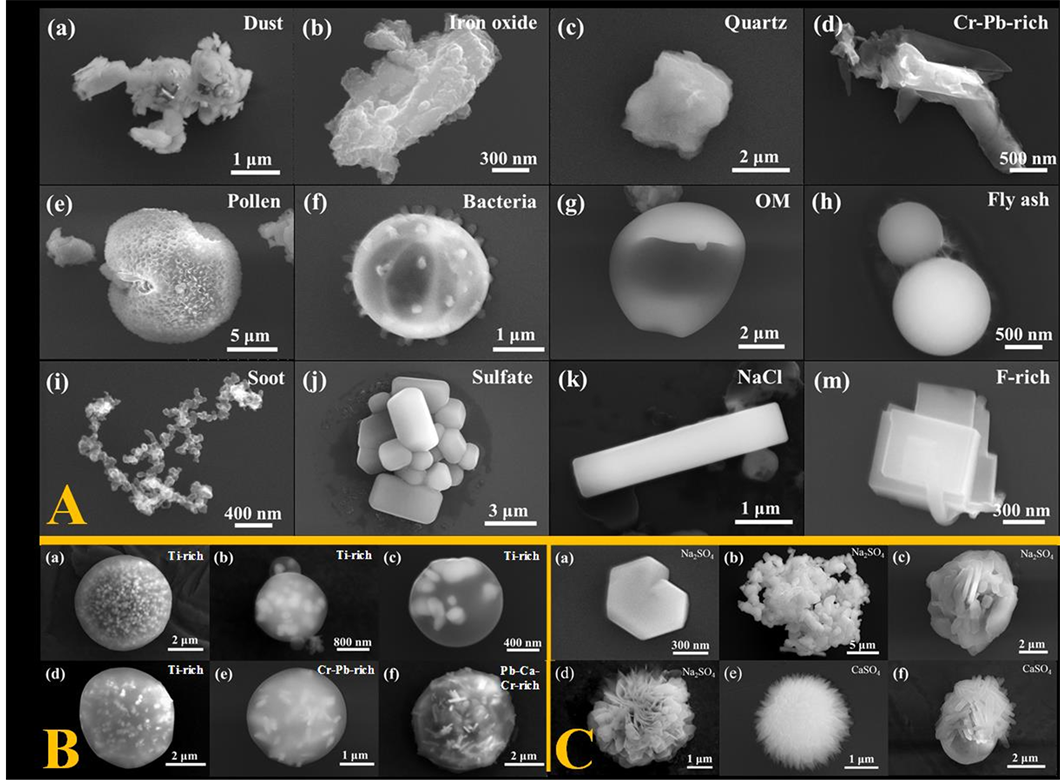
Figure 1. A collage of SEM images for airborne particulates. (A) General classification of airborne particulates; (B) particulates with seeds-coating composite morphology; (C) sulfate particulates with different morphologies.
us. An FBI styled database of these “fingerprints” would make tracking and regulating these sources of pollution far more effective and reliable. In this paper, we will outline our methods and results in developing the technology necessary for acquisition, identification, and classification of these “haze fingerprints” (Section 3). Because these tasks have shown to be very time consuming to complete manually, we propose a future autonomous collection project using unmanned aerial vehicles (drones), custom-made rolling film substrates, SEM auto-imagining stations, as well as facial recognition and machine learning software to classify and analyze the haze particulate population (Section 4). The proposed “environmental robotics” developments would allow us to track and regulate sources of pollution more precisely and efficiently than ever before.
2. Background
2.1. PM2.5, PM10, and Their Potential Threats
Particulate matter (PM) is composed of extremely small particulates. Its components include acids (e.g. nitrates), soil, dust, organic compounds, and metals [11] . The sizes of particulates have a significant impact on its human health effects. For instance, particulates smaller than 10 micrometers (PM10) can easily enter our lungs through the throat and nose. Based on their sizes, PM pollutants are organized into two categories: 1) “Inhalable coarse particulates”, which describes particulates that are between 2.5 and 10 micrometers in diameter and 2) “PM2.5”, which describes particulates that are smaller than 2.5 micrometers in diameter. These particulates come in many different shapes and can be made of multiple chemicals.
Since PM2.5 serves as the main component of haze [12] , it is vital to study what it is and where it comes from. However, the diversity and complexity of these particulates have created many challenges for its study [4] . So far, it is believed that PM2.5 can be grouped into two categories: 1) “Primary particulates”, which are emitted directly from sources such as factories, construction sites, fires and power plants, etc. For example, one of the authors has witnessed firsthand that dust generated inside a factory producing thermal insulation (mineral wools) material for steam pipes was directly ventilated into the sky by numerous large ventilation fans mounted on the factory roof. 2) “Secondary particulates”, which form in the atmosphere as a result of complicated reactions between multiple chemicals [11] . R. Huang et al.’s recent paper in the Nature journal showed that secondary aerosol formation was one of the main driving forces of severe haze pollution as it contributed 30% - 77% of PM2.5 and 44% - 71% of organic aerosol based on measurements in four cities [4] .
The negative health effects of haze are broadly well known, but it turns out that haze particulates can also affect machinery by infiltrating air-breathing engines (causing erosion of blades, etc.), bearing and gears, mechatronic devices, etc. The mechanical hardness of some haze particulates has been shown to exceed 10 GPa, which can cause severe erosion, wearing and corrosion issues on metals and coatings [13] .
2.2. Analysis of PM2.5 and PM10 by Electron Microscopy
In the past, researchers have utilized various technologies to analyze the haze as a whole [4] [12] [14] - [16] : 1) A microbalance for measuring PM mass; 2) Ion Chromatography to detect ions; 3) A Thermo-optical Carbon Analyzer for collecting information about elemental carbon (EC)/organic carbon (OC) compounds; 4) Energy-dispersive X-ray Fluorescence (ED-XRF) Spectrometry for elemental composition; 5) Chemical Deriva- tization Gas Chromatography/Mass Spectrometry (GC/MS) for organic markers; 6) Particulate Induced X-ray Emission (PIXE) for elemental concentrations from Al to Pb; 7) Radiocarbon (14C) measurements for differentiation between fossil and non-fossil sources. However, these techniques only provide information on the average haze ensemble and lose track of each particulate’s or particulate class’s individuality [17] . In our analogy to criminal justice, this would be like acquiring district-wide crime statistics without tracking down individual criminals.
Recently, electron microscopes, such as the Scanning Electron Microscope (SEM) and the Transmission Electron Microscope (TEM), have been used for characterization of individual airborne particulates. These microscopes are powerful tools in determining the sources, formation, and influences of PM2.5 due to their capability of analyzing morphology, chemical composition, and crystal structure (unique in TEM) down to the nanometer scale [18] [19] . In previous studies, various types of airborne particulates have been found to have many different morphologies and chemical compositions [17] - [20] , and there is some preliminary research on source apportionment. For example, Pachauri et al. found that crustal materials are the primary contributors of airborne particulates at the site he studied because soil related aerosols were dominant during the sampling period [17] . Although these tools are extremely helpful, we believe that there are two factors limiting the power of the electron microscope. Firstly, in previous studies, only information on the chemical compositions of the particulates has been employed, and their morphologies, which are no less important, have not been used. These unique morphologies, together with a spatial mapping of their chemical compositions, are key to forming the full-spectrum “fingerprint” of the haze and revealing information on the sources of pollution. Secondly, the characterization of airborne particulates by SEM/TEM is relatively time-consuming due to the sheer number of particulates collected. So far, only Wagner et al. have reported an automatic SEM analysis software on airborne particulates [20] . However, their software can only identify particulate size, elemental chemistry, and magnification data, while morphologies remain ignored. Again returning to our fingerprint analogy, this is like trying to track down a criminal based on a verbal description but no photograph.
These two problems can be solved by developing software and hardware for autonomous acquisition, identification, and classification of airborne particulates on the SEM/TEM as a “haze fingerprinting robot”. This would be a powerful tool for building an accessible airborne particulate database and helping to understand how haze forms, while simultaneously providing means for policing and regulating air pollution in real time, as the regulation of air pollution has historically followed the development of efficient measuring techniques [21] .
3. Our Approach and Results
The main results of this work are illustrated in Figure 1, where the airborne particulates collected outside the window of a 3rd floor office on the campus of Xi’an Jiaotong University, China are classified based on their morphologies and chemical compositions. It can be seen that the spatial features are very complex, often forming secondary structures (see Figure 1B(e) and Figure 1B(f) for example, where harmful lead and chromium oxide nanoparticles are encased in carbonaceous spherical coating). These features could serve as “fingerprints” to identify origins of formation.
To help identify the formation origins of haze particulates shown in Figure 1, which were collected from random locations that may have been far away from their source of emission, we have also collected reference particulate samples from well-controlled reference environments, for example by affixing the collection plate right behind the exhaust pipe of a running vehicle, or putting it near the site of open-burning of crop straws, construction, kitchen with cooking fume, etc. The chemical compositions and morphologies of such reference particulates from some of the reference sources are summarized in Figure 2. This reference database will help us in postulating where the haze particulates collected at random locations may originate from, as shown in the following sections.
3.1. Methods
To collect the particulates from the surrounding atmosphere, we place a polished industrial-grade Si wafer substrate, thoroughly rinsed with deionized water, at different locations in Xi’an city, China. The airborne particulates naturally adhere to the substrate due to gravity and various intermolecular forces. In one collection instance, the wafer was placed outside a 3rd floor window of the State Key Laboratory for Mechanical Behavior of Materials inside the campus of Xi’an Jiaotong University, China. The typical collection duration is 24 hours before being prepared for analysis inside the SEM.

Figure 2. A collage of SEM images for reference particulates collected from well-controlled reference environments: (a) dust particulates from soil and roads; (b) emission collected directly from solid fuel combustion; (c) emission collected directly behind the exhaust pipe of running vehicles.
The corresponding air quality evolution of Xi’an is shown in Figure 3, which is quite typical for major cities in China.
Once plenty of particulates have gathered on the Si wafer, it is placed inside a Hitachi SU6600 SEM. A human operator completes image centering, acquisition, and spectroscopic recording manually, which is very time-consuming. The chemical compositions are then mapped with EDS. As the particulates are quite small compared to the spatial resolution of the EDS machine (3 - 4 µm), the contribution from elements in the original substrate is quite significant. Since our substrate is made of Si, when trying to characterize Si content in the particulates, we need to transfer the particulate to a Cu substrate.
3.2. Examples of Particulate Classes
Below, we group our observations of the particulates into classes mainly based on their chemical compositions. As a matter of notation, the majority elements will be denoted with their full elemental names (“Carbon, Phosphorous”), while the minority elements will be denoted with abbreviated atomic symbols (“K, Ca”).
3.2.1. Major Components: Carbon, Oxygen. Minor Components: P, K, Ca
These particulates shown in Figure 4 are relatively large (20 µm) and easier to collect on sunny days in the spring season. They appear less frequently on rainy days, as they tend to break up when in contact with water. They have relatively poor electrical conduction and appear sensitive to the electron beam. Due to the charge accumulation in SEM imaging, their morphologies tend to change in real time under the electron beam

Figure 3. Air quality reported for Xi’an city, China, Feb. 28 to April 29, 2014.

Figure 4. Typical morphologies of the Carbon-Oxygen-P-K-Ca group.
radiation of the SEM. They do not contain Si. We believe these are pollen particulates of biologic origin.
3.2.2. Major Components: Carbon, Oxygen
This class of particulates shown in Figure 5 demonstrates a very rich and wide range of morphologies, some of which are clearly biologic, and others simpler spherical, ellipsoidal, or oblate thin sheet shapes. They may contain Si, but it has not been verified. Some of them could originate from burning wood, coal, straws, etc. in open air.
3.2.3. Major Components: Carbon
These particulates shown in Figure 6 are usually small (a few hundred nanometers), with compositions containing pure carbon (no oxygen or silicon). They are very common amongst our collection and tend to link up into chains. We believe they are soot particulates, formed as a product of burning or combustion.
3.2.4. Major Components: Silicon, Oxygen, Aluminum
These particulates in Figure 7 range in size from 0.3 µm to 5 µm, with a quite fixed

Figure 5. Typical morphologies of the Carbon-Oxygen group.

Figure 6. Typical morphologies of the Carbon group.

Figure 7. Typical morphologies of the Silicon-Oxygen-Aluminum group.
composition ratio of Silicon: Oxygen: Aluminum. They have relatively diverse morphologies, albeit most are variations of a spherical shape. Amongst all the spherical airborne particulates collected, this group occupies the largest fraction. We believe these originally were dust (since geologic minerals like sand particles mainly contain Silicon, Oxygen, Aluminum) that could come from construction activities, but the round shapes indicate that melting or erosion has occurred. We postulate these spherical particles have undergone fragmentation/melting inside engines, boilers, and burners, which take in primary dust-containing air and exhale out smaller round-shaped particulates.
3.2.5. Major Components: Iron, Oxygen
This group contains particulates with sizes ranging from 0.1 µm to 5 µm and a relatively invariant Iron: Oxygen ratio. More than 50% of these particulates are spherical, as shown in Figure 8. When the size is above 1 µm or so, grain boundaries seem to appear that intersect and roughen the surface. When the size is below 1 µm, the particulate surface is relatively smooth. The electrical conductivity of these particulates appears to
![]()
Figure 8. Typical morphologies of the Iron-Oxygen group.
be good. The spherical particulates tend to be associated with some miniature string- like particulates, which are so small that their compositions cannot be determined by the SEM. These Iron-Oxygen particulates are mechanically very strong and would damage air-breathing engines and machines [13] . We postulate these particles originate from mining, smelting, calcining, refining, etc. extractive metallurgy activities.
3.2.6. Major Components: Sodium, Chlorine
These particulates in Figure 9 are often facetted, which means they could be single crystals. Their Sodium: Chlorine ratio is quite fixed. The particulates that are directly collected tend to be very small (50 nm to 1 µm), while those that should have been re-precipitated out after dissolving into water have larger sizes. While these particulates are considered relatively rare in our collection, they tend to show up in bursts and have fluctuating appearances in time. We believe these could generally originate from cooking fume ventilation, chemical industries, snow melting, or ocean mist. (Xi’an is far inland, and the Chinese do not use salt to melt snow nearly as much as Americans do, so the latter two possibilities are not likely in Xi’an).
![]()
Figure 9. Typical morphologies of the Sodium-Chlorine group.
3.2.7. Major Components: Sulfur, Oxygen, Calcium
These particulates in Figure 10 tend to be relatively small (1 - 5 µm) and frequently observed. They tend to have facetted morphology and therefore should consist of single crystals. Sulfur is a component of acid rain, and we believe these could come from coal-burning power plants, coal-burning boilers, and automotive exhausts.
3.2.8. Major Components: Sulfur, Oxygen, Sodium
A portion of these particulates shown in Figure 11 have biologic morphologies, while the remainder have crystallographic (facetted) morphologies. They are quite sensitive to the electron beam. We believe these could also come from coal-burning power plants, coal-burning boilers, and automotive exhausts.
3.2.9. Major Components: Carbon, Oxygen, Calcium
The Carbon: Oxygen: Calcium ratio appears quite fixed for this group. Portions of these particulates have crystallographic (facetted) morphologies, with sizes ranging from 500 nm to 5 µm. They are quite common, but their morphologies do not have many characteristic features as seen in Figure 12. They also tend to be mixed with other materials, forming multi-phase mixtures, which makes the analysis more challenging. We believe these could come from construction or cement making.
3.2.10. Multiphase Mixtures: Sulfur, Oxygen, Calcium, Aluminum
This group of particulates consisted of typically multi-phase mixtures: for example, see Figure 13, upper left, where the S-O-Cananocrystals are attached to a Si-O-Al spherical
![]()
Figure 10. Typical morphologies of the Sulfur-Oxygen-Calcium group.
particulate. Since Sulfur is one of main components of acid rain, we believe these could come from coal-burning power plants, coal-burning boilers, and automotive exhausts, mixed with other pre-existing particulates.
3.2.11. Multiphase Mixtures: Oxygen, Silicon, Aluminum, Sodium
These particulates are typically multi-phase mixtures with variable Oxygen: Silicon: Aluminum: Sodium ratios. Their morphologies have no easily defined characteristics as seen from Figure 14. We believe these have geologic origins and can be classified as dust.
![]()
Figure 11. Typical morphologies of the Sulfur-Oxygen-Sodium group.
![]()
Figure 12. Typical morphologies of the Carbon-Oxygen-Calcium group.
3.2.12. Sodium-Prevalent Particulates
In this group shown in Figure 15, the spectral contribution from metallic elements
![]()
Figure 13. Typical morphologies of the multiphase Sulfur-Oxygen-Calcium-Aluminum group.
![]()
Figure 14. Typical morphologies of the multiphase Oxygen-Silicon-Aluminum-Sodium group.
other than Sodium is rather weak. We have no clue about their possible origins.
3.2.13. Calcium-Prevalent Multi-Phase Particulates
In this group of particulates shown in Figure 16, the spectral contribution from metallic elements is dominated by Calcium, but there are also diverse contributions from non-metallic elements. Their morphologies are also very diverse. We believe they could originate from cement making.
![]()
Figure 15. Typical morphologies of the Sodium-prevalent group.
![]()
Figure 16. Typical morphologies of the Calcium-prevalent multi-phase particulates.
3.2.14. Zinc-Containing Particulates
Zinc is relatively rare in our day-to-day life, and these particulates are also quite rare in our collection. Their sizes tend to be small, but their shapes vary widely, with no clear characteristics as shown in Figure 17. We cannot pinpoint their exact origins, but they could come from erosion of zinc-plated metals.
3.2.15. Titanium-Containing Particulates
These Titanium-containing particulates have a very distinct seed-shell morphology as shown in Figure 18. The shell coating consists mostly of Carbon and Oxygen, while the seeds contain Titanium. Each individual Titanium-Oxygen seed is very small, on the order of ten nanometers. The shell coating can be spherical or ellipsoidal. They appear relatively infrequently in our collections. We cannot pinpoint their exact origins. Titanium Oxide (TiO2) is frequently used as white pigment in paints, but how they get so small and encased in spherical carbon shell is entirely mysterious.
![]()
Figure 17. Typical morphologies of the Zinc-containing particulates.

Figure 18. Typical morphologies of the Titanium-containing particulates.
3.2.16. Fluorine-Containing Particulates
These Fluorine-containing particulates appear relatively infrequently in our collection. They are smaller in size with varied shapes as shown in Figure 19. Fluorine is found in toothpastes.
3.2.17. Toxic Heavy-Metal Containing Particulates
Lead or Chromium elements are found in these airborne particulates shown in Figure 20, which are not very common in our collection, but should be alarming nevertheless because of the severe long-term health effects they have been shown to cause. They should come from automotive exhaust, where the gasoline grade may contain excess lead.
3.2.18. Non-Toxic Heavy-Metal Containing Particulates
Heavy metal elements are relatively rare in our day-to-day environment, but these heavy metal element particulates indeed exist in haze. The spherical MnO2 one (Figure 21) may come from iron smelting.
3.2.19. Complex Multi-Phase Particulates
As shown in Figure 22, these particulates are larger in size, with complex chemistries that usually contain Oxygen, Iron, Magnesium, Aluminum, Calcium, Potassium or Sodium.

Figure 19. Typical morphologies of the Fluorine-containing particulates.

Figure 20. Some morphologies of the Lead or Chromium-containing particulates.

Figure 21. Some morphologies of the Manganese or Tellurium or Copper-containing particulates.

Figure 22. Some morphologies of the complex multi-phase particulates.
They are the most commonly seen in our collections. We believe they could come from metal extraction industry or are secondary products of air-breathing burners, in particular the round metal-oxide particles where high temperature processing needs to be involved.
3.2.20. Indoor Particles
Some other collection efforts in different indoor locations (such the kitchen, bathroom, and patio) yielded interesting images of particles shown below in Figure 23. Some have

Figure 23. An interesting gallery of miscellaneous particles.
features that would allow them to be classified into the categories described above, while others simply have mysterious origins.
3.3. Observations
Based on the manual characterization and classification shown above, we have already seen that the airborne particulates collected are very complex and diverse in terms of both their morphologies and chemical compositions. In the early spring season, pollen, soot, and silicate-based dust are the main components of collected particulates. While soot and pollen have strong morphological and compositional characteristics, the dust particles vary greatly in shape and the minor elements that they contain. They are often mixed with particulates of other origins.
Spherical particulates are seen relatively frequently, with diameters ranging from 100 nm to 5 µm. Ranked in order of commonality, the leading three are 1) Aluminum-Sil- icon-Oxygen (likely dust minerals), 2) Iron-Oxygen (likely from the metal extraction industry), and 3) Carbon (likely burning of coal, wood, and biological waste). Number 1) occupies more than half of the collection, and some particulates within this group also contain minor elements like Fe, Mg, Na, Ca, K, and etc. 2)’s morphologies correlate with the sizes of the particles: i.e. when the particle diameter is large (>1 µm), its surface tends to contain a lot of grooves that divide the particle into grains; when its diameter is small (<1 µm), the surface tends to be very smooth. Particles in group 3) appear less frequently than those of the other two groups and tend to have rather smooth surfaces that also contain trace amounts of O.
Salt particulates such as Sodium-Oxygen-Sulfur, Calcium-Oxygen-Sulfur (likely sulfates like Na2SO4, CaSO4, which are major acid rain components that likely originate from coal and gasoline burning), Calcium-Oxygen-Carbon (likely carbonates like CaCO3), Sodium-Chlorine (NaCl), and etc. can also be seen in the collection. These particulates tend to have crystallographic (facetted) shapes.
Lastly, the less abundant elements (Fluorine) and heavy metal elements (Manganese, Zinc, Titanium, Copper, Chromium, Tellurium, Lead) can also be found in the haze particulates in Xi’an. The Titanium containing particulates are quite distinct, usually with a seeds-shell structure in which the shell contains mostly Carbon and Oxygen, while the seeds contain Titanium.
Here we classified the particulates based on both SEM images and EDS results. The following information can be achieved through the combination of SEM-EDS: morphology, size, surface structure, electrical conductivity, elemental composition as well as their statistical distributions. Based on this information, the potential sources of these particulates can be inferred. The combination of SEM-EDS provides a complementary view on studying haze, focusing on individual particles instead of the commonly applied particle-averaging chemical analysis methods.
4. Future Work
While the results above illustrate the power of creating a haze particulate database, using manual operations to “fingerprint” haze particles is clearly a very onerous task. Here we advocate for developing autonomous “haze fingerprinting” technologies that could accelerate the whole process, from particulate collection using a rolling “film” substrate mounted on a GPS guided unmanned flying vehicle (drone) and a customized SEM imaging station that could analyze the rolling film in a plug-and-play fashion, to applying facial recognition and machine learning algorithms etc. to identify and classify the results, to creating an open-access online database to archive and distribute information about haze. The information achieved through our SEM-EDS system will be used to build up the “fingerprinting” portrait of haze particles. Given enough haze particles’ information collected and their sources identified, the database can serve as a powerful tool to identify the pollution source in a timely manner and therefore facilitate the pollution control.
4.1. Drone-Mounted Haze Particulate Collection
Chinese legislature has already opened drone space for civilian use in 2015. We will develop new hardware for PM2.5 and PM10 collection, mounting a flexible and lightweight (<200 grams including power supply) substrate that can be rolled as in a film cartridge onto a Quadcopter drone. The drone could be programmed to fly over factory roofs, construction and mining sites, etc. with the rolling collection substrate capturing most of the airborne particulates by Van der Waals adhesion. The drone could then return the cartridge with time-stamped GPS coordinates to the SEM operator at a county-level Environmental Protection Office, who would simply need to insert the cartridge into a custom-modified SEM port to automatically start the “haze fingerprinting” process.
4.2. Image Acquisition
We will establish high-throughput automated SEM image acquisition by developing software and hardware controls. They would be able to scan the substrate, zoom in, and focus on one individual particulate at a time, taking hundreds of high-resolution images with EDS elemental mapping overnight, which would normally take weeks manually. The envisioned machine would (a) take high-resolution images without human supervision, and (b) identify the image for each individual particulate by partitioning the image. Step (a) requires a modification of the SEM hardware so that it could accept the rolling substrate from an external port without breaking vacuum (through an air lock mechanism as in Space shuttles) and transfer the film with collected particulates the scanning electron beam. Machine control of the SEM has already been realized using existing virtualization platforms―in other words the SEM can be controlled by software instructions rather than by human operation. Step (b) can be achieved using software entirely with open source codes like ImageJ.
4.3. Automatic Classification
We will apply machine learning to the particulate images to classify them based on their nanoscale morphologies and chemistries, using algorithms such as Support Vector Machines classification. This function would involve two parts:
a) Theoretical classification of different particulates based on their size, morphologies, and chemical compositions. Since different research interests might lead to different areas of expertise, it should be helpful to design an open-source platform that enables developers to enrich and modify the classification rules per their own research experiences. Unique distributions of particulates’ types and sizes after classification would be referred “fingerprints” of the corresponding samples.
b) Recognition. Image recognition has received increasing attention in both academic and industrial communities in recent years. Real world objects usually have different appearances when viewed from different perspectives, and a combination of all these perspectives forms the high-dimensional description of the object. In order to recognize the object, it would then be necessary to find meaningful low-dimensional structures hidden in their high-dimensional observations. In recent years, a number of manifold learning algorithms have been proposed to discover the intrinsic low-dimensional embedding of original data [22] , and most of them have been successfully applied to facial recognition. The basic assumption behind these methods is that high-dimensional data can be considered as a set of geometrically related points lying on or nearby a smooth low-dimensional manifold. While encouraging results can be obtained, these methods simply assume that samples from different classes define a single manifold in the feature space, which may not hold in many practical applications because samples from different classes could lie on different sub-manifolds [23] . Inspired by this observation, several multi-manifold learning algorithms have been proposed in recent years [24] that model samples from the same class as a manifold and approach the recognition task as a manifold?manifold matching problem. Neural network is another approach. We can employ the various techniques above in our autonomous recognition and classification of airborne particulates.
4.4. Big Data
We would like to establish "fingerprint" databases at a county-by-county level, where all the factories and potential source (such as mining) sites in a county are sampled by drones at rooftop level at different times and under different weather conditions (e.g. humidity and sunlight that could drive secondary reactions need to be recorded in situ.) Eventually, the county-by-county databases with factory-by-factory “haze fingerprints” over an extended time period would allow one to establish transport and reaction models, aided by scientific studies about the formation mechanisms of particulate matter. This time-stamped and GPS annotated database would be distributed freely to the entire world via the web.
5. Conclusion
Everyone cares about the air they breathe in. This paper has shown that we are already equipped with the basic tools to look at particulate pollution at much greater details than what a single reported value like “200 µg/m3” could reflect. Our detailed portraits will help environmental scientists to develop better models for haze evolution and transport, and also will greatly benefit the establishment of a real-time air pollution monitoring system, for research and environmental protection in the future. The methods listed above would help greatly accelerate the creation of an “environmental robotics” system and an open-source haze database, which much like an FBI fingerprint database, would make the tracking and policing of air pollution much more efficient and effective.
Acknowledgements
We thank the Environmental Monitoring Station of Xi’an for their help and encouragements.
Cite this paper
Li, C.Y., Ding, M.S., Yang, Y., Zhang, P.C., Li, Y., Wang, Y.C., Huang, L.C., Yang, P.J., Wang, M., Sha, X., Xu, Y.M., Guo, C.W. and Shan, Z.W. (2016) Portrait and Classification of In- dividual Haze Particulates. Journal of Environmental Protection, 7, 1355-1379. http://dx.doi.org/10.4236/jep.2016.710118
References
- 1. World Health Organization (2016) WHO Global Urban Ambient Air Pollution Database (Update 2016).
http://www.who.int/phe/health_topics/outdoorair/databases/cities/en/ - 2. Donkelaar, A.V. and Villeneuve, P.J. (2010) Global Estimates of Ambient Fine Particulate Matter Concentrations from Satellite-Based Aerosol Optical Depth: Development and Application. Environmental Health Perspectives, 118, 847-855.
http://dx.doi.org/10.1289/ehp.0901623 - 3. China National Environmental Monitoring Centre (2013) Air Quality Report in 74 Chinese Cities in March and the First Quarter 2013.
http://www.cnemc.cn/ - 4. Huang, R.-J., et al. (2014) High Secondary Aerosol Contribution to Particulate Pollution during Haze Events in China. Nature, 514, 218-222.
http://dx.doi.org/10.1038/nature13774 - 5. Zhang, Q., He, K. and Huo, H. (2012) Policy: Cleaning China’s Air. Nature, 484, 161-162.
- 6. Chen, R., Zhao, Z. and Kan, H. (2013) Heavy Smog and Hospital Visits in Beijing, China. American Journal of Respiratory and Critical Care Medicine, 188, 1170-1171.
http://dx.doi.org/10.1164/rccm.201304-0678LE - 7. Raaschou-Nielsen, O., et al. (2013) Air Pollution and Lung Cancer Incidence in 17 European Cohorts: Prospective Analyses from the European Study of Cohorts for Air Pollution Effects (ESCAPE). The Lancet Oncology, 14, 813-822.
http://dx.doi.org/10.1016/S1470-2045(13)70279-1 - 8. Wang, Y., Zhang, R. and Saravanan, R. (2014) Asian Pollution Climatically Modulates Mid-Latitude Cyclones Following Hierarchical Modelling and Observational Analysis. Nature Communications, 5, 3098.
http://dx.doi.org/10.1038/ncomms4098 - 9. Chinese State Council (2013) Atmospheric Pollution Prevention and Control Action Plan.
http://www.gov.cn/zwgk/2013-09/12/content_2486773.htm - 10. China State Media Defends “APEC Blue” Skies (2014).
https://www.yahoo.com/news/china-state-media-defends-apec-053337630.html?ref=gs - 11. US Environmental Protection Agency (2016) Particulate Matter Pollution.
https://www.epa.gov/pm-pollution - 12. Liu, J., et al. (2014) Source Apportionment Using Radiocarbon and Organic Tracers for PM2. 5 Carbonaceous Aerosols in Guangzhou, South China: Contrasting Local-and Regional-Scale Haze Events. Environmental Science & Technology, 48, 12002-12011.
http://dx.doi.org/10.1021/es503102w - 13. Ding, M., Han, W., Li, J., Ma, E. and Shan, Z. (2015) In Situ Study of the Mechanical Properties of Airborne Haze Particles. Science China Technological Sciences, 58, 2046-2051.
http://dx.doi.org/10.1007/s11431-015-5935-8 - 14. Feng, J., et al. (2012) Source and Formation of Secondary Particulate Matter in PM2. 5 in Asian Continental Outflow. Journal of Geophysical Research: Atmospheres, 117, Article ID: D03302.
http://dx.doi.org/10.1029/2011JD016400 - 15. Yu, L., et al. (2013) Characterization and Source Apportionment of PM2. 5 in an Urban Environment in Beijing. Aerosol and Air Quality Research, 13, 574-583.
- 16. Cao, J.-J., et al. (2012) Winter and Summer PM2. 5 Chemical Compositions in Fourteen Chinese Cities. Journal of the Air & Waste Management Association, 62, 1214-1226.
- 17. Pachauri, T., Singla, V., Satsangi, A., Lakhani, A. and Kumari, K.M. (2013) SEM-EDX Characterization of Individual Coarse Particles in Agra, India. Aerosol and Air Quality Research, 13, 523-536.
- 18. Li, W. and Shao, L. (2009) Transmission Electron Microscopy Study of Aerosol Particles from the Brown Hazes in Northern China. Journal of Geophysical Research: Atmospheres, 114, 9.
http://dx.doi.org/10.1029/2008jd011285 - 19. Geng, H., Ryu, J., Maskey, S., Jung, H.-J. and Ro, C.-U. (2011) Characterisation of Individual Aerosol Particles Collected during a Haze Episode in Incheon, Korea Using the Quantitative ED-EPMA Technique. Atmospheric Chemistry and Physics, 11, 1327-1337.
http://dx.doi.org/10.5194/acp-11-1327-2011 - 20. Wagner, J., Naik-Patel, K., Wall, S. and Harnly, M. (2012) Measurement of Ambient Particulate Matter Concentrations and Particle Types near Agricultural Burns Using Electron Microscopy and Passive Samplers. Atmospheric Environment, 54, 260-271.
http://dx.doi.org/10.1016/j.atmosenv.2012.01.067 - 21. Cao, J., Chow, J.C., Lee, F.S. and Watson, J.G. (2013) Evolution of PM2. 5 Measurements and Standards in the US and Future Perspectives for China. Aerosol and Air Quality Research, 13, 1197-1211.
- 22. Si, S., Tao, D. and Geng, B. (2010) Bregman Divergence-Based Regularization for Transfer Subspace Learning. IEEE Transactions on Knowledge and Data Engineering, 22, 929-942.
http://dx.doi.org/10.1109/TKDE.2009.126 - 23. Goldberg, A.B., Zhu, X., Singh, A., Xu, Z. and Nowak, R.D. (2009) Multi-Manifold Semi-Supervised Learning. Proceedings of the 12th International Conference on Artificial Intelligence and Statistics (AISTATS), 169-176.
- 24. Liu, X., Lu, H. and Li, W. (2010) Multi-Manifold Modeling for Head Pose Estimation. 2010 IEEE International Conference on Image Processing, 26-29 September 2010, 3277-3280.
http://dx.doi.org/10.1109/ICIP.2010.5652540

*These authors contributed equally to this work.