Journal of Environmental Protection
Vol.5 No.4(2014), Article ID:44127,17 pages DOI:10.4236/jep.2014.54034
Seasonal and Temporal Variations in Volatile Organic Compounds in Indoor and Outdoor Air in Al-Jahra City, Kuwait
Nabeel M. Al-Khulaifi1, Humood F. Al-Mudhaf2, Raslan Alenezi2, Abdel-Sattar I. Abu-Shady2*, Mustafa I. Selim3
1Department of Environmental Health, College of Health Sciences, Public Authority for Applied Education and Training (PAAET), Adailiyah, Kuwait
2Department of Chemical Engineering Technology, College of Technological Studies, Public Authority for Applied Education and Training (PAAET), Adailiyah, Kuwait
3Department of Pharmacology and Toxicology, Brody School of Medicine, East Carolina University, Greenville, USA
Email: *aasattar44@yahoo.com, ai.abushady@paaet.edu.kw, 19abushady44@gmail.com
Copyright © 2014 by authors and Scientific Research Publishing Inc.
This work is licensed under the Creative Commons Attribution International License (CC BY).
http://creativecommons.org/licenses/by/4.0/


Received 7 December 2013; revised 5 January 2014; accepted 3 February 2014
ABSTRACT
Indoor and outdoor air samples were simultaneously collected from the largest office building in Jahra City during 57 sampling events between August 2010 and November 2011. The collected samples were analyzed for 78 volatile organic compounds (VOCs) using CO2 cryogenic preconcentration and GC/MS analysis. Of the 48 VOCs detected, the toluene concentration exceeded the recommended air quality guidelines in 2% of the outdoor samples, and the benzene concentration exceeded these guidelines in 17.5% and 19.5% of the indoor and outdoor samples, respectively. Industrial and vehicle emissions were negligible. Emissions from oil fields, various crude oil production and flaring activities in the north were major sources of VOCs in the ambient air. The VOC profiles; seasonal, monthly, and weekday/weekend variations; and their effects on ozone formation potentials are discussed. The results indicate that the most abundant class of chemical compounds was oxygenated compounds, of which acetone, acetaldehyde, propanal, methanol, ethanol, and 2-propanol were the most dominant species. Propene and toluene were the most abundant species of aliphatic and aromatic hydrocarbons, respectively.
Keywords:BTEX; Photochemical Reactivity; Weekend Effect; VOC Profiles; Office Buildings

1. Introduction
Air pollution is a major challenge for all countries, particularly the most industrialized countries. Breathing clean, pollution-free air is a prerequisite for good health. However, due to an increase in population and human and industrial activities, air pollution continues to increase. This increase poses a significant health threat worldwide because the dispersion of air pollutants across the planet cannot be prevented. Thus, efforts to study environmental pollution and air pollution in particular have been intensified.
Kuwait is located in the far northwestern corner of the Arabian Gulf. The gulf borders the country to the east, and hot deserts surround it in all other directions. Kuwait is a small country (~18,000 km2) with a total population of 3.824 million as of December 31, 2012 [1] . The population resides in 6% of the area, mostly along the coast. Of the six Governorates of Kuwait, Al-Jahra, which is in the north, is the largest and occupies 62.4% of Kuwait. A sizeable fraction of the total population (12.5%) lives in the residential areas of Al-Jahra city (JA), which encompasses ~0.16% of the governorate desert area. Kuwait ranks fourth in crude oil production (3.0 million barrels per day) [2] .
Recent studies have reported that the ambient air in Kuwait has the highest levels of volatile organic compounds (VOCs) emission of all developed countries [3] . These emission levels are mainly produced by 1) flaring activities and gas and crude oil production facilities which emit 90,000 tons of non-methane VOCs (NMVOCs) into the atmosphere each year [3] ; 2) refineries, petrochemical plants, and other miscellaneous industries located in the south; 3) six fossil fuel dual-purpose power and desalination plants on the Kuwaiti coast; and 4) the traffic and transport sector. These emission sources and possibly some minor ones (fuel evaporation and spills, use and distribution of natural gas, waste disposal areas, wastewater treatment plants, laundry, etc.) greatly contribute to the elevated levels of various VOCs in ambient air, which in turn leads to elevated pollutant levels in indoor air.
VOCs constitute one of the most important major air pollutant groups in the ambient and indoor environment. They play a key role in the photochemical production of secondary air pollutants that harm the environment and impact human health. In addition to outdoor sources, many indoor activities in office buildings (OBs) contribute to air pollutant levels. These indoor sources emit a wide range of pollutants, including VOCs, toxic gases, and airborne dust laden with fungal spores. Exposure to this mixture of pollutants can lead to serious health effects, depending on personal susceptibility and exposure dose. Therefore, the indoor air quality (IAQ) in OBs is critical to the comfort, health, productivity of occupant employees [4] . Although several studies have been conducted to measure indoor/outdoor VOC levels to evaluate indoor environmental quality [4] [5] or assess the air quality in different areas of Kuwait, studies of the emissions of a limited number of VOCs [6] [7] have been limited, particularly those of indoor and outdoor air [8] [9] . None of the very few studies on JA air quality [10] [11] have been addressed about VOCs, although a recent study investigated indoor and outdoor VOCs in OBs in Kuwait [12] . In this study, we analyzed VOCs in indoor and outdoor air samples from the largest OB in JA in order to 1) evaluate their types, levels, and chemical composition; 2) determine their seasonal, monthly, and weekday/weekend variations; 3) identify their major sources whenever possible; and 4) complete existing gaps in the scientific data to assist the development of sound regulatory and environmental health policy decisions by Kuwaiti authorities. In addition, the characterization of pollutants in indoor/outdoor air and identification of their sources will provide insights into strategies for controlling and/or eliminating them.
2. Materials and Methods
2.1. Site Description
JA is an urban residential and commercial area in the northern corner of Kuwait City that is surrounded by crude oil and gas fields, power plants, sewage treatment plants, and major highways (Figure 1). We studied the air in a JA OB that was built in 1983 and renovated in 2005. It is a two-story building with an area of 6250 m2 and is occupied by 248 Jahra Municipality employees. It consists of closed offices with no open areas. The building is served by eight central heating, ventilation, and air-conditioning systems (HVAC) with eight air-handling units (AHU), all of which are located on the roof. The test area consisted of one office (an area of 65 m2) of 12 (an area of 750 m2) on the first floor served by one HVAC and one AHU. The 12 offices are occupied by 51 employees. The OB was selected based on the US-EPA sampling protocol [13] . Smoking is not prohibited, and the windows are kept closed most of the time. No refurbishment or renovation projects were performed during the air-sampling period.
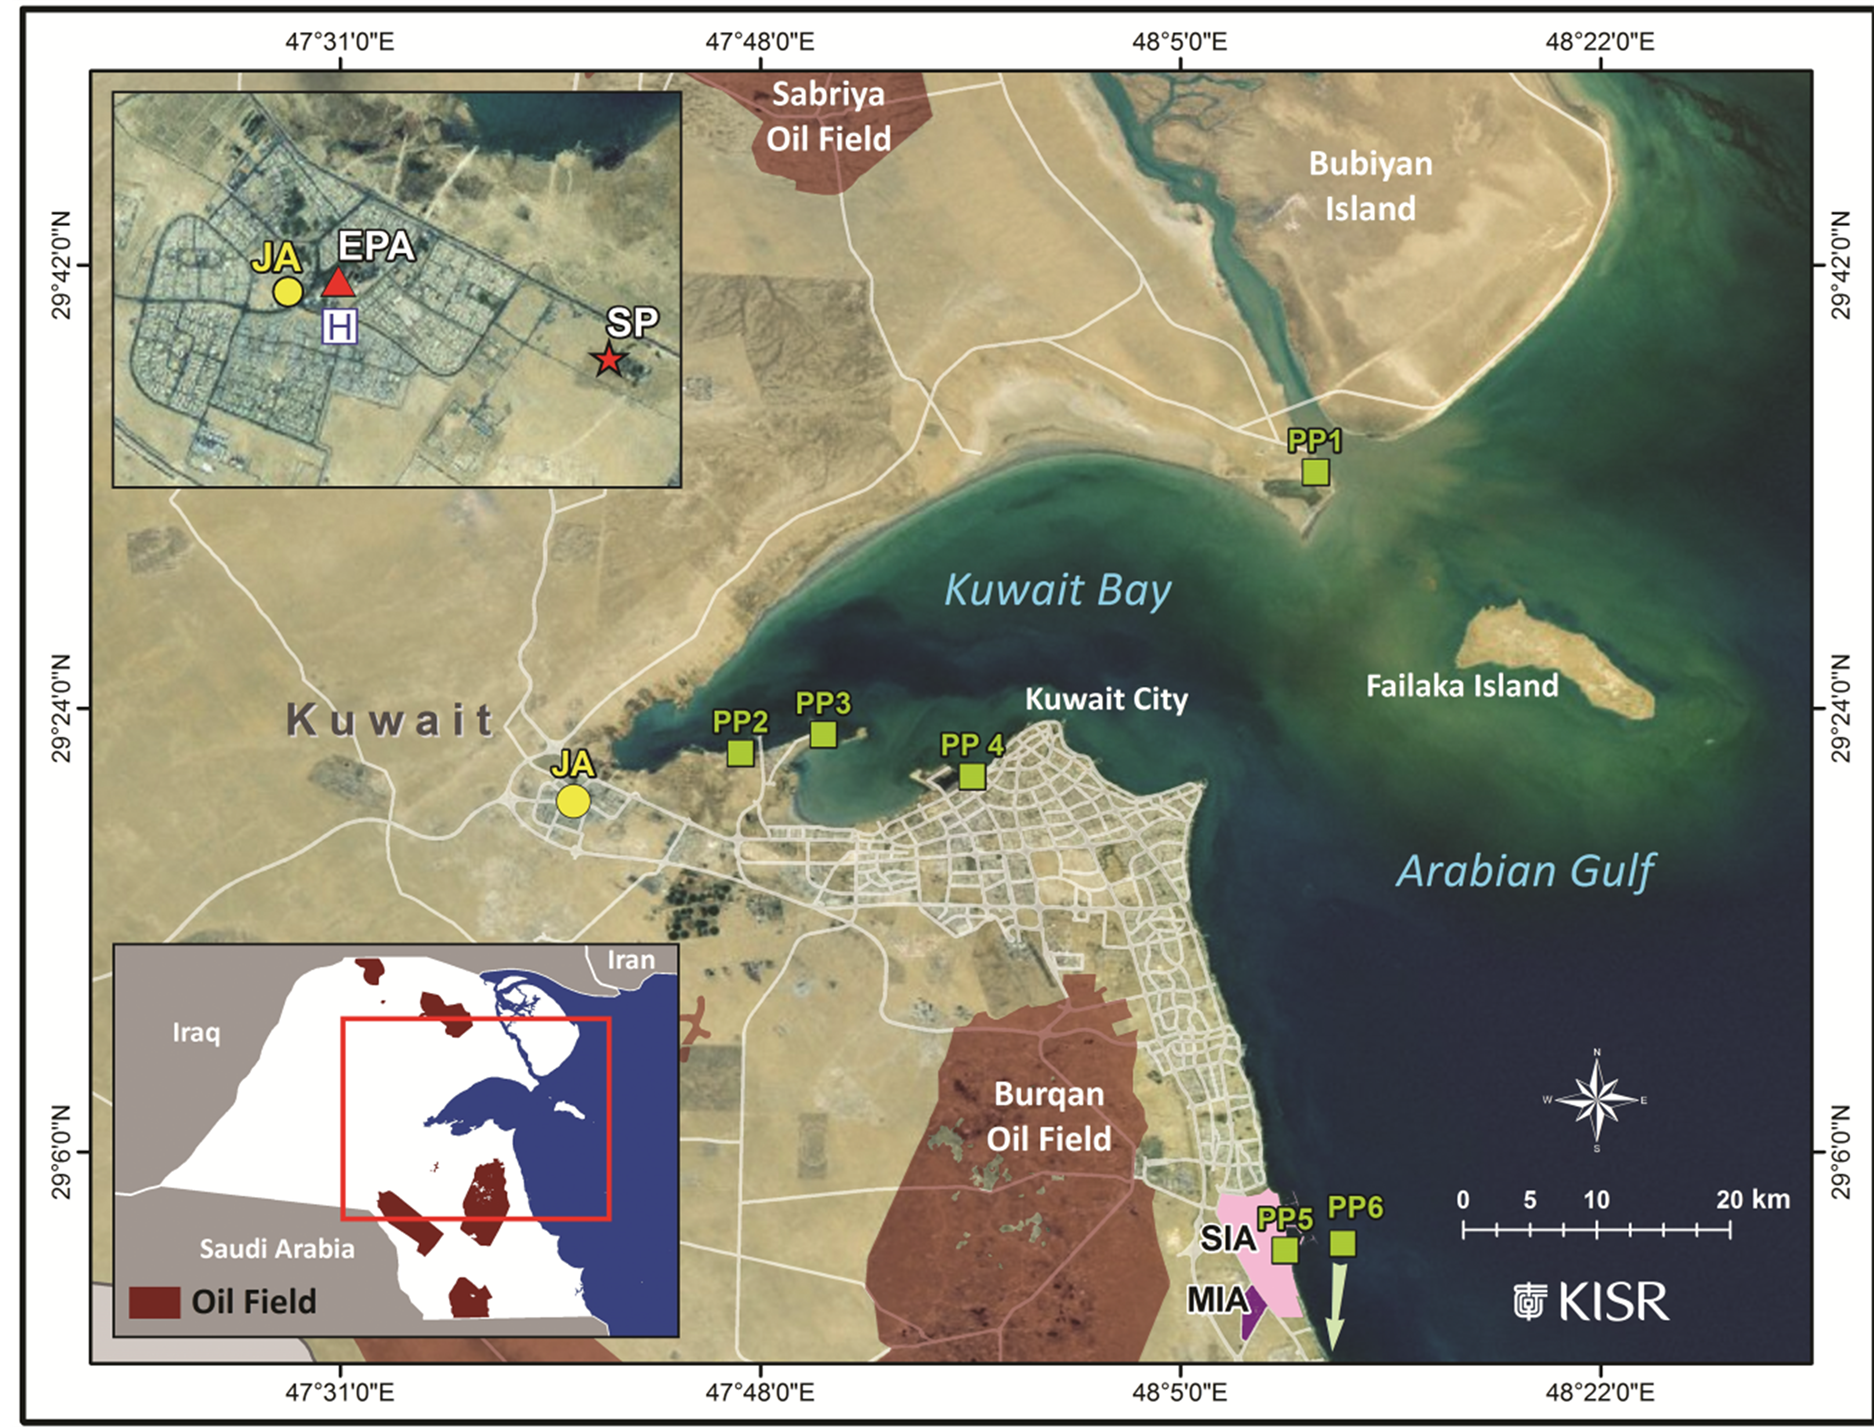
Figure 1. Map of Kuwait showing the Jahra sampling location (yellow circle), KU-EPA monitoring station (EPA, red triangle), main hospital (H), sewage treatment plant (SP, red star), power plants (PP, green squares), oil fields, Shuaiba industrial area (SIA), and miscellaneous industrial activities (MIA).
2.2. Sample Collection and Analytical Procedure
The details of the sampling devices, air sampling, preconcentration of the air samples, analytical procedure for measuring VOC levels in the air, and quality control have been reported elsewhere [12] . A summary is presented below. Briefly, whole air samples were collected passively in time-integrated modes. The field sampling was conducted from August 2010 to November 2011 beginning at 7 AM for either 8-h or 24-h. Two sampling points, indoor (I) and outdoor (O), were defined at the OB. The indoor test area was selected according to the US-EPA sampling protocol [13] . The O samples were simultaneously collected from the roof. The procedures for the air sampling and chemical analyses and the performance criteria for quality assurance (QA) and quality control (QC) were performed according to US-EPA Compendium Method TO-15 [14] . The MDL values of the analyzed VOCs ranged from 0.1 ppbv for mand p-chlorotoluene to 1.4 ppbv for chlorodifluoromethane (CDFM).
The hourly average meteorological parameters and levels of inorganic gases over the same study period were obtained from the database of the Kuwait Environment Public Authority (KU-EPA) air monitoring station located 500 m from the sampling site (Figure 1). An average of the hourly values was used for the 8-h and 24-h sampling events.
3. Results and Discussion
3.1. General Characteristics of VOCs
Air samples were simultaneously collected from the I and O sampling areas of the OB in JA 57 times. The indoor temperature was 22.5˚C - 26.1˚C with a mean of 24.1˚C, and the indoor relative humidity (RH) was in the range of 40% - 58% with a mean of 46%. The outdoor temperature ranged from 10.1˚C to 52.2˚C with a mean of 28.1˚C, and the outdoor RH was between 47.2% and 67.7% with a mean of 49.4% during the sampling events. The air samples were analyzed for 78 VOCs, which were grouped into six chemical classes (CHCs) as follows: six aliphatic hydrocarbons (HCs), 29 halogenated HCs (HHCs), 15 carbonyl compounds (CCs), five alcohols (ALCs), 16 aromatic compounds (ACs) (10 aromatic hydrocarbons (AHCs) and six chlorinated AHCs (CAHCs)), and seven miscellaneous compounds (MCs).
The levels of 48 VOCs were above the MDL. Twelve of these VOCs were detected in <25% of the samples. None of the detected VOCs exceeded the air quality standard exposure limits, with the exception of the AHCs benzene and toluene [15] [16] . According to the air quality guidelines, the maximum exposure limit for benzene is 5 μg·m−3 (1.6 ppbv) [15] . Benzene exceeded this limit in 17.5% and 19.5% of the I and O samples, respectively. The maximum benzene concentrations were 3.4 ppbv in the I samples and 6.2 ppbv in the O samples. Toluene levels (73 ppbv) exceeded the established WHO guideline of 260 μg·m−3 (69.1 ppbv) [16] in 2% of the O samples. Table 1 presents a statistical summary of the most frequently detected VOCs. Abnormally high 1

Table 1. Statistical summary for VOCs in the indoor (I) and outdoor (O) samples (ppbv).
aThe values are given as the mean ± SD (minimum, maximum, % detection). b1,3-butadiene (BD), chlorodifluoromethane (CDFM), dichlorodifluoromethane (DCDFM), chloromethane (CM), trichlorofluoromethane (TCFM), methylene chloride (MC), methyl ethyl ketone (MEK), ethylbenzene (EB), trimethylbenzene (TMB), cyclopentane (CP), cyclohexane (CH), acetonitrile (ACN), methyl tertiary-butyl ether (MTBE).
propanol levels (3.5% detection) were detected by GC/MS in only one sampling event (122 and 486 ppbv in the I and O samples, respectively) and might be attributable to its outdoor emission from temporary casual incidents (episodic) and subsequent dispersion indoors. For these reasons, the 1-propanol data were omitted from all ALC calculations and results are presented below. The mean concentrations of total VOCs (TVOCs) in the I and O samples were 213.6 ± 260.0 and 90.8 ± 90.6 ppbv, respectively. The TVOC concentrations ranged from 29.8 to 1535.2 ppbv for the I samples and from 10.0 to 379.9 ppbv for the O samples. The mean TVOC concentrations were much lower than those reported for I (423.0 ppbv) and O (392.1 ppbv) samples from a mosque located in south Kuwait near the Shuaiba industrial area (SIA) [8] . It was difficult to compare the TVOC concentrations measured in this study with those reported in the literature for other world cities because of differences in the number and types of the measured VOCs, emission sources, meteorological conditions, and sampling site locations.
As shown in Table 1, the mean I/O ratios for individual VOCs ranged from 0.3 for styrene to 20.6 for ethanol. The mean value of the I/O ratios for all the detected VOCs was 1.5 ± 2.9, which decreased to 1.0 ± 0.5 when the ratio for indoor ethanol was omitted. Outdoor VOC levels are generally affected by the type, nature, and proximity of the surrounding emission sources; season; temperature; and wind speed [17] [18] , whereas indoor VOC levels in OBs are affected by the degree of indoor/outdoor air exchange and indoor emission sources, which include building materials, wall paints, carpets, furniture, copiers, printers and other office utilities, cleaning products, solvents, deodorants, fragrances, and tobacco smoking [18] [19] .
The I/O ratio of each VOC indicates its indoor origin/source. A VOC with an I/O ratio of 1.0 ± 0.5 is mainly emitted from an outdoor source, whereas a VOC with a high ratio, usually >5.0, is emitted primarily from indoor sources [20] . Other researchers [21] have reported that I/O ratios between 2.0 and 6.0 indicate a mixture of indoor and outdoor sources. In this study, the I/O ratios (Table 1) indicated that ethanol, CDFM, and, to a lesser extent propene and acrolein, were mainly produced from indoor sources. The extremely high indoor ethanol levels might be due to the Kuwaiti practice of extensively using perfumes, fragrances, and air fresheners as well as other indoor activities. CDFM is one of the main fluids used as an aerosol spray propellant and refrigerant for HVAC systems. Its relatively high I/O ratio can be attributed to leakage from these systems into the indoor air [12] . A small amount of propene and acrolein might have been emitted from several indoor emission sources in the OB [4] . Smoking indoors might have contributed to the indoor benzene levels. The source of all other indoor VOCs with I/O ratios ≤1.0 was the ambient air [19] . Many studies have reported higher indoor VOC levels than those outdoor [4] [5] , which have been attributed to the dominance of indoor sources.
The VOC concentrations reported in this study are compared to those reported in the literature in Table 2. This comparison is limited to a few VOC species due to the lack of data for some of the species detected in this study. The indoor VOC concentrations in this study were significantly lower than those measured in other countries, with the exception of ethanol. These large differences were mainly attributed to the building characteristics, occupant densities, and human-related activities [5] . By contrast, the outdoor VOC concentrations measured in this study were higher than those measured in other world cities, consistent with previous reports on Kuwaiti ambient air [3] . Kuwait is a major crude oil producer, and its various production and flaring activities lead to high VOC emissions.
3.2. BTEX and Interspecies Ratios
Benzene (B), toluene (T), ethylbenzene (E), and xylenes (X) (collectively referred to as BTEX) are often used as an AHC target group in environmental studies. BTEX represent a very important group of air pollutants in urban settings because of their human health effects and role in atmospheric chemistry. Many studies have confirmed that vehicle emissions in urban areas are the major source of BTEX, and BTEX concentrations are thus an effective indicator of air pollution due to these emissions. In Hong Kong, 60% of TVOCs in the atmosphere are BTEX, which are mainly produced from vehicle emissions [24] . By contrast, only 14% of TVOCs in the outdoor air were BTEX in this study, and the outdoor BTEX were the main source of indoor BTEX (mean I/O ratio of 0.6 (Table 1)). T was the most abundant BTEX species in the O samples (51% of BTEX), consistent with the results of other studies [24] -[26] . Many researchers have reported good correlations between BTEX inter-species, which are used extensively as indicators of vehicular or non-vehicular VOC emissions [25] [27] -[29] . In urban areas, ratios of T/B less than 2.0 are considered an indication of the strong influence of mobile source emissions [26] [29] (ratios between 1.5 and 4.0 have also been suggested to indicate high vehicle emissions
Table 2. Mean concentrations of the VOC species (ppbv) reported for indoor air in office buildings and for ambient air in urban areasa.
aNot reported (NR). b1,3-butadiene (BD), dichlorodifluoromethane (DCDFM), methylene chloride (MC), ethylbenzene (EB), trimethylbenzene (TMB).
[27] ), whereas T/B ratios greater than 2 are considered an indication of non-vehicular emission sources [26] [29] . The ratio of (m, p)-Xs to E (X/E) has been identified as a photochemical age indicator [30] . A literature survey revealed that T/B ratios were 2.5 in Delhi, India [25] ; 4.3 in Ankara, Turkey [26] ; 1.2 in Hong Kong and 4.04 in Sydney, Australia [27] ; 2.0 in Izmir, Turkey [29] ; and 2.2 to 4.3 in Windsor, Canada [31] . These studies all reported that vehicle emissions were the major contributor of VOCs to the ambient air. By contrast, higher T/B ratios of 7.19, 7.74, and 10.22 were reported for Osaka, Japan; Hong Kong; and Bangkok, Thailand, respectively [25] , and were attributed to large industrial emissions and/or toluene-rich fuels. In general, the differences in the (T/B) ratios for these cities might be due to differences in their industrial activities, fuel composition, vehicle types, and other specific sources of VOC emissions. In the present study, the low percent of BTEX in the ambient air and large mean T/B ratio for all O samples (7.1) indicate that vehicle emissions contribute little to the TVOC levels in the ambient air in JA. The primary reasons for this result are 1) the relatively low population density; b) the absence of traffic congestion; c) residential buildings, mainly one or two-story private homes, cover a large area of JA; and d) data on the chemical composition of fuel in Kuwait needed to evaluate the extent of vehicle emissions are lacking. This finding also suggests an absence of evaporative emissions (no fuelfilling gas stations or workshops in the vicinity) and industrial emissions from either the southeastern sewage treatment plant or the refineries, petrochemical plants, and other industries in the upwind SIA and MIA (Figure 1). For these reasons, we can confidently conclude that emissions from flaring and crude oil production activities in the downwind northern oil fields (approximately 50 km north of JA) were the major contributors to the TVOCs in the JA atmosphere. These emissions were transported by winds that blew from the north/northwestern direction at an average speed of 4.1 m/s more than 70% of the year (as calculated from KU-EPA data), consistent with other reports in the literature [8] [11] .
The X/E ratio is used to evaluate VOC transfer from highly polluted sites and to determine their lifetime in the atmosphere [29] [30] . The degradation rate of (m, p)-Xs in the atmosphere is much faster than that of E; the (m, p)-X and E atmospheric lifetimes are 3 and 8 h, respectively. This difference in reactivity means that as polluted air travels, the (m, p)-X levels decrease more rapidly than the E levels, and consequently, the decrease in the X/E ratio is dependent on the distance from the source. Regardless of the geographic location, a ratio of 3.6 was reported for vehicle emissions [30] . In this study, the average X/E ratio of 4.5 in the O samples is consistent with the values of 4.5, 4.4, and 4.3 reported for Athens, Greece [32] ; Los Angles, USA [33] ; and Haifa, Israel [34] , respectively. The high X/E ratios were attributed to evaporative emissions from liquid gasoline fuels. The X/E ratios in this study support the conclusion that emissions from flaring and crude oil production activities were the major contributors of VOCs to the ambient air in JA, whereas the source of indoor VOCs (X/E ratio of 3.3) was outdoor air that aged in the indoor environment.
The only previous study of BTEX species in Kuwait was performed in residential houses [9] . The reported ranges of B, T, E, and Xs were 0.5 - 11.7 ppbv, 1.0 - 49.7 ppbv, 1.0 - 25.7 ppbv, and 0.1 - 61.9 ppbv, respectively, in indoor air and 0.4 - 5.8 ppbv, 1.9 - 30.4 ppbv, 0.5 - 17.4 ppbv, and 0.1 - 72.2 ppbv, respectively, in outdoor air. These ranges are very high (with the exception of the values of B and T in the O samples) compared to the values reported in Table 1 due to differences in the locations and their associated activities. None of the correlations between the BTEX species were discussed in the previous work.
3.3. Chemical Composition of VOCs
The VOC profiles for the I and O samples indicate that of the six CHCs, ALCs constituted the largest fraction of TVOCs (60% of the I samples and 33% of the O samples), followed by CCs, which accounted for 17% and 29% of TVOCs in the I and O samples, respectively. For the O samples, the abundances of the other CHCs were in decreasing order: ACs (15.0%) > HCs (9.9%) > HHCs (9.6%) > MCs (4.3%) > CAHCs (0.1%). They decreased in the following order in the I samples: HCs (8.4%) > HHCs (6.4%) > ACs (6.2%) > MCs (2%) > CAHCs (0.1%). These profiles differ from those reported by Al-Dabbous et al. [8] . They found that HHCs were the most dominant species, accounting for 54% of the I samples and 63% of the O samples, followed by the oxygenated compounds, which accounted for 32% and 16% of the I and O samples, respectively, in the Fahaheel area of Kuwait. Alkanes were the most abundant compounds in urban ambient air in Beijing, China (55%) [35] ; Mexico City (52%) [36] ; Tehran, Iran [37] ; Houston, USA [38] ; Seoul, Korea (53%); Nagoya, Japan (58%); London, UK (50%); Lille, France; and Dallas, USA [23] . By contrast, ACs were the most abundant species in the air in Nisyros Island, Greece (74% - 84%) [39] and Bursa, Turkey (77% - 83%) [40] . These variations indicate that the dominant CHC is entirely dependent on the types and nature of the sampling location and surrounding emission sources. In this study, the indoor ethanol emissions resulted in a significant increase in ALCs in the I samples, whereas the direct exposure of the ambient air to sunlight (high temperatures characterize the Kuwait climate) greatly contributed to the considerable formation of outdoor oxygenated hydrocarbons (62%) via the photooxidation of HCs (from flaring and other crude oil activities). The low percent of ACs in the O samples also supports the conclusion that the contribution of vehicle emissions to the ambient air in JA was low. Internationally, the most dominant VOCs in indoor air in OBs are toluene and limonene in Bangkok, Thailand [4] ; methylcyclopentane, n-hexane, toluene, limonene, n-heptane, and 3-methylpentane in European countries; and benzene, toluene, m/p-xylene, naphthalene, and limonene in Singapore [5] . These differences in dominant VOCs between countries might be due to socioeconomic factors (e.g., building characteristics), culture (e.g., occupant behavior), climate, and indoor activities.
3.4. Seasonal and Monthly Trends of VOCs
Identifying the seasonal patterns of VOCs is critical to understanding their chemical and transport processes in the atmosphere. In this study, summer (SU) was defined as the three-month period from July to September, autumn (AU) included October through December, winter (WI) included January through March, and spring (SP) was from April to June. The indoor temperature was found to range from 22.5˚C to 26.1˚C over the entire study period, while the average seasonal temperatures of the ambient air were 42.3˚C, 23.1˚C, 17.1˚C, and 34.5˚C in SU, AU, WI, and SP, respectively. The outdoor temperature ranges in SU, AU, WI, and SP were 38.5 - 52.2, 11.7 - 41.0, 10.1 - 21.5, and 24.8˚C - 45.3˚C, respectively. Figure 2(a) shows that for both the I and O samples, the highest and lowest mean TVOC levels were recorded for AU and WI, respectively. The levels in the I samples were higher than those in the O samples for all seasons. The highest I/O ratio, 3.9, was observed during WI, while the lowest I/O ratio, 1.7, was measured during SP. These variations might be explained by changes in indoor emissions due to seasonal variations in indoor activities and differences in outdoor VOC levels. These differences might also be related to the degree of I/O air exchange through windows, which were mostly closed in WI and frequently opened in SP. During summer, most expatriates, who represent 69% of the population [1] , leave for their home countries, and many Kuwaiti employees travelled for tourism, resulting in a decrease in indoor activities, and their return by September/October might have also contributed to the seasonal variation in VOCs in indoors. By contrast, other studies have reported high VOC levels in the ambient air in WI and low VOC levels in SU [17] [23] [27] [40] , which were attributed to one or more of the following: 1) higher precipitation frequency and intensity in SU than in WI; 2) lower traffic densities in SU; 3) higher atmospheric stability in WI; and 4) increased solar radiation in SU. Other studies have reported high VOC levels in SU and low VOC levels in WI [29] , and Zhang et al. [41] reported high VOC levels in SP and low VOC levels in AU. These findings can be explained by variations in the meteorological conditions, emission intensities from nearby sources, and photochemical activity [42] . The photochemical reactions between VOCs and OH radicals occur more rapidly during hot seasons than cold ones because of the high OH radical levels, high temperature, and enhanced solar flux during warmer seasons [27] [42] . The efficiency of these reactions in reducing VOC levels depends on their profiles in the ambient air. In addition, variations in vertical and horizontal atmospheric ventilation, which depend mainly on the mixing height and wind speed parameters, play an important role in the seasonal variations in VOC levels [43] . To our knowledge, no studies have addressed the seasonal variations in indoor air.
The TVOC profile for the I samples demonstrated that only ALCs exhibited significant seasonal variations, with the highest and lowest levels in AU (203 ppbv) and SP (95 ppbv), respectively (Figure 2(b)). The seasonal variations in other CHCs were negligible. By contrast, ACs, ALCs, and CCs exhibited significant seasonal variations in the O samples (Figure 2(c)). CCs exhibited the highest levels in SU and lowest levels in WI, whereas the ALC levels were highest in AU and lowest in WI. More specifically, the seasonal variation profiles of the various CHCs (Figure 2(d)) demonstrate that for the I samples, ALCs made the greatest contribution to TVOCs in all seasons and only ranged from 62% in SU to 65% in WI. CCs accounted for a significant portion of TVOCs (from 14% in AU to 19% in SP), while ACs contributed modestly to TVOC levels (from 3% in SU to 8% in WI). The O samples exhibited a different VOC profile; CCs were the largest contributor in SU (64%) and the
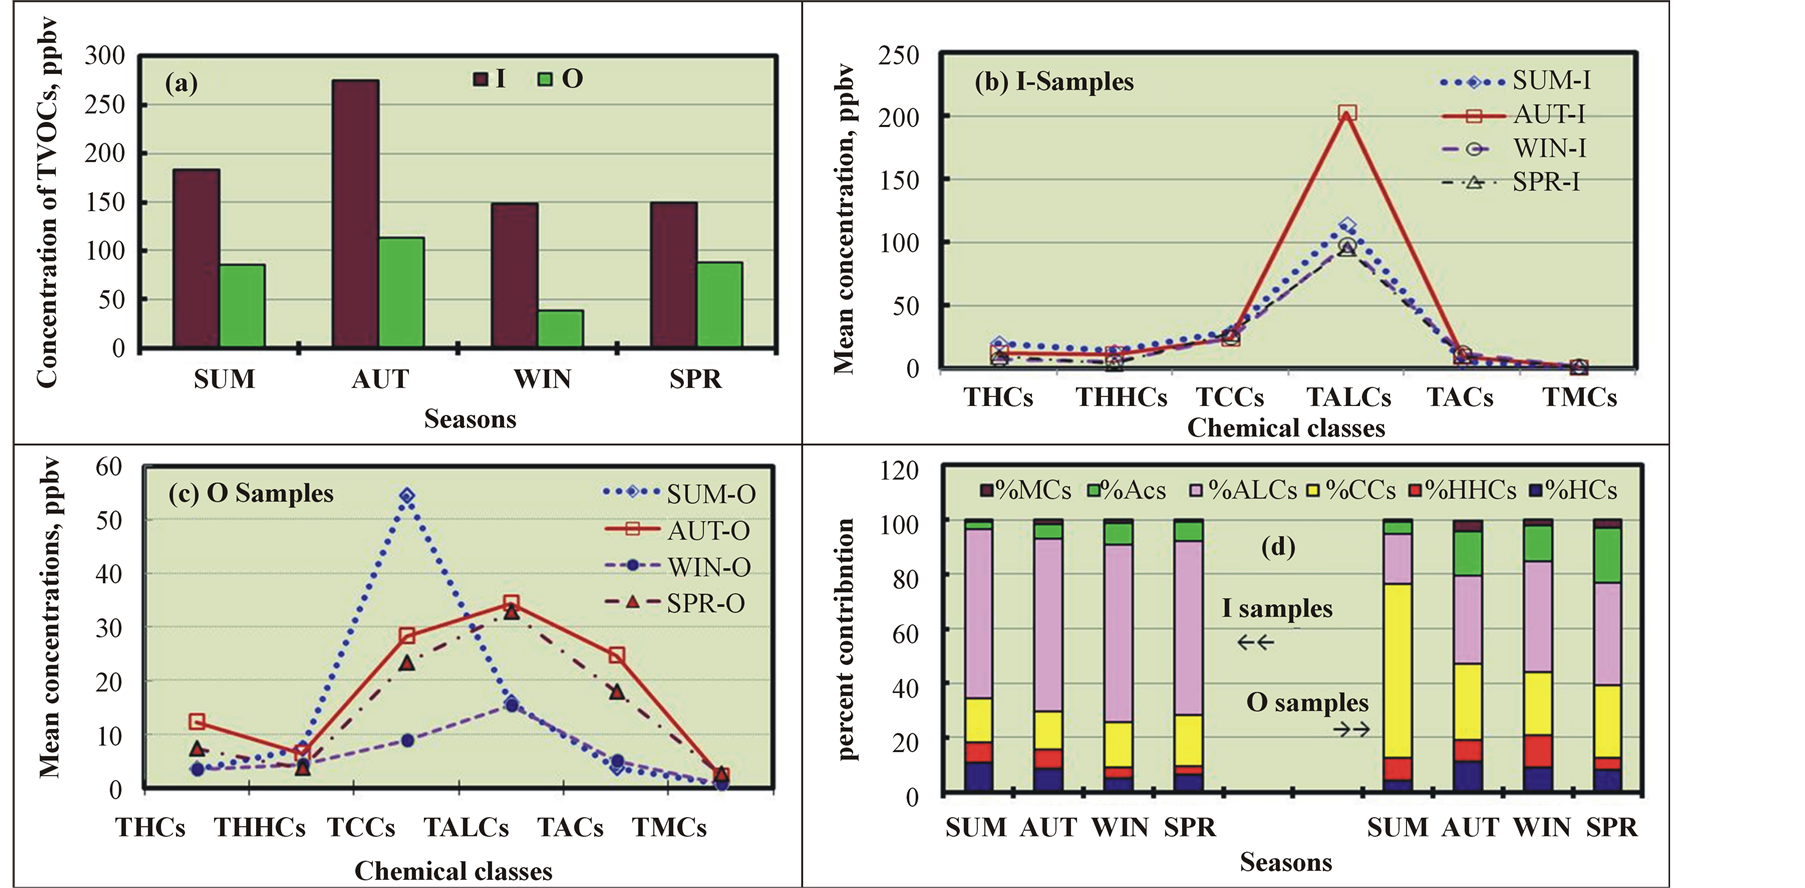
Figure 2. Seasonal variations in the TVOC levels in the indoor (I) and outdoor (O) samples.
second largest contributor in all other seasons, while ALCs accounted for the largest portion of TVOCs in AU (32%), WI (41%), and SP (37%) and the second largest in SU (18%). The contributions of the other classes from largest to smallest were ACs, HCs, HHCs, and MCs. As reported in other studies [44] [45] , the dominance of CCs in SU is due to the high efficiency of the photochemical oxidation of hydrocarbons assisted by higher solar energy. No other studies have addressed seasonal variations in the VOC profile.
The seasonal variations in the most dominant VOCs of the different CHCs are shown in Figure 3. For ALCs in the I samples, the ethanol levels were very high (from 65% in WI and SP to 83% in AU), while the methanol levels were very low (from 12% in AU to 28% in WI and SP) (Figure 3(a)). By contrast, ethanol was detected in the smallest amounts (from 11% in WI to 22% in AU), and methanol was found to be the predominant ALC (from 45% in SP to 71% in SU) in the O samples (Figure 3(b)). Acetone was the most dominant VOC of the CCs and exhibited negligible seasonal variations (41% in AU to 45% in SP) in the I samples (Figure 3(a)). However, the acetone levels varied considerably from 39% in SP to 72% in SU in the O samples (Figure 3(b)). Of the HHCs, CDFM was the most dominant species. In the I samples, the highest levels of CDFM were observed in SU and AU (73%), and the lowest levels were detected in WI (29%). By contrast, the CDFM levels were lowest in SU (21%) and highest in WI (67%) in the O samples. For the HCs, ACs, and MCs, the most dominant VOCs were propene, toluene, and acetonitrile, respectively.
The high indoor ALC levels can be attributed to the dispersion of methanol from outdoor air and to indoor ethanol emissions from the extensive use of perfumes, which varied seasonally based on the number of employees away on annual vacations and the amount of perfume used. The high levels of CDFM compared to those of other HHCs in the I samples resulted from HVAC leakage at the roof (where the O samples were taken), which was dispersed into the indoor and ambient air. The increases in the outdoor levels of both ALCs and CCs in SU were previously attributed to the photochemical reactions of hydrocarbons. Toluene is an important gasoline additive and industrial solvent and has been reported to be the dominant VOC in urban areas [27] [46] .
The monthly variations in the TVOC levels were significant for the I samples (ranging from 91 ppbv in August 2011 to 598 ppbv in October 2010) and O samples (ranging from 34 ppbv in October 2011 to 311 ppbv in September 2010). The TVOC levels were higher in the I samples than the O samples. The I/O ratio ranged from 1.0 in August 2011 to 8.0 in February 2011, except when the I/O ratios fell below 1.0 in September 2010 (0.4) and November 2010 (0.8) (Figure 4(a)). These low I/O ratios were attributed to high levels of acetone in September and of methanol, acetone, and toluene in November 2010 in the O samples compared to the I samples. The significant increase in the TVOC levels in the I samples in October 2010 was attributed to high indoor ethanol emissions (70%), which might have been related to the increase in the indoor activities of the employees. No specific trend was observed in the monthly or yearly TVOC variations. These variations depended on the extent of indoor activities and other previously mentioned factors.
The monthly variations in the VOC profiles indicate that ALCs were the most dominant species in the I samples for all months (from 44% in November 2010 to 81% in October 2010), in agreement with our earlier results. CCs were the second highest contributor to indoor VOC levels (from 9% in October 2010 to 27% in November 2010), and three different classes, HCs (nine months), AHCs (four months), and HHCs (three months), com-
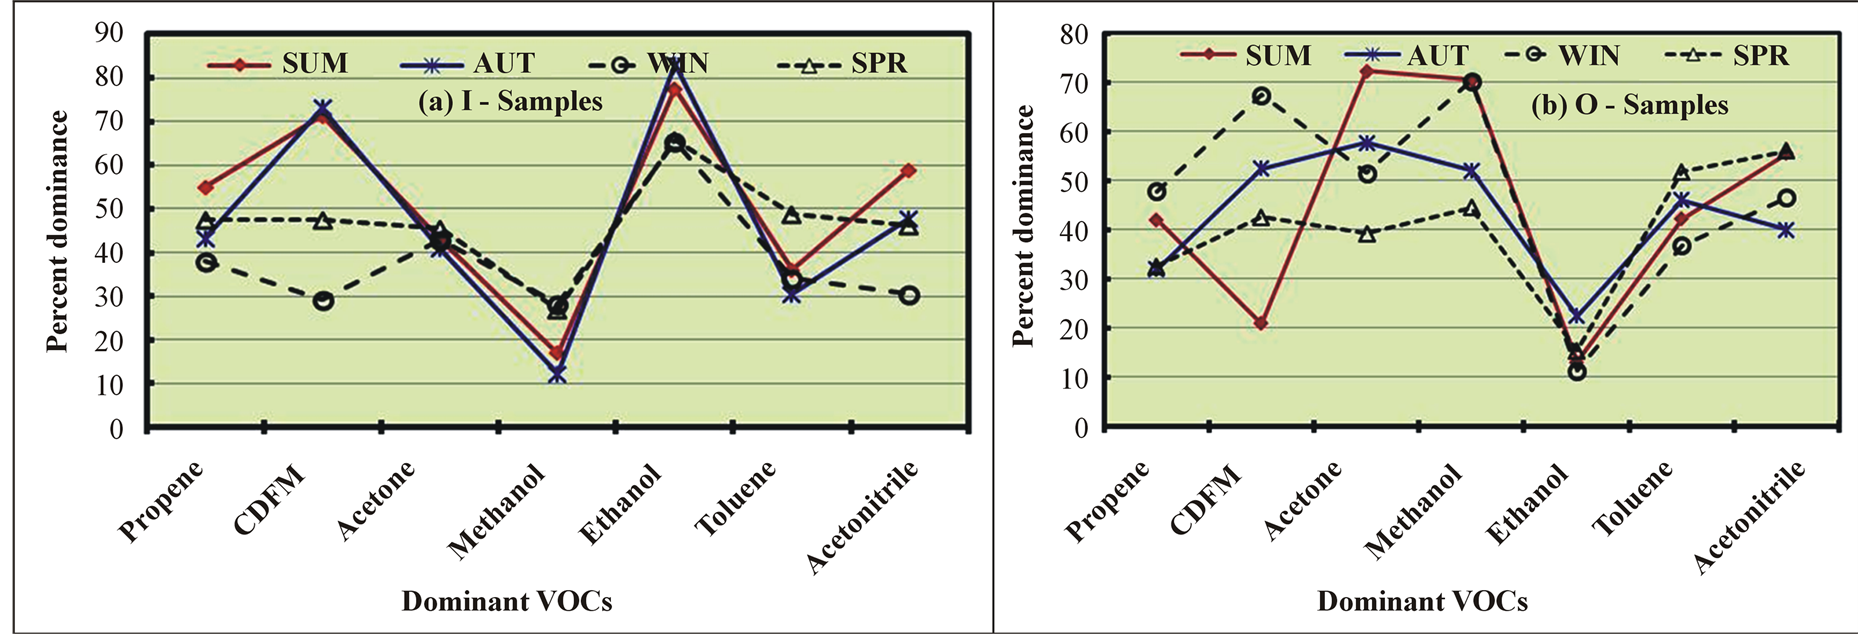
Figure 3. Seasonal variations in the most dominant VOCs of the various chemical classes in the indoor (I) and outdoor (O) samples.
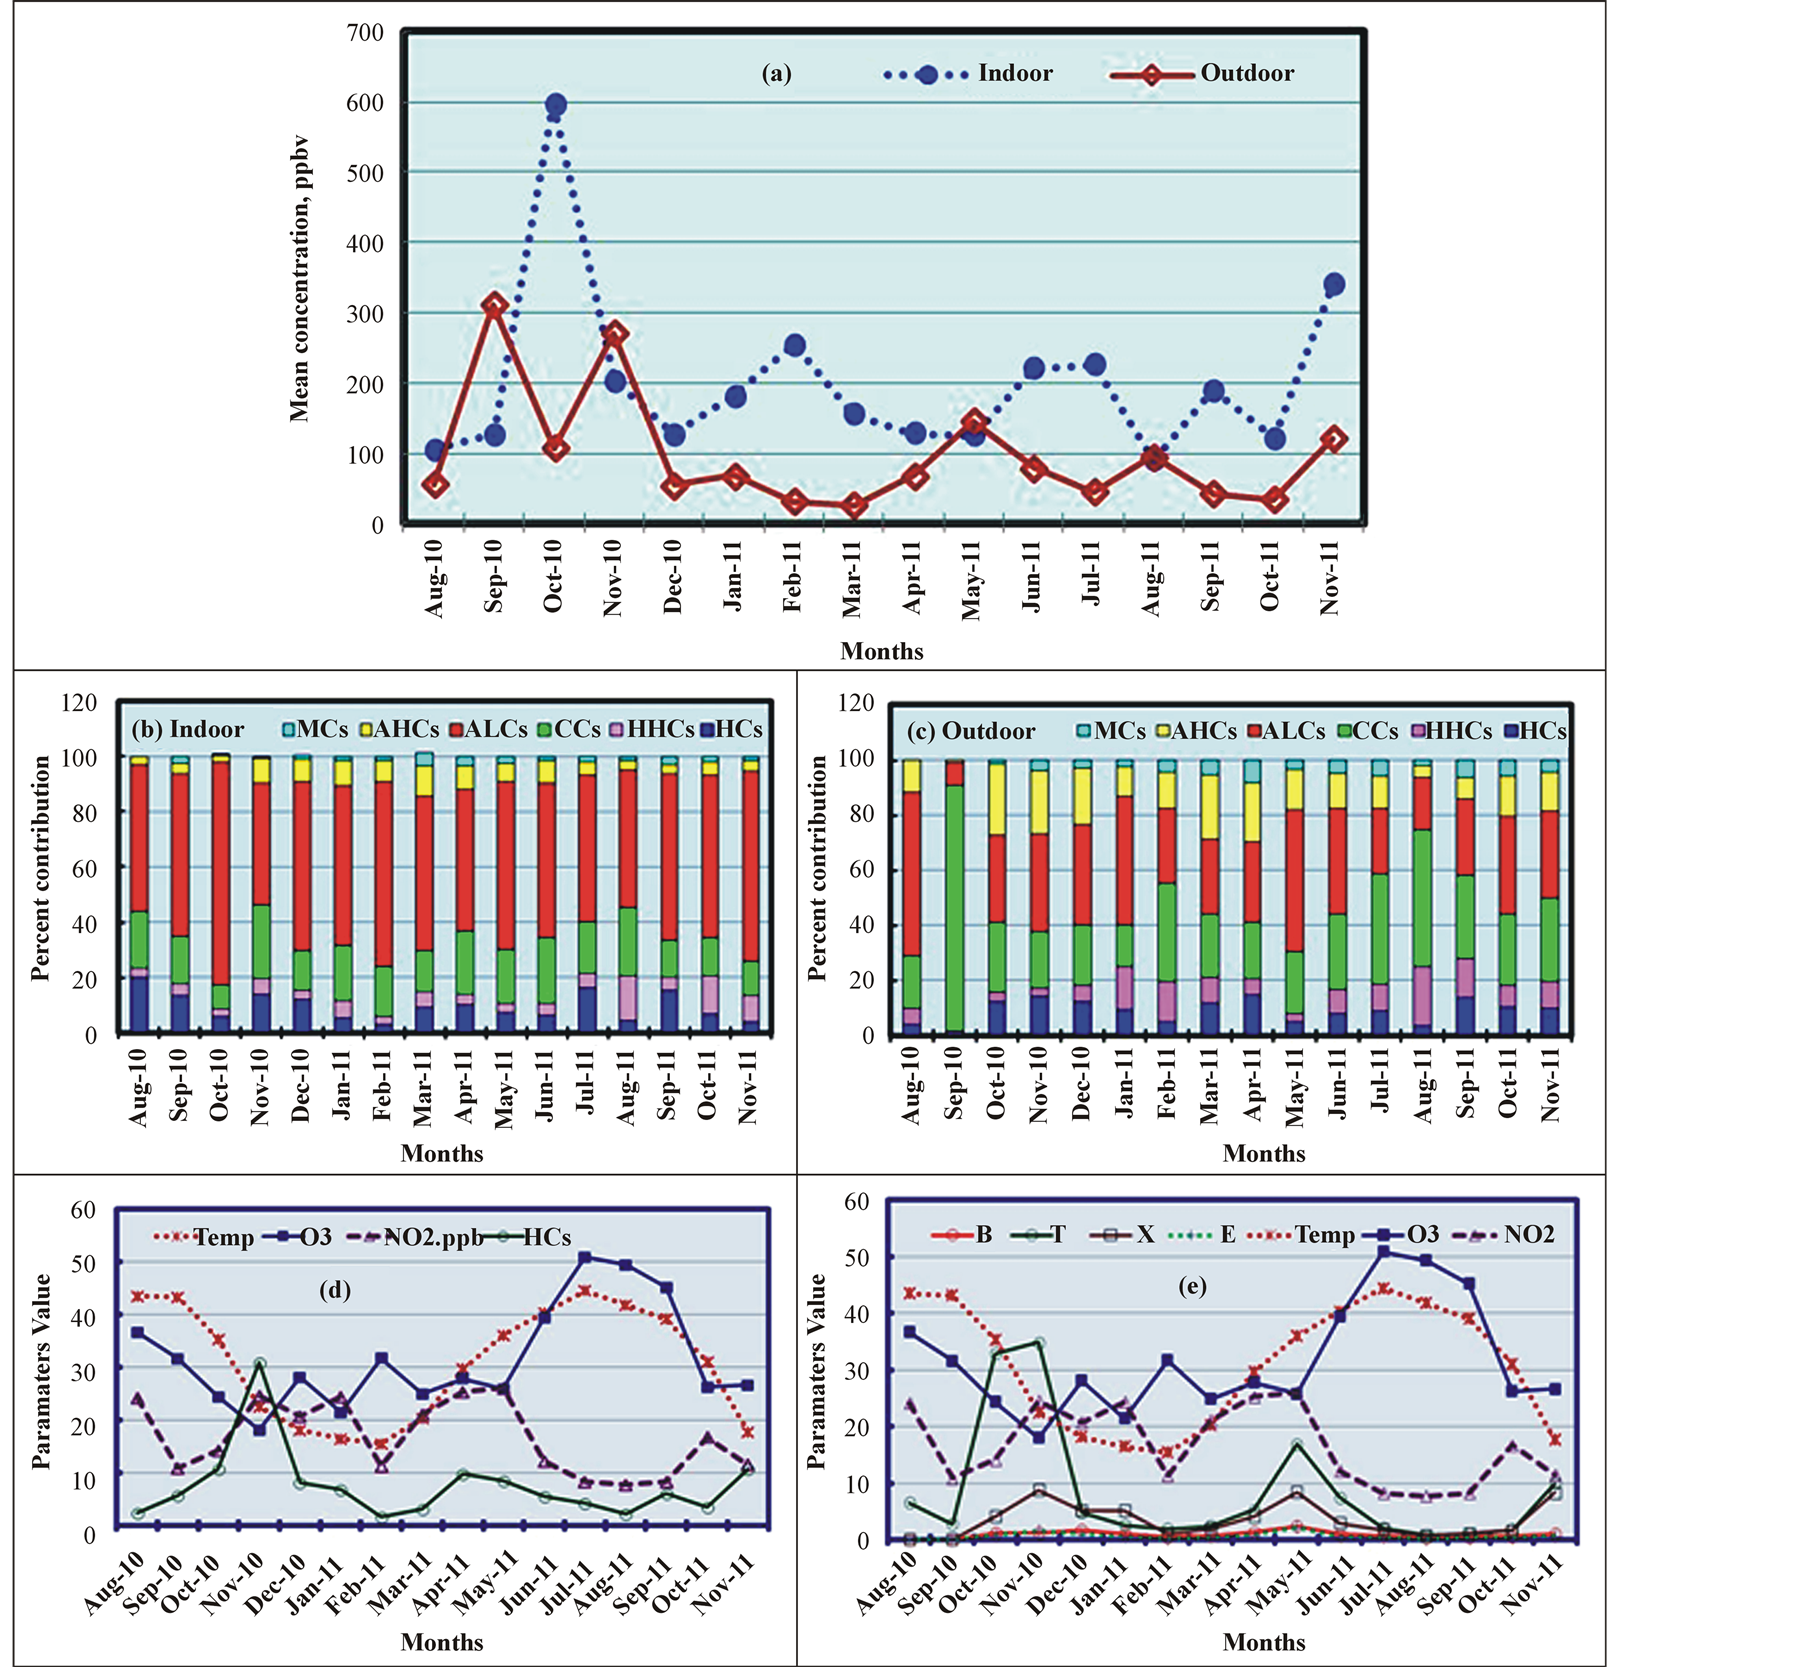
Figure 4. Monthly variations in the TVOC levels and other parameters in the indoor (I) and outdoor (O) samples.
prised the third largest contribution in different months (Figure 4(b)). For the O samples, ALCs (11 months, from 8% to 59%) and CCs (five months, from 15% to 89%) were the dominant species at different points in the year. The second and third largest contributions were mostly due to CCs and ACs (from 1% to 26%), while the fourth and fifth largest contributions were alternately due to HCs (from 2% to 15%) and HHCs (from 3% to 22%), as shown in Figure 4(c). The effects of atmospheric reactions involving highly photochemically reactive VOCs to produce ozone might explain the monthly variations in the TVOC levels. VOCs (mainly HCs and BTEX) are known to be ozone precursors, and therefore decreases in their concentrations should indicate increases in ozone formation, which also depends on the temperature and NO2 levels. The increase in ozone levels during the SU months (July, August, and September) reported in several studies [43] [47] [48] was found to correlate with the increase in the temperature and decrease in HC (Figure 4(d)), BTEX (Figure 4(e)), and NO2 levels. Conversely, the increased levels of HCs, BTEX, and NO2 in November 2010 were associated with a decrease in the temperature and ozone levels. In addition, the monthly T and X levels varied more than the B and E levels (Figure 4(e)), consistent with the work of Vardoulakis et al. [48] .
3.5. Weekday/Weekend Variation Patterns
Many studies have reported that atmospheric emissions of VOCs and other pollutants are higher on weekdays (WDs) than weekends (WEs) [29] [49] . The temporal variations in the TVOC and CHC levels in the I and O samples over 8 h and 24 h on WDs and WEs are given in Table 3. The TVOC levels in the I and O samples were higher during the 8-h sampling than the 24-h sampling on WDs. By contrast, the TVOC levels were lower during the 8-h sampling than the 24-h sampling on WEs. In addition, the I/O ratios on both WDs and WEs were higher when the sampling was performed for 8 h (2.6 for WDs and 2.0 for WEs) than when it was conducted over 24 h (2.1 for WDs and 0.8 for WEs). The following ratios of the TVOC levels, WDs-8 h/WDs-24 h, WDs-8 h/WEs-8 h, and WDs-24 h/WEs-24 h, were calculated and found to be higher for the I samples (1.4, 2.7, and 1.2, respectively) than for the O samples (1.1, 2.1, and 0.4, respectively). These findings are consistent with those of other studies [29] [49] and strongly indicate that the indoor and outdoor emissions were high during working hours in the morning on WDs (due to increased activities) and low in the morning and high in the afternoon and evening on WEs (when activities increased). These conclusions are confirmed by the temporal variations in the VOC profile (Table 3), in which ALCs were the most dominant CHC due to high indoor ethanol emissions. In addition, the BTEX levels and %BTEX/TVOC values were higher for the O samples than for the I samples (with a few exceptions on WEs), suggesting that flaring from the nearby upwind oil fields in the north had a significant impact on the VOC levels.
The outdoor WD/WE ratios of the dominant VOCs ranged from 0.9 for propanal to 3.5 for toluene during the 8-h sampling and from 0.2 for o-, m-xylenes to 1.4 for TMB during the 24-h sampling. Higher ratios were observed during the 8-h sampling than during the 24-h sampling (Table 4). Consistent with the conclusion of Shan et al. [50] , the 8-h WD/WE ratios for the B, X, E, and TMB traffic markers were mostly between 1.5 and 2.0 due to high vehicle usage during the WDs. In addition, the 8-h WD/WE ratios for the oxygenated hydrocarbons were >1.0 (range 1.3 - 2.5) due to the high activity of photochemical reactions during WDs. Toluene is a known solvent marker, and variations in its WD/WE ratios depend on the strengths of its evaporative sources [51] . The inorganic species exhibited comparable WD/WE ratios of approximately 1.0, and no significant difference between the 8-h and 24-h values was observed, which indicates that their emission sources and emission strengths did not vary considerably.
The variations in the WD/WE ratios demonstrate the weekend impact. The weekend effect is explained by the effect of VOCs on O3 formation and the decrease in NOx emissions over the weekend. In addition, low levels of particulate matter (PM) on WEs enhance O3 formation by minimizing sunlight scattering [40] . During the study period, the average PM10 levels on WDs and WEs were 149 and 32 µg·m−3, respectively, for the 8-h sampling and 129 and 72 µg·m−3, respectively, for the 24-h sampling. These values indicate significant scattering of sun
Table 3. Temporal variations in the TVOC concentration, chemical classes, and BTEX and its inter-species.
*WD = weekdays (Sunday to Thursday); WE = weekends (Friday and Saturday).
Table 4. Weekday/weekend ratios of the dominant outdoor VOC species and inorganic pollutants.
light (low O3 formation) on WDs and in the mornings. In addition to O3 formation, the photochemical oxidation of VOCs produces intermediate compounds and/or CO and CO2 through chain reactions with OH radicals [43] . These photochemical reactions include reactions with nitrate radicals and O3 during the night [52] . Therefore, these reactions affect the temporal variability in the VOC levels and play a role in controlling O3 formation [53] .
3.6. Ozone Formation Potential
The impacts of VOC emissions on ozone formation must be understood to develop strategies for controlling air pollution. The reactions of VOCs with OH radicals in the troposphere initiate the photochemical formation of ozone to widely varying degrees. These reactions depend on the ozone formation potential (OFP), which is used to compare the reactivities of different VOCs for photochemical ozone formation. The maximum increment reactivity (MIR) values [54] (defined as the maximum amount of ozone that can be produced in the atmosphere per unit weight of the VOC species) were used to calculate the OFPs of different VOC species using the equation OFPi = Ci x Mi (where OFPi is the OFP of VOC species i; Ci is the concentration of species i; and Mi is the MIR coefficient of species i). The OFP calculations were limited to the VOC data from the O samples in this study (HHCs have no MIR values) because the outdoor VOCs were exposed to direct sunlight, which initiates the photochemical reaction. Of the detected VOC classes, ALCs made the largest contribution to the TVOC concentration, followed by CCs, ACs, HCs, and MCs. However, ozone production is not only proportional to the VOC concentrations but also to their MIR values, which are a measure of their reactivities with OH radicals. As a result, the VOC products and their reaction rates (depend on their MIR values) determine the rate of ozone production (OP). By considering these reactivities for all the results, we found that CCs played the dominant role in OP (33%), followed by ACs (30%) and HCs (26%, of which alkenes contributed 25%). ALCs (OP of 10%) played a minor role in the total OP (TOP), although it was the most prevalent VOC (34% of TVOCs). The top 10 VOCs that contributed more than 80% of the TOP were propene (13%), xylenes (12%), propanal (12%), toluene (11%), acetaldehyde (11%), isoprene (6%), methanol (4%), isobutene (3%), acetone (3%), and 1,3-butadiene (3%). Of BTEX, xylene was the most dominant contributor to TOP, followed by toluene, which is consistent with the results of other studies [25] [55] .
TOP varied seasonally (Figure 5(a)) and decreased in the same order as the TVOC levels in the O samples (Figure 2(a)): AU > SP > SU > WI. TOP increased by 226%, 104%, and 30% in AU relative WI, SU, and SP, respectively. In contrast to the seasonal CHC profile shown in Figure 2(c), in which ALCs were the most dominant species in all seasons (except SU), we found that the ALC contribution to TOP was very low in all four seasons (but higher than MCs) (Figure 5(b)). In addition, the variations in the seasonal contribution patterns of other CHCs to TOP differed from those to the TVOC level (Figure 2(c)). CCs were the most dominant contributors to TOP in SU, and ACs contributed the most in other seasons, except in WI, when CCs and HCs accounted for an equal amount of TOP. CCs were the second largest contributors in SP and third largest in AU, while HCs were the second largest contributors in AU. CCs contributed the most to the TVOC levels after
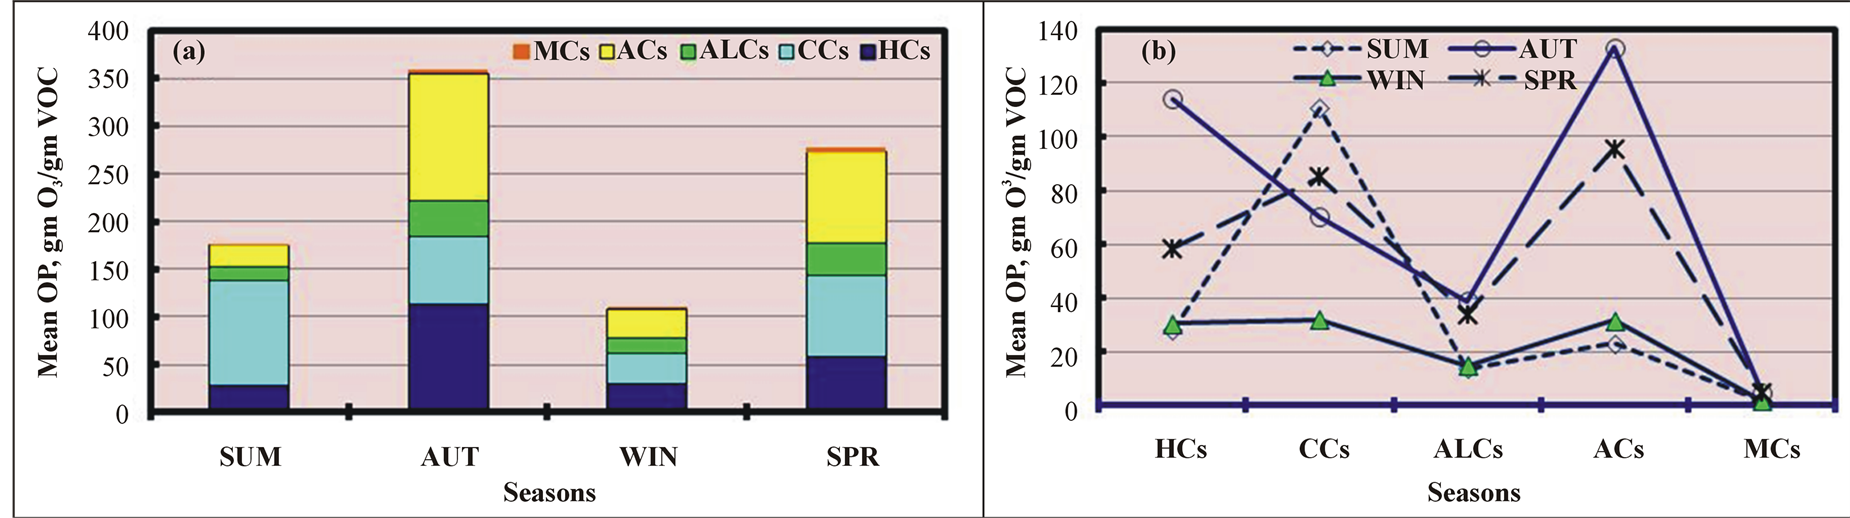
Figure 5. Seasonal variations in the mean ozone production (OP) of various chemical classes in ambient air.
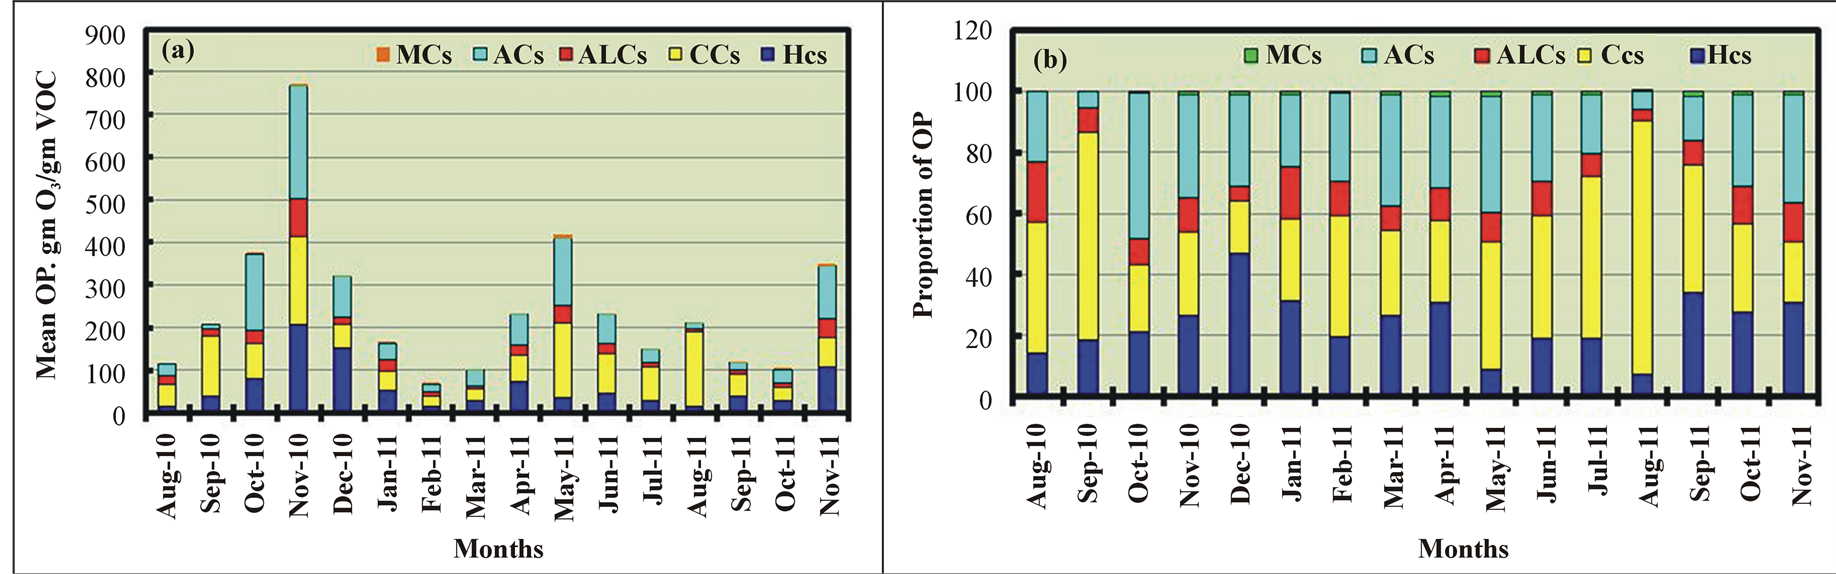
Figure 6. Monthly variations in the mean ozone production (OP) of various chemical classes in ambient air.
ALCs.
The monthly variations in TOP for various CHCs (except HHCs) are shown in Figure 6(a) and indicate that TOP was the highest in November 2010 and lowest in February 2011. TOP was 10 times greater (1035%) in November 2010 than in February 2011. TOP was low in the SU months. By contrast, the mean recorded ozone levels in the O samples were higher in the SU months and lowest in November 2010 (Figure 4(d)) due to the slow photochemical reactions of VOCs emitted in November 2010 compared with VOCs emitted in SU. Of the CHCs, the contributions of CCs, ACs, and HCs to TOP were the highest in nine months (in SU and AU), five months (in AU and SP), and two months (in WI), respectively, as shown in Figure 6(b). This contribution pattern was very similar to that of the CHCs, which were the dominant contributors to TVOC after excluding ALCs (Figure 4(c)). The seasonal and monthly variations were attributed to differences in the chemical compositions, which varied monthly, and in the reactivities of the various VOCs, which greatly affected TOP.
Based on their monthly OP averages, the top 10 VOCs, which contributed more than 86% of TOP, were toluene (14%), acetaldehyde (14%), propene (14%), propanal (13%), xylenes (11%), methanol (5%), acetone (4%), isoprene (4%), isobutene (4%), and 1,3-butadiene (3%). This ordering of the top contributors to TOP was completely different from that of the top contributors to the TVOC level based on its seasonal variation.
4. Conclusions
Our analysis indicated that (1) 48 VOCs were detected in varying levels and in different proportions. Toluene exceeded the recommended air quality guidelines in 2% of the outdoor samples, whereas benzene exceeded the guidelines in 17.5% and 19.5% of the indoor and outdoor samples, respectively. (2) The I/O ratio of 20.6 calculated for ethanol was extremely high compared to those calculated for other VOCs due to the extensive indoor use of perfumes, fragrances, and air fresheners in Kuwait. Moreover, we found that (3) emissions from flaring and crude oil production activities in the north were the major sources of VOCs in the ambient air, while the contributions from vehicle and industrial emissions were negligible. The low percent of BTEX and high mean value of the T/B ratio indicated that vehicle emissions contributed to only a small amount of VOCs. (4) Oxygenated hydrocarbons, which are mainly produced from the photo-oxidation of hydrocarbons, were the most dominant class of VOCs. (5) TVOC levels were highest in autumn and lowest in winter. (6) Due to indoor activities, alcohols were the most dominant class of VOCs in indoor air during all seasons, whereas carbonyls and alcohols accounted for the largest proportion of VOCs in ambient air in the summer due to the high efficiency of photochemical oxidation. Moreover, (7) variations in meteorological conditions, the nature and intensity of emissions from nearby sources, and photochemical activity were the main factors leading to the observed seasonal and monthly variations in the outdoor VOC levels, whereas the indoor VOC levels were affected by the degree of indoor/outdoor air exchange and numerous indoor emission sources. Furthermore, (8) temporal variations in the TVOC levels in the I and O samples were greater during weekdays than on the weekend. The TVOC levels also varied more over 8 h than 24 h due to extensive human activities during the weekdays and in the morning. (9) Of the chemical classes, carbonyls played the dominant role in troposphere ozone production (33%), followed by aromatic hydrocarbons (30%) and alkenes (25%). The top 10 VOCs, which contributed to more than 80% of the total ozone production, were propene (13%), xylenes (12%), propanal (12%), toluene (11%), acetaldehyde (11%), isoprene (6%), methanol (4%), isobutene (3%), acetone (3%), and 1,3-butadiene (3%).
The data from this study will be useful to researchers, epidemiologists, and health authorities.
Acknowledgements
The authors acknowledge and express their thanks and appreciation to the Kuwait Foundation for the Advancement of Sciences (KFAS, grant# 2006-1401-01), the Public Authority for Applied Education and Training (PAAET, grant# TS-08-13), and the Kuwait Awqaf Public Foundation (KAPF) for their financial support of this study. The assistance of Ms. Dalia El-Mougi (Canada) is gratefully acknowledged.
References
- Public Authority for Civil Information (PACI), Kuwait (2012) http://stat.paci.gov.kw/arabicreports/
- Organization of the Petroleum Exporting Countries (OPEC) (2012) World Oil Outlook. http://www.opec.org/opec_web/static_files_project/media/downloads/publications/WOO2012.pdf
- AL-Hamad, K. and Khan, A.R. (2008) Total Emissions from Flaring in Kuwait Oilfields. American Journal of Environmental Science, 4, 31-38. http://dx.doi.org/10.3844/ajessp.2008.31.38
- Ongwandee, M., Moonrinta, R., Panyametheekul, S., Tangbanluekal, C. and Morrison, G. (2011) Investigation of Volatile Organic Compounds in Office Buildings in Bangkok, Thailand: Concentrations, Sources, and Occupant Symptoms. Building and Environment, 46, 1512-1522. http://dx.doi.org/10.1016/j.buildenv.2011.01.026
- Zuraimi, M.S., Roulet, C.A., Tham, K.W., Sekhar, S.C., David Cheong, K.W., Wong, N.H. and Lee, K.H. (2006) A Comparative Study of VOCs in Singapore and European Office Buildings. Building and Environment, 4, 316-329. http://dx.doi.org/10.1016/j.buildenv.2005.01.028
- Al-Salem, S.M. and Khan, A.R. (2010) Review: Monitoring and Modelling the Trends of Primary and Secondary Air Pollution Precursor rs: The Case of the State of Kuwait. International Journal of Chemical Engineering, 2010, 1-11. http://dx.doi.org/10.1155/2010/879836
- Al-Salem, S.M., Bouhamrah, W.S. (2006) Ambient Concentrations of Benzene and Other VOCs at Typical Industrial Sites in Kuwait and Their Cancer Risk Assessment. Research Journal of Chemistry and Environment, 10(4), 42-46.
- Al-Dabbous, A.N., Khan, A.R., Al-Rashidi, M.S. and Awadi, L. (2013) Carbon Dioxide and Volatile Organic Compounds Levels in Mosque in Hot Arid Climate. Indoor and Built Environment, 22, 456-464. http://dx.doi.org/10.1177/1420326X12441807
- Alhumoud, J.M., Al-Ruwaih, F.M., Ali, S.H. and Redhaee, M.H. (2012) Traffic Contribution of Volatile Organic Compounds to the Air-Shed of Kuwait. Management of Environmental Quality: An International Journal, 23, 204-221. http://dx.doi.org/10.1108/14777831211204949
- Alenezi, R. and Ashfaque, A. (2011) Assessment of Ambient Air Quality in Al Jahra Governorate, for 2008. International Journal of Energy and Environment, 5, 582-591.
- Alenezi, R., Al-Anzi, B., Abusam, A. and Ashfaque, A. (2012) Seasonal Influence on the Ambient Air Quality in Al Jahra City for Year 2010. Journal of Environmental Protection, 3, 1711-1718. http://dx.doi.org/10.4236/jep.2012.312186
- Al-Mudhaf, H.F., Abu-Shady, A.I., Al-Khulaifi, N.M. and Selim, M.I. (2013) Indoor and Outdoor Volatile Organic Compounds at Office Buildings in Kuwait. Air Soil and Water Research, 6, 53-72. http://dx.doi.org/10.4137/ASWR.S12153
- US Environmental Protection Agency (US-EPA) (1994) Standardized EPA Protocol for Characterizing Indoor Air Quality in Large Office Buildings. Washington DC.
- US Environmental Protection Agency (US-EPA) (1999) Compendium Method TO-15: Determination of Volatile Organic Compounds (VOCs) in Ambient Air Using Specially Prepared Canisters with Subsequent Analysis by Gas Chromatography. In: Compendium of Methods for the Determination of Toxic Organic Compounds in Ambient Air, 2nd Edition, Washington DC.
- European Council (EC) (2000) Directive 2000/69/EC of the European Parliament and of the Council of 16 November 2000 Relating to Limit Values for Benzene and Carbon Monoxide in Ambient Air. Official Journal of the European Communities, 13 December 2000.
- World Health Organization (WHO) (2000) Air Quality Guidelines for Europe. European Series. 2nd Edition, WHO Regional Publications, Copenhagen.
- Tong, L., Liao, X., Chen, J., Xiao, H., Xu, L., Zhang, F., Niu, Z. and Yu, J. (2013) Pollution Characteristics of Ambient Volatile Organic Compounds (VOCs) in the Southeast Coastal Cities of China. Environmental Science and Pollution Research, 20, 2603-2615. http://dx.doi.org/10.1007/s11356-012-1187-3
- Jia, C., Batterman, S. and Godwin, C. (2008) VOCs in Industrial, Urban and Suburban Neighborhoods, Part 2: Factors Affecting Indoor and Outdoor Concentrations. Atmospheric Environment, 42, 2101-2116. http://dx.doi.org/10.1016/j.atmosenv.2007.11.047
- Destaillats, H., Maddalena, R.L., Singer, B.C., Hodgson, A.T. and McKone, T.E. (2008) Indoor Pollutants Emitted by Office Equipment: A Review of Reported Data and Information Needs. Atmospheric Environment, 42, 1371-1388. http://dx.doi.org/10.1016/j.atmosenv.2007.10.080
- Jia, C., Batterman, S. and Godwin, C. (2007) VOCs in Industrial, Urban and Suburban Neighborhoods, Part 1: Indoor and Outdoor Concentrations, Variation, and Risk Drivers. Atmospheric Environment, 42, 2083-2100. http://dx.doi.org/10.1016/j.atmosenv.2007.11.055
- Choi, E., Choi, K. and Seung-Muk, Y. (2011) Non-Methane Hydrocarbons in the Atmosphere of a Metropolitan City and a Background Site in South Korea: Sources and Health Risk Potentials. Atmospheric Environment, 45, 7563-7573. http://dx.doi.org/10.1016/j.atmosenv.2010.11.049
- Barletta, B., Meinardi, S., Simpson, I.J., Khwaja, H.A., Blake, D.R. and Rowland, F.S. (2002) Mixing Ratios of Volatile Organic Compounds (VOCs) in the Atmosphere of Karachi, Pakistan. Atmospheric Environment, 36, 3429-3443. http://dx.doi.org/10.1016/S1352-2310(02)00302-3
- Saito, S., Nagao, I. and Kanzawa, H. (2009) Characteristics of Ambient C2-C11 Non-Methane Hydrocarbons in Metropolitan Nagoya, Japan. Atmospheric Environment, 43, 4384-4395.
- Guo, H., So, K.L., Simpson, I.J., Barletta, B., Meinardi, S. and Blake, D.R. (2007) C1-C8 Volatile Organic Compounds in the Atmosphere of Hong Kong: Overview of Atmospheric Processing and Source Apportionment. Atmospheric Environment, 41, 1456-1472. http://dx.doi.org/10.1016/j.atmosenv.2006.10.011
- Hoque, R.R., Khillare, P.S., Agarwal, T., Shridhar, V. and Balachandran, S. (2008) Spatial and Temporal Variation of BTEX in the Urban Atmosphere of Delhi, India. Science of the Total Environment, 392, 30-40. http://dx.doi.org/10.1016/j.scitotenv.2007.08.036
- Yurdakul, S., Civan, M. and Tuncel, G. (2013) Volatile Organic Compounds in Suburban Ankara Atmosphere, Turkey: Sources and Variability. Atmospheric Research, 120-121, 298-311. http://dx.doi.org/10.1016/j.atmosres.2012.09.015
- Lee, S.C., Chiu, M.Y., Ho, K.F., Zou, S.C. and Wang, X. (2002) Volatile Organic Compounds (VOCs) in Urban Atmosphere of Hong Kong. Chemosphere, 48, 375-382. http://dx.doi.org/10.1016/S0045-6535(02)00040-1
- Buczynska, A.J., Krata, A., Stranger, M., Godoi, A.F.L., Kontozova-Deutsch, V., Bencs, L., Naveau, I., Roekens, E. and Grieken, R.V. (2009) Atmospheric BTEX Concentrations in an Area with Intensive Street Traffic. Atmospheric Environment, 43, 311-318. http://dx.doi.org/10.1016/j.atmosenv.2008.09.071
- Elbir, T., Cetin, B., Çetin, E., Bayram, A. and Odabasi, M. (2007) Characterization of Volatile Organic Compounds (VOCs) and Their Sources in the Air of İzmir, Turkey. Environmental Monitoring and Assessment, 133, 149-160.
- Monod, A., Sive, B.C., Avino, P., Chen, T., Blake, D.R. and Rowland, F.S. (2001) Monoaromatic Compounds in Ambient Air of Various Cities: A Focus on Correlations between the Xylenes and Ethylbenzene. Atmospheric Environment, 35, 135-149. http://dx.doi.org/10.1016/S1352-2310(00)00274-0
- Miller, L., Xu, X., Wheeler, A.J., Atari, D.O., Grgicak-Mannion, A. and Luginaah, I. (2011) Spatial Variability and Application of Ratios between BTEX in Two Canadian Cities. The Scientific World Journal, 11, 2536-2549. http://dx.doi.org/10.1100/2011/167973
- Moschonas, N. and Glavas, S. (1996) C3-C10 Hydrocarbons in the Atmosphere of Athens, Greece. Atmospheric Environment, 30, 2769-2772. http://dx.doi.org/10.1016/1352-2310(95)00488-2
- Harley, R.A., Hannigan, M.P. and Cass, G.R. (1992) Respeciation of Organic Gas Emissions and the Detection of Excess Unburned Gasoline in the Atmosphere. Environmental Science and Technology, 26, 2395-2408. http://dx.doi.org/10.1021/es00036a010
- Yuval, A.Z. and Broday, D.M. (2008) Revealing Source Signatures in Ambient BTEX Concentrations. Environmental Pollution, 156, 553-562. http://dx.doi.org/10.1016/j.envpol.2008.01.016
- Duan, J., Tan, J., Yang, L., Wu, S. and Hao, J. (2008) Concentration, Sources and Ozone Formation Potential of Volatile Organic Compounds (VOCs) during Ozone Episode in Beijing. Atmospheric Research, 88, 25-35. http://dx.doi.org/10.1016/j.atmosres.2007.09.004
- Sosa, E.R., Bravo, A.H., Mugica, A.V., Sanchez, A.P., Bueno, L.E. and Krupa, S. (2009) Levels and Source Apportionment of Volatile Organic Compounds in Southwestern Area of Mexico City. Environmental Pollution, 157, 1038- 1044. http://dx.doi.org/10.1016/j.envpol.2008.09.051
- Sarkhosh, M., Mahvi, A.H., Yunesian, M., Nabizadeh, R., Borji, S.H. and Bajgirani, A.G. (2013) Source Apportionment of Volatile Organic Compounds in Tehran, Iran. Bulletin of Environmental Contamination and Toxicology, 90, 440-445. http://dx.doi.org/10.1007/s00128-012-0948-5
- Leuchner, M. and Rappenglück, B. (2010) VOC Source-Receptor Relationships in Houston during TexAQS-II. Atmospheric Environment, 44, 4056-4067. http://dx.doi.org/10.1016/j.atmosenv.2009.02.029
- Tassi, F., Capecchiacci, F., Giannini, L., Vougioukalakis, G.E. and Vaselli, O. (2013) Volatile Organic Compounds (VOCs) in Air from Nisyros Island (Dodecanese Archipelago, Greece): Natural versus Anthropogenic Sources. Environmental Pollution, 180, 111-121. http://dx.doi.org/10.1016/j.envpol.2013.05.023
- Civan, M.Y., Kuntasal, O.O. and Tuncel, G. (2011) Source Apportionment of Ambient Volatile Organic Compounds in Bursa, a Heavily Industrialized City in Turkey. Environmental Forensics, 12, 357-370. http://dx.doi.org/10.1080/15275922.2011.622345
- Zhang, J., Sun, Y., Wu, F., Sun, J. and Wang, Y. (2013) The Characteristics, Seasonal Variation and Source Apportionment of VOCs at Gongga Mountain, China. Atmospheric Environment, in Press. http://dx.doi.org/10.1016/j.atmosenv.2013.03.036
- Ho, K.F., Lee, S.C., Guo, H. and Tsai, W.Y. (2004) Seasonal and Diurnal Variations of Volatile Organic Compounds (VOCs) in the Atmosphere of Hong Kong. Science of the Total Environment, 322, 155-166. http://dx.doi.org/10.1016/j.scitotenv.2003.10.004
- Parra, M.A., González, L., Elustondo, D., Garrigó, J., Bermejo, R. and Santamaría, J.M. (2006) Spatial and Temporal Trends of Volatile Organic Compounds (VOC) in a Rural Area of Northern Spain. Science of the Total Environment, 370, 157-167. http://dx.doi.org/10.1016/j.scitotenv.2006.06.022
- Moussa, S.G., El-Fadel, M. and Saliba, N.A. (2006) Seasonal, Diurnal and Nocturnal Behaviors of Lower Carbonyl Compounds in the Urban Environment of Beirut, Lebanon. Atmospheric Environment, 40, 2459-2468. http://dx.doi.org/10.1016/j.atmosenv.2005.12.031
- Pang, X. and Mu, Y. (2006) Seasonal and Diurnal Variations of Carbonyl Compounds in Beijing Ambient Air. Atmospheric Environment, 40, 6313-6320. http://dx.doi.org/10.1016/j.atmosenv.2006.05.044
- Cai, C., Geng, F., Tie, X., Yu, Q. and An, J. (2010) Characteristics and Source Apportionment of VOCs Measured in Shanghai, China. Atmospheric Environment, 44, 5005-5014. http://dx.doi.org/10.1016/j.atmosenv.2010.07.059
- Parra, M.A., Elustondo, D., Bermejo, R. and Santamaria, J.M. (2009) Ambient Air Levels of Volatile Organic Compounds (VOC) and Nitrogen Dioxide (NO2) in a Medium Size City in Northern Spain. Science of the Total Environment, 407, 999-1009. http://dx.doi.org/10.1016/j.scitotenv.2008.10.032
- Vardoulakis, S., Solazzo, E. and Lumbreras, J. (2011) Intra-Urban and Street Scale Variability of BTEX, NO2 and O3 in Birmingham, UK: Implications for Exposure Assessment. Atmospheric Environment, 45, 5069-5078. http://dx.doi.org/10.1016/j.atmosenv.2011.06.038
- Suthawaree, J., Tajima, Y., Khunchornyakong, A., Kato, S., Sharp, A. and Kajii, Y. (2012) Identification of Volatile Organic Compounds in Suburban Bangkok, Thailand and Their Potential for Ozone Formation. Atmospheric Research, 104-105, 245-254. http://dx.doi.org/10.1016/j.atmosres.2011.10.019
- Shan, W., Yin, Y., Zhang, J. and Ding, Y. (2008) Observational Study of Surface Ozone at an Urban Site in East China. Atmospheric Research, 89, 252-261. http://dx.doi.org/10.1016/j.atmosres.2008.02.014
- Yuan, B., Shao, M., Lu, S. and Wang, B. (2010) Source Profiles of Volatile Organic Compounds Associated with Solvent Use in Beijing, China. Atmospheric Environment, 44, 1919-1926. http://dx.doi.org/10.1016/j.atmosenv.2010.02.014
- Gouw, J. and Warneke, C. (2007) Measurements of Volatile Organic Compounds in the Earth’s Atmosphere Using Proton-Transfer-Reaction Mass Spectrometry. Mass Spectrometry Reviews, 26, 223-257. http://dx.doi.org/10.1002/mas.20119
- Filella, I. and Penuelas, J. (2006) Daily, Weekly, and Seasonal Time Courses of VOC Concentrations in a Semi-Urban Area near Barcelona. Atmospheric Environment, 40, 7752-7769. http://dx.doi.org/10.1016/j.atmosenv.2006.08.002
- Carter, W.P.L. (2010) Development of the SAPRC-07 Chemical Mechanism. Atmospheric Environment, 44, 5324-5335. http://dx.doi.org/10.1016/j.atmosenv.2010.01.026
NOTES

*Corresponding author.