Journal of Environmental Protection
Vol. 4 No. 9 (2013) , Article ID: 36370 , 8 pages DOI:10.4236/jep.2013.49110
Evaluation of Local Scale PM Pollution Levels in Typical Street Canyon in Riga
![]()
1Faculty of Geography and Earth Sciences, University of Latvia, Riga, Latvia; 2Institute of Solid State Physics, University of Latvia, Riga, Latvia; 3Housing and Environment Department, Riga City Council, Riga, Latvia; 4Faculty of Engineering, Vidzeme University of Applied Sciences, Valmiera, Latvia.
Email: *iveta.steinberga@lu.lv
Copyright © 2013 Iveta Steinberga et al. This is an open access article distributed under the Creative Commons Attribution License, which permits unrestricted use, distribution, and reproduction in any medium, provided the original work is properly cited.
Received June 17th, 2013; revised July 20th, 2013; accepted August 16th, 2013
Keywords: Air Pollution; PM; Riga; Street Canyon; Source-Apportionment
ABSTRACT
The present study describes long term PM10 and PM2.5 changes in typical street canyon with particular emphasis on seasonal, diurnal variations in context with meteorological data. In order to understand PM10 pollution sources during 28 April 2007-31 December 2007, chemical composition measurements were done with particular emphasis on heavy metals (As, Cd, Ni, and Pb), crustal material (Ca, Mg, Na, and K) and anions (sulphates, nitrates, chlorides). Meteorological data used for this evolutional analysis were measured close to traffic related stations and several meteorological parameters were analyzed in relation to particulate measurements. Keep in mind that atmospheric aerosols are generally hydroscopic. Relative humidity which plays very important role in rain/snow and humidity impact are analyzed.
1. Introduction
Urban air pollution is essential in public, governmental, self governmental and European concern as well. Some well known air pollution problems, such as high PM10 pollution episodes (e.g. London smog) and long-term steady NO2 pollution levels in connection with meteorological data, human health and economic impact are significant [1]. Monitoring atmospheric particulate matter is a challenge faced by the European Union. Specific rules on this subject are being developed (Directive 2004/107/EC, Directive 2008/ 50/EC) in order to reduce the potential adverse effects on human health caused by air pollution. The atmospheric aerosols are produced by variety of natural (soil dust erosion, sea salt, volcanism, natural forest fires) and anthropogenic (industries, transport, biomass burning, combustion of fossil fuels) activities and are very much important to characterize various lower tropospheric phenomenon. Atmospheric particles with an aerodynamic diameter smaller than 10 μm (PM10) have been put under scrutiny in the past, being easily inhaled and deposited within the respiratory system [2]. Studies show that PM10 plays a role in the incidence and severity of respiratory diseases [3,4] and has significant associations with decline in lung function and cardio-vascular pathologies. A lot of epidemiological studies on the health effects of air pollution were concerned with measuring the link between daily deaths and the kind of severe pollution episodes that occurred in London, England in 1952, Donora, Pennsylvania in 1948, and the Meuse Valley, Belgium in 1930. Using simple methods, these studies established a link between cardiopulmonary mortality and extreme levels of sulfur oxide and particulate matter [5].
In addition, particles in suspension in the atmosphere can play a role in the radiative balance of the earth since they permit the absorption or the reflection of solar radiation, allowing them to alter global climate. Usually in different countries, while a monitoring of the PM measurements is routinely performed at different scales (regional, national scale, site specific), almost nothing is done to finely identify their chemical composition and source origin. Scientific studies have rather privileged sampling strategies based on a limited number of sites associated with a sourcereceptor modelling [6].
Life time of coarse particles is relatively short. They are effectively impacted by gravitational settling and wind turbulence. According to fractional analysis, it could be assumed that PM2.5 life time could range from several days till several weeks that lead it to long range transport [7].
2. Methodology
2.1. Sampling Site Description
All the measurements given here were obtained in different sampling sites in Riga (North-East part of Europe). Two sampling sites (Street Canyon (1) and Street Canyon (2)) were located in city center, in typical street canyon; another two sites were in mixed industrial-heavy traffic impacted areas. Major pollution sources in the study area are traffic with average daily flow intensity 25,000 vehicles per day in street canyons located in city center. Both streets are 15 m wide and are flanked on both sides with about 22 - 30 m high buildings, geographical orientation - 223 degrees (NE-SW direction). Typical traffic flow regime during working days is given in Figure 1. Another two sampling sites (Urban/Traffic Site (1) and Urban/traffic Site (2)) are located close to Riga Free Port activities, such as oil terminals, grain and coal processing, rail activities. Location of air quality monitoring stations and meteorological station are presented in Figure 2.
The meteorological data site (56˚57'2.16''N and 24˚06'57.86''E, height 6 m above sea level for temperature measurements and 26 m above ground level for wind measurements) used was from Riga-University monitoring site located at central part of Riga. Monitoring program covers widest spectra of measurements—standard meteorology (wind speed and direction, air temperature, solar radiation, precipitation, et al.) and some specific measurements—ice condition, snow cover and condition. The climate is maritime and temperate, due to northern location winter temperature extremes could reach −30˚C for short periods, especially during January and February, average winter temperature is −4˚C, continuous snow cover lasts eighty-two days. Due to the proximity of the ocean autumn rains and fogs are frequent. Average summer temperature is 17˚C, with extreme values for 30˚C.
2.2. Sampling Method
PM sampling were done by OPSIS instrument SM200 Beta attenuation particulate monitor (gravimetric sampler), which is an automatic method. Instrument is equipped with PM10/PM2.5 head, inlet intensity 2.3 m3/h, and mass measurement range 0 - 1000 μg/m3. Overview of used monitoring standards is given in Table 1.
3. Results and Discussion
Only data sets with at least 75% completeness of data were used for analysis. For long-term analysis data set of 10 year period (2003-2012) for PM10 and 4 year period (2008-2011) for PM2.5 were used. For source-apportionment analysis results of field survey for eight months period (28.04.2007. −31.12.2007.) was analyzed.
3.1. Long-Term Changes
Figure 3 shows long-term changes of PM10 and PM2.5 concentrations on typical street canyons. It should be noted that quite strong decreasing trend is detected and for the last two years annual limit value (40 mg/m3) aren’t exceeded. Concerning PM2.5 pollution levels target value (25 µg/m3) is exceeded for all measurement period. According to European legislation PM2.5 target value enters into force as limit value at 2015.
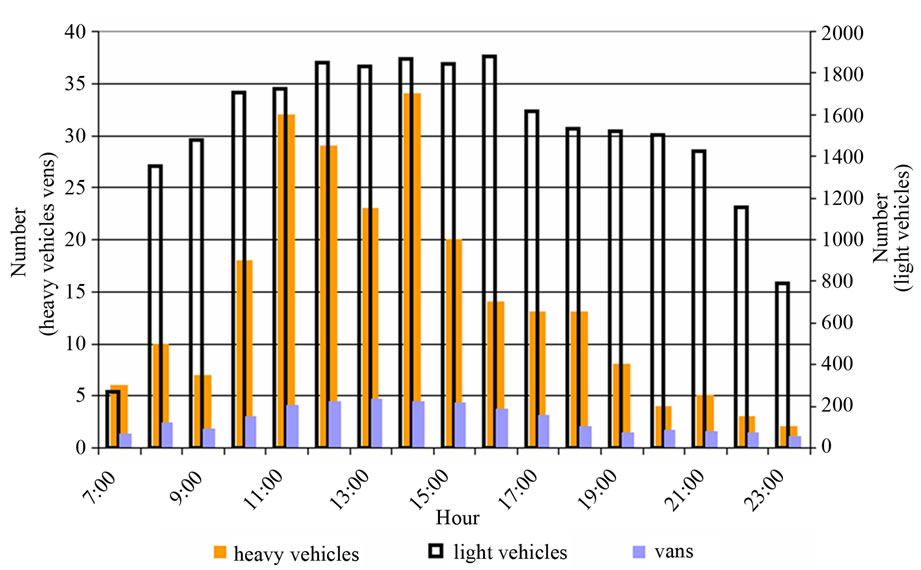
Figure 1. Typical traffic flow regime during working days (traffic flow video counting).
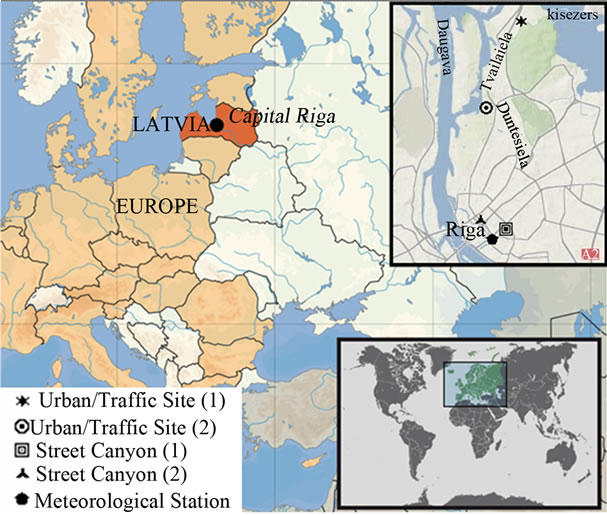
Figure 2. Location of air quality monitoring stations in Riga (Latvia).
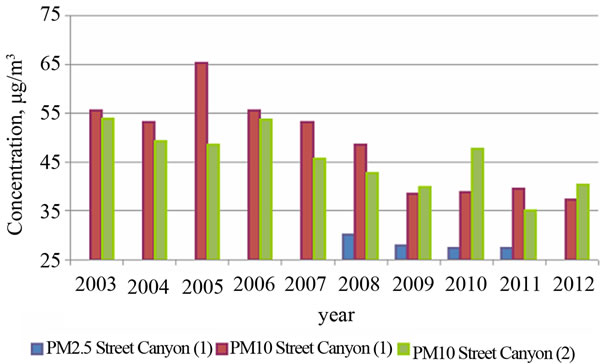
Figure 3. Long-term changes of PM measurements in 2 parallel street canyons.
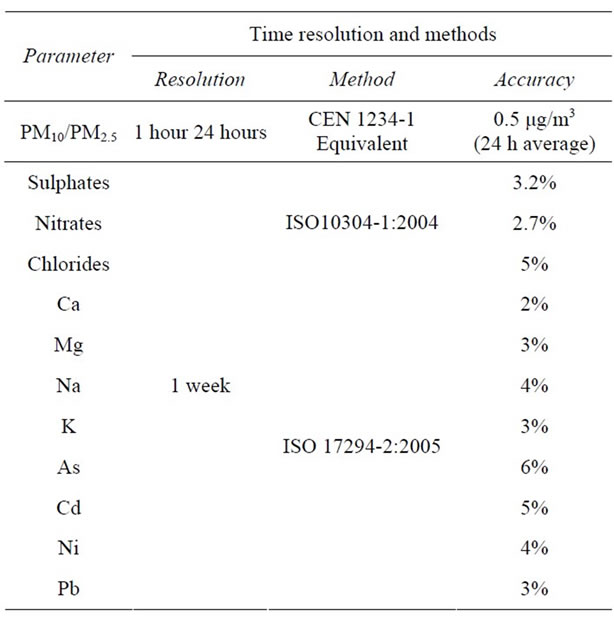
Table 1. Monitoring methods, resolution time and accuracy.
3.2. Complex Analysis
The meteorological and synoptical conditions are very important in pollutant dispersion. In case of particulate matter pollution strong precipitation effectively decreases pollution level of coarse particles, while strong solar activity in context with secondary particulate precursors leads to PM2.5 formation. In this study impact of air temperature, wind speed, precipitation, humidity and wind speed was analyzed. Air temperature shows strong negative correlation with PM10 hourly values, which clearly indicates ineffective fuel burning processes in car engines during cold winter season and local point sources couldn’t be “blamed” as usage of them is prohibited for last 8 years according to local authority law. It should be noted that intensive usage of antiacers (mixture of NaClsand) leads for extremely high concentrations during spring time (Figure 4).
Normally for whole period strong winds leads to better dispersion. Such kind of negative correlation was found also for Riga city. Unfortunately during late spring season correlation between wind speed and PM10 pollution levels correlate positively, what could be explained by very intensive resuspension and drying processes (Figure 5).
Analysis of precipitation and PM10 concentrations shows clear pollution accumulation tendency during dry periods (without rain) and very rapid (sometimes by factor of 2.5) decreasing of pollution during rain period (Figure 6).
Keeping in mind that atmospheric aerosols are generally hydroscopic, relative humidity plays very important role. According to our analysis low air humidity values (40% - 50%) negatively correlate with PM10 pollution data (Figure 7). Quite intensive resuspension, low air humidity and dry periods without precipitation lead to
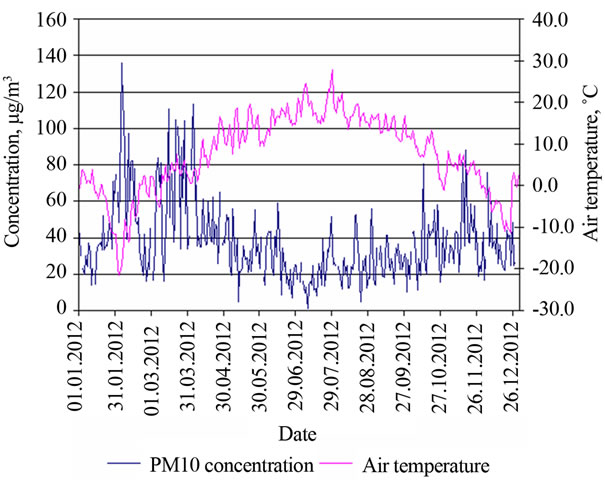
Figure 4. Comparative evaluation of PM10 concentrations at station Street Canyon (1) and air temperature for 2012.
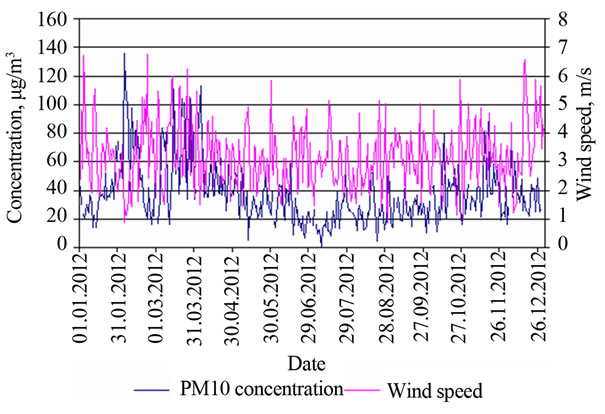
Figure 5. PM10 concentrations at station Street Canyon (1) and wind speed for 2012.
extremely high PM10 pollution levels during all spring season.
According to analysis South and Southwest winds lead to slightly lower PM10 concentrations and keeping in mind that street is orientated in Southwest direction these winds could be classified as “clean winds” (Figure 8). Long term climate records show that such sector winds are secondary prevailing during autumn season and occurrence of them during other seasons are very low. For example daily prevailing occurrence of North winds during 2012 weren’t detected at all.
3.3. Chemical Composition Results during Measurement Campaign
According to measurements PM2.5 average daily values
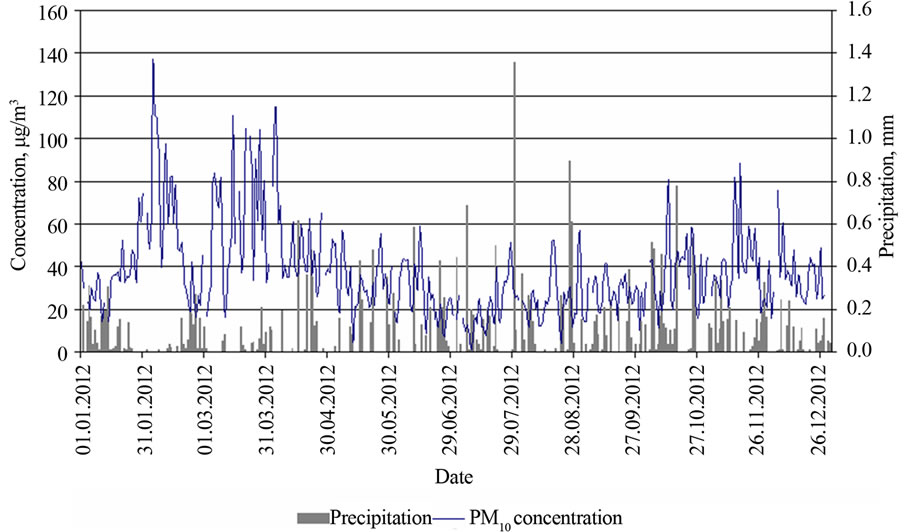
Figure 6. PM10 concentrations at station Street Canyon (1) and precipitation intensity for 2012.
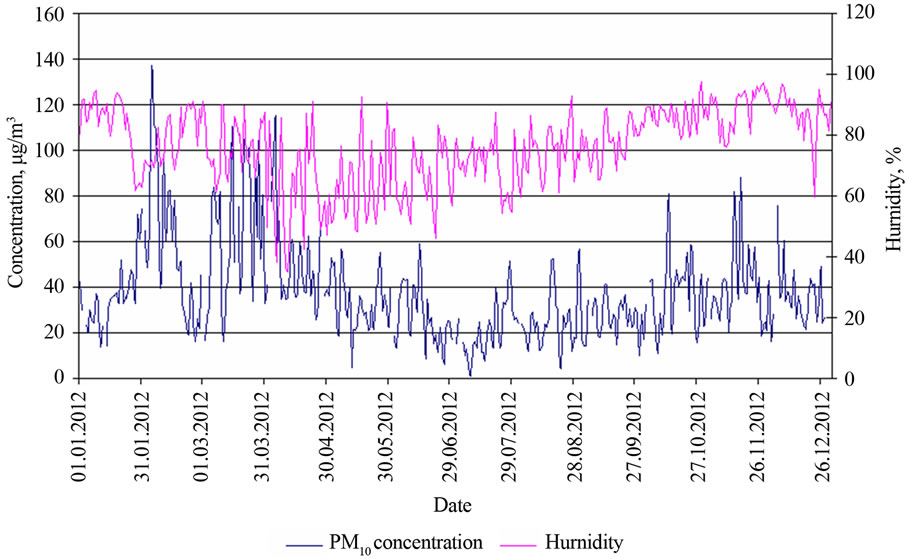
Figure 7. PM10 concentrations at station Street Canyon (1) and humidity for 2012.
varies from 3.8 μg/m3 till 39.0 μg/m3 (average value for whole period—19.4 μg/m3) and PM10 average daily values varieties from 8.1 μg/m3 till 62.0 μg/m3 (average value for whole period—27.1 μg/m3). Seasonal variations are represented in Figures 9-10.
During 8-month monitoring campaign PM2.5 concentration varies between 11 - 20 μg/m3 at 42% of cases and concentrations levels are closer to upper limit. In the new Air Quality Directive (2008/50/EC) for PM2.5 additional objective were included targeting the exposure of the population to fine particles. This objective (20 μg/m3) was set at the national level and is based on the average exposure indicator (AEI) for 3-year running period. Campaign results have been shown that PM2.5 pollution
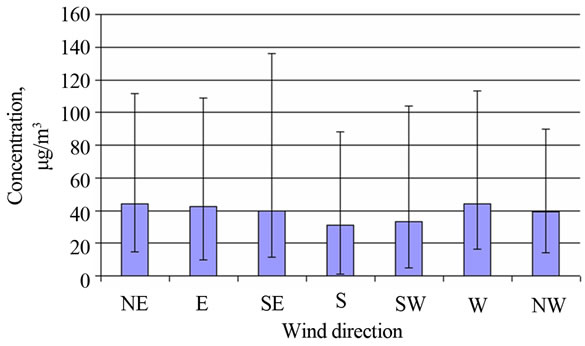
Figure 8. PM10 concentrations at station Street Canyon (1) depending on wind direction for 2012.
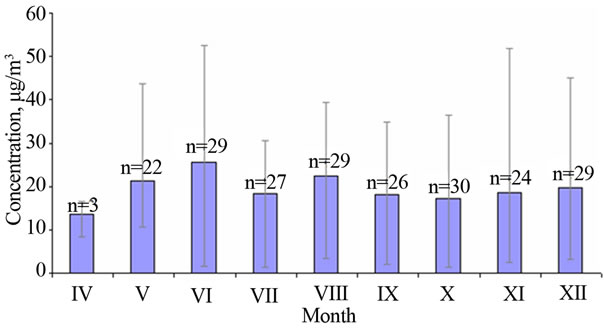
Figure 9. PM2.5 concentration levels, n indicates number of measurements.
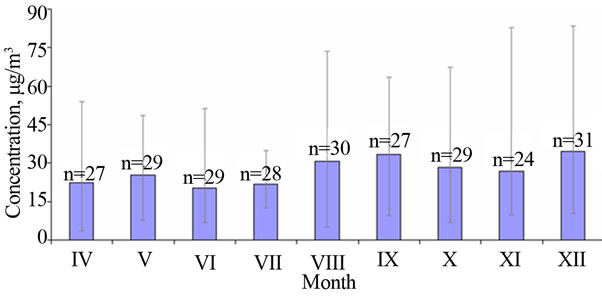
Figure 10. PM10 concentration levels, n indicates number of measurements.
levels already reached allowed targeting values at these traffic/industrial monitoring sites but at street canyon sites these levels were exceeded.
It has been detected that there are no any seasonal variations for PM2.5, during at all seasons concentrations between 11 - 30 μg/m3 (Figure 11).
Higher PM10 concentration fluctuations detected in winter, but lower concentrations during summer season. Concentrations from 11 μg/m3 till 30 μg/m3dominates (occurrence 58%), about 4% of measurements show very high (above 60 μg/m3) concentrations levels. During summer PM10 concentrations are more homogenous which indicates that pollution level is more stable and more effected by long range air pollution transport and background pollution neither local sources. This study revealed that PM10 daily values exceeded 80 μg/m3 has been detected only during winter season (Figure 12).
Monitoring results of As, Cd, Ni and Pb indicates different pollution sources (Figure 13). Changes of Cd and As are synchronized which indicate common pollution source, but very fluctuating concentrations of Ni could be a result of non-periodically emitting source. Detected average concentration of As was 0.44 nm/m3 (0.13 - 2.14 ng/m3); Cd—0.64 ng/m3 (0.03 - 1.81 ng/m3); Ni—2.10 ng/m3 (0.24 - 4.29 ng/m3); Pb—13.33 ng/m3 (1.14 - 25.15 ng/m3).
Presence of high simultaneously variable Na, K and Ca ions during all measurement campaign indicates one common source as resuspension, erosion and sea salt impact. Results clearly show resuspension processes during all measurement period (Figure 14). Detected average Ca concentrations were 0.14 μg/m3 (0.07 - 0.22 μg/m3); K—0.16 μg/m3 (0.04 - 0.38 μg/m3); Mg—0.04 μg/m3 (0.02 - 0.07 μg/m3); Na—0.13 μg/m3 (0.07 - 0.19 μg/m3).
Relation PM10/PM2.5 according to statistical analysis were statistically significant (Pearson correlation factor 0.629; p = 0.01) indicating that 63% of PM10 pollution level could be explained by PM2.5 pollution (Figure 15).
In order to distinguish traffic impact PM10 and PM2.5 concentrations were separated between working days and holidays. Extreme PM10 and PM2.5 pollution levels were detected particularly in working days. In case of PM2.5 difference between working days and holidays in average are about 10 μg/m3 (Figures 16 and 17).
4. Conclusions
1) Strong decreasing trend is detected and for the last two years PM10 annual limit value (40 mg/m3) is not exceeded; PM2.5 pollution level target value (25 µg/m3) is exceeded for all measurement period. According to European legislation, PM2.5 target value enters into force as limit value at 2015.
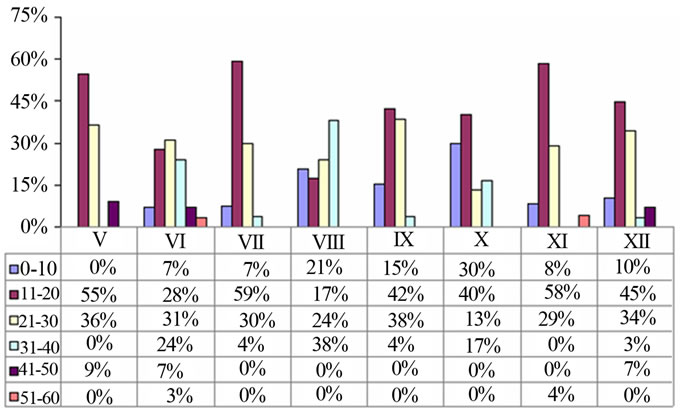
Figure 11. Distribution of PM2.5 concentrations.
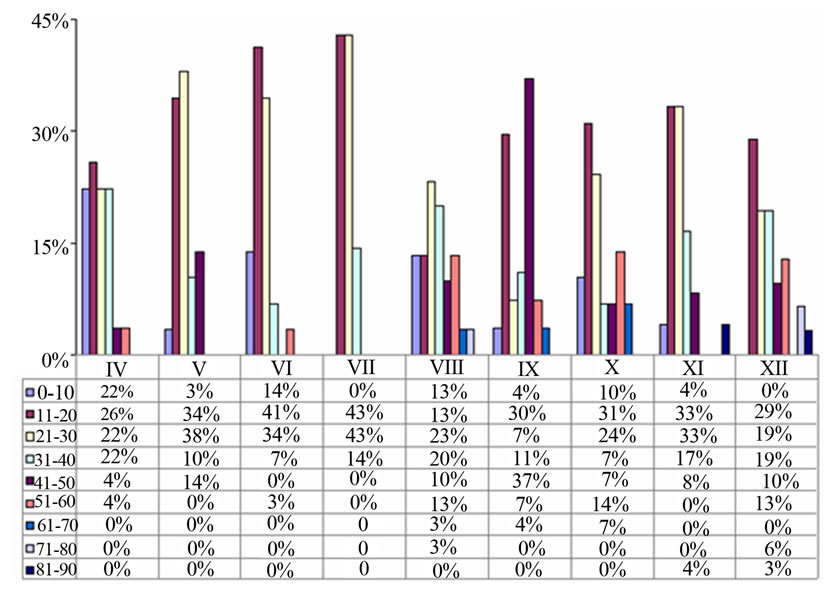
Figure 12. Distribution of PM10 concentrations.
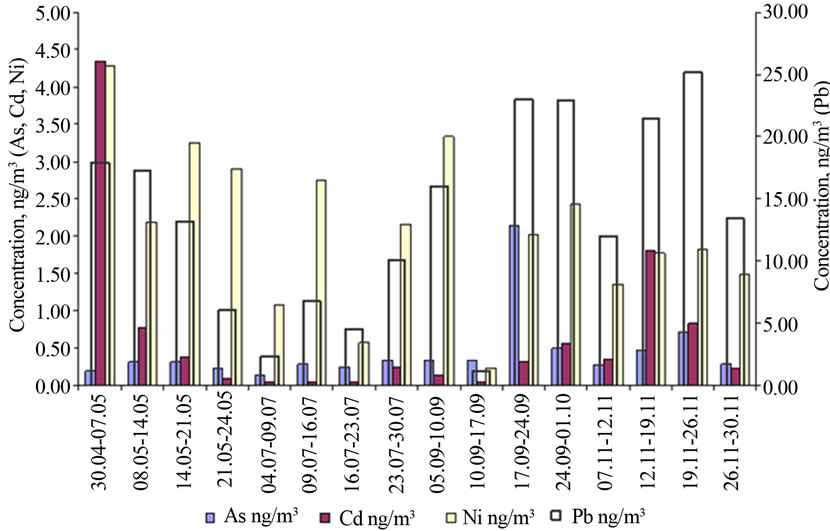
Figure 13. Monitoring results of heavy metals (As, Cd, Ni, Pb).
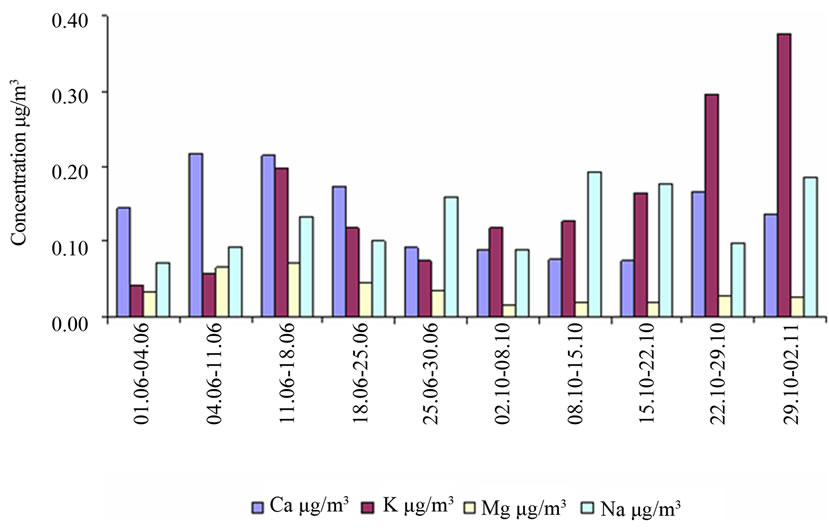
Figure 14. Monitoring results of Ca, K, Mg, Na ions.
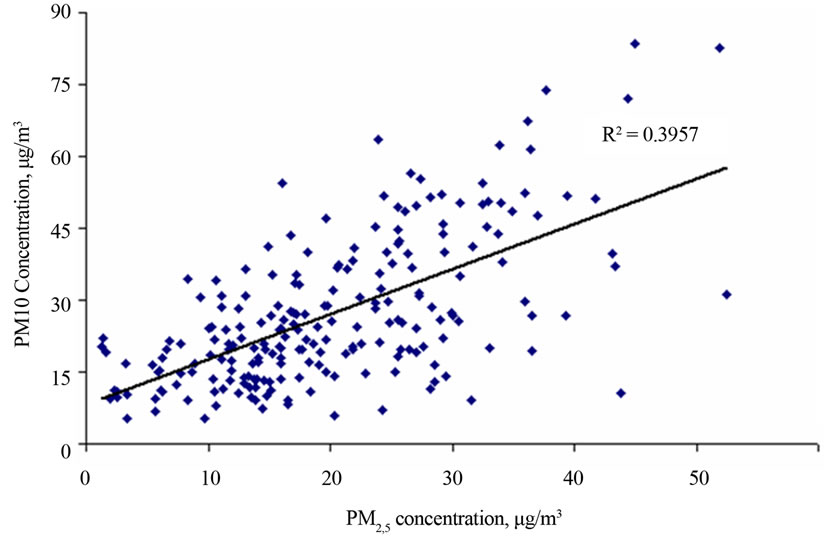
Figure 15. PM10/PM2.5 relation.
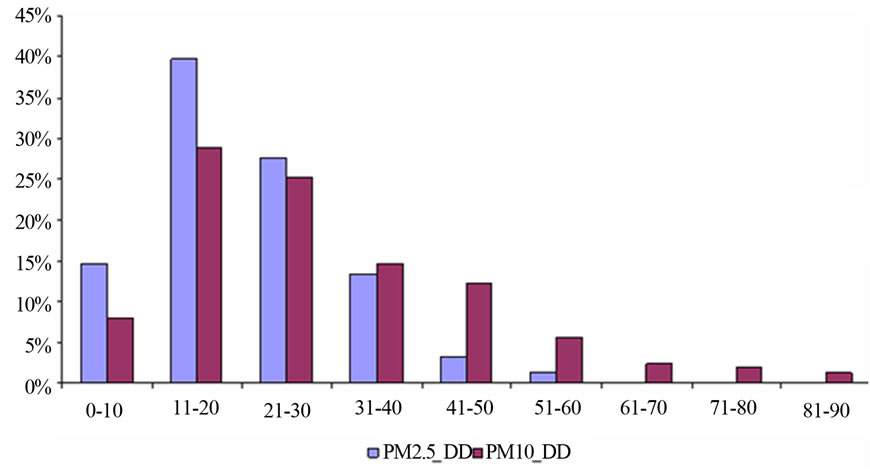
Figure 16. PM10 and PM2.5 distribution during working days (DD).
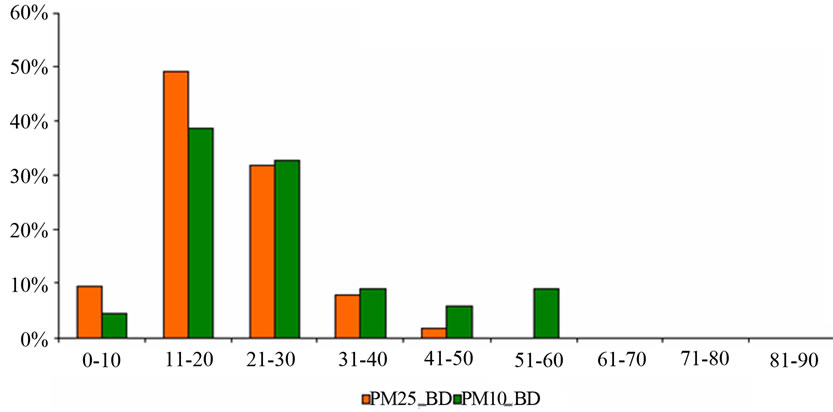
Figure 17. PM10 and PM2.5 distribution during holidays (BD).
2) Air temperature shows strong negative correlation with PM10 hourly values, which clearly indicates ineffective fuel burning processes in car engines during cold winter season and intensive usage of antiacers (mixture of NaCl-sand) leads for extremely high concentrations during spring time.
3) Overall negative correlation between wind speed and concentration levels is found, only during late spring season when correlation becomes positive, which is explained by very intensive resuspension and drying processes.
4) Low air humidity values (40% - 50%) negatively correlate with PM10 pollution, quite intensive resuspension, low air humidity and dry periods without precipitation leads to extremely high PM10 pollution levels during all spring season.
5) Precipitation and PM10 concentration analysis shows clear pollution accumulation tendency during dry periods and very rapid (by factor of 2.5) decreasing of pollution.
6) Campaign results have shown that present PM2.5 pollution levels allow targeting values at these traffic/ industrial monitoring sites. But at street canyon sites, these levels were exceeded. Stable PM2.5 pollution indicates high background pollution levels.
7) Fluctuating concentrations of Cd and Ni indicates organized/non-organized incineration of waste.
5. Acknowledgements
We wish to thank Riga City Council for air pollution and traffic flow data and Latvian Environmental, Geological and Meteorological Center for meteorological data.
REFERENCES
- C. I. Beattie, J. W. S. Longhurst and N. K. Woodfield, “Air Quality Management: Evolution of Policy and Practice in the UK as Example by the Experience of English Local Government,” Atmospheric Environment, Vol. 35, No. 8, 2001, pp. 1479-1490. doi:10.1016/S1352-2310(00)00311-3
- C. A. Pope, M. Thun, M. Namboodiri, D. Dockery, J. Evans, F. Speizer and C. Heath, “Particulate Air Pollution as a Predictor of Mortality in a Prospective Study of US Adults,” American Journal Respiratory Critical Care Medicine, Vol. 151, 1995, pp. 669-674. doi:10.1164/ajrccm/151.3_Pt_1.669
- C. A. III Pope and D. W. Dockery, “Epidemiology of Particle Effects,” In: S. T. Holgate, J. M. Samet, H. S. Koren and R. L. Maynard, Eds., Air Pollution and Health, Academic Press, San Diego, 1999.
- B. Brunekreef and S. T. Holgate, “Air Pollution and Health,” Lancet, Vol. 360, 2002, pp. 1233-1242.
- G. Koop and L. Tole, “An Investigation of Thresholds in Air Pollution-Mortality Effects,” Environmental Modelling & Software, Vol. 21, 2006, pp. 1662-1673. doi:10.1016/j.envsoft.2005.07.012
- X. Querol, A. Alastuey, C. R. Ruiz, B. Artinano, H. C. Hansson, R. M. Harrison, E. Buringh, H. Mten Brink, M. Lutz, P. Bruckmann, P. Straehl and J. Schneider, “Speciation and Origin of PM10 and PM2.5 in Selected European Cities,” Atmospheric Environment, Vol. 38, 2004, pp. 6547-6555. doi:10.1016/j.atmosenv.2004.08.037
- WHO, “Air Quality Guidelines,” WHO, Geneva, 2005.
NOTES
*Corresponding author.