Journal of Environmental Protection
Vol. 4 No. 3 (2013) , Article ID: 28739 , 11 pages DOI:10.4236/jep.2013.43034
Wastewater Pollution Abatement in China: A Comparative Study of Fifteen Industrial Sectors from 1998 to 2010
![]()
1Graduate School of Environmental Studies, Tohoku University, Sendai, Japan; 2Graduate School for International Development and Cooperation, Hiroshima University, Higashi-Hiroshima, Japan.
Email: hidemichifujii@gmail.com
Received January 15th, 2013; revised February 12th, 2013; accepted March 5th, 2013
Keywords: Cleaner Production; End-of-Pipe; Wastewater Treatment; Decomposition Analysis; China
ABSTRACT
This study analyzes the management of wastewater pollutants in a number of Chinese industrial sectors from 1998 to 2010. We use decomposition analysis to calculate changes in wastewater pollutant emissions that result from cleaner production processes, end-of-pipe treatment, structural changes in industry, and changes in the scale of production. We focus on one indicator of water quality and three pollutants: chemical oxygen demand (COD), petroleum, cyanide, and volatile phenols. We find that until 2002, COD emissions were mainly reduced through end-of-pipe treatments. Cleaner production processes didn’t begin contributing to COD emissions reductions until the introduction of a 2003 law that enforced their implementation. Petroleum emissions were primarily lowered through cleaner production mechanisms, which have the added benefit of reducing the input cost of intermediate petroleum. Diverse and effective pollution abatement strategies for cyanide and volatile phenols are emerging among industries in China. It will be important for the government to consider differences between industries should they choose to regulate the emissions of specific chemical substances.
1. Introduction
Through industrialization, China’s economy has grown and developed dramatically. However, many environmental problems from industrial pollution have increased in China as a result of this development [1]. Environmental problems have serious consequences in China, particularly in northern regions, where water pollution is exacerbating existing water shortages [2]. In order to mitigate the increasing levels of water pollution, the Chinese government has begun to enforce more stringent environmental regulations and has introduced a levy system to promote wastewater management in different Chinese industrial sectors (see Appendix 1). According to Shao [3], the Chinese government has enacted more than 130 policies related to environmental protection since 1979. These policies were intended to alleviate the deterioration of aquatic habitats and to improve surface water quality.
Improving the quality of industrial wastewater is a high-priority goal of the Chinese government. In China’s ninth five-year plan, the government enforced strong environmental policies in order to decrease industrial pollution. From 1997 to 2000, China forced more than 80,000 small enterprises in 15 heavily polluting industries to shut down or eliminate production lines [4]. Additionally, the government promoted the use of more environmentally sensitive production equipment. As a result of these active environmental policies, the quality of industrial wastewater improved dramatically in the late 1990s (see Figure 1).
Figure 1 shows how chemical oxygen demand (COD) emissions per sale decreased by 95% between the years 1998 and 2010. Emissions of petroleum, cyanide, and volatile phenols per sale also decreased by more than 90% in this period.
How have different Chinese industrial sectors successfully improved the quality of their wastewater? It is clear that different levels of pollution in wastewater are associated with different industrial sectors. These differences stem from variation in industrial characteristics between sectors, including variation in intermediate material inputs and production processes (see Table 1). Additionally, the availability of wastewater pollution abatement technology and the cost of abatement differ among industrial sectors.
In Table 1, we can see that the pulp and paper industry generates highly contaminated wastewater. As a result, the ninth five-year plan prioritized improved wastewater

Figure 1. Changes in emissions of industrial wastewater pollutants. (Source: China environmental yearbook, 2011). *COD: 1000 tons, petroleum: 10 tons, cyanide: 10 tons, volatile phenol: 10 tons (Bar chart, left axis); **COD/sale, petroleum/sale, and cyanide/sale show changes in ratios, standardized by 1998 values (line chart, right axis).
Table 1. Characteristics of industrial wastewater pollution by industrial sector, 2010.
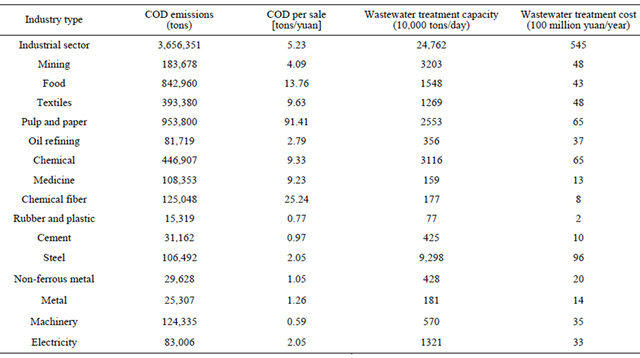
Source: China environmental yearbook, 2011.
treatment in the pulp and paper industry; the plan was particularly concerned with reducing COD emissions. The rubber and plastic, machinery industries are associated with lower levels of wastewater pollution, demonstrating how the intensity of industrial wastewater pollution depends on industry-specific characteristics. The steel industry has a tremendous capacity for wastewater treatment and accounts for approximately 40% of total industrial wastewater management. Treatment costs are expensive in the steel and chemical industries. Understanding differences in these industrial characteristics is important to identifying why and how wastewater treatment has been successfully implemented in China.
In this section, we discuss the different types of environmental management utilized in China’s industrial sectors. Generally, environmental management can be divided into two major approaches: end-of-pipe (EOP) treatment and cleaner production (CP) [5].
The EOP approach removes pollutants from wastewater using “filters” installed on wastewater treatment equipment or drains. Removal of pollutants occurs during the final stages of production. The EOP approach can effectively reduce emissions immediately after the proper equipment is installed. However, the EOP approach has several drawbacks. For instance, the EOP approach can cause secondary environmental pollution problems, such as the generation of sludge waste during wastewater treatment. Furthermore, the EOP approach requires a significant upfront investment in equipment and ongoing operational costs that can be prohibitively expensive.
The CP approach is defined as “the continuous application of an integrated preventive environmental strategy to processes, products, and services to increase overall efficiency, and reduce risks to humans and the environment” [6]. While the CP approach also requires an investment in equipment, operational costs are not as expensive as an EOP approach. This difference in cost is because CP equipment does not require filters and absorbent materials to remove pollutants [7]. Furthermore, because an improved production process can save on intermediate material, cost reduction is another benefit of the CP approach [8].
However, it is impossible for manufacturing companies to remove all environmental pollution by applying only a CP approach. In short, companies need to balance an EOP approach with a CP approach in order to meet high environmental standards and company goals [9].
2. Literature Review and Objective
There are a number of previous studies in the literature that focus on the issue of Chinese industrial wastewater. Wang [9] studied the Chinese levy system, estimating the elasticity of operational costs and new investment, given pollution charges in China. His estimations applied an econometrics model to emissions data on COD and total suspended solids (TSS). The study concluded that the Chinese pollution tax system provided a strong, positive incentive for large and medium-size industrial polluters to invest heavily in abatement technologies.
Wang & Wheeler [10] also studied the effects of the levy system in China. These authors used COD and TSS data from 3000 Chinese factories for estimation. The primary finding from this study was that the levy system had a much greater impact on the production process than on end-of-pipe abatement. Wang & Wheeler (2005) also demonstrated that all of their estimation results were affected by sectoral dummy variables, used to reflect the impact of differences in material inputs and process technology on abatement cost.
Zhang et al. [11] utilized simulation models to forecast wastewater pollutants in the Chinese pulp industry. They applied a linear optimization program to pollutant data on COD emissions in order to run simulations. The model generated and analyzed technology prospects for controlling COD emissions in different scenarios in 2010, 2020, and 2030.
Several previous studies focused on regional environmental policy. Geng et al. [12] studied an initiative promoting cleaner production in Liaoning province, China. The authors concluded that the increased political commitment of the provincial government in Liaoning eventually led to the official adoption of cleaner production as a long-term development strategy. Diao et al. [13] focused on the relationship between economic growth and environmental quality in Jiaxing, Zhejiang, China. In this study, the authors applied the environmental Kuznets curve hypothesis. The authors’ main finding was that the amount of industrial wastewater discharge would be alleviated with economic growth in Jiaxing, China.
As we described above, there have been many studies focusing on the wastewater pollution problem in different Chinese industrial sectors. However, there are no existing studies that analyze the management of industrial wastewater pollutants based on both the type of business generating the pollutants and the type of pollutants themselves. Technical difficulties associated with reducing the emissions of wastewater pollutants differ by industry and pollutant type. It is clear that the capital costs (equipment) and abatement costs associated with reducing wastewater pollutants differ by industry. This is because chemical products consumed as intermediate materials differ by industry. Thus, it is important for analyses to consider a range of industrial characteristics. The objective of this study is to explore how Chinese industrial sectors reduced their emissions of wastewater pollutants from 1998 to 2010. This study focuses on pollution reduction through end-of pipe treatment, cleaner production, structural changes in industry, and changes in the scale of production.
3. Data
We use four wastewater pollutant variables in this study: 1) COD; 2) petroleum; 3) cyanide and 4) volatile hydroxybenzene (volatile phenol). Reduction of these four pollutants is a high priority in the ninth and tenth Chinese five-year plans. These pollutants are also important indicators of overall wastewater quality. Furthermore, these four pollutants are involved in the Chinese levy system.
COD is a measure of the capacity of water to consume oxygen during the decomposition of organic matter and the oxidation of inorganic chemicals, such as ammonia and nitrite. COD is used to evaluate the quality of wastewater, marine water, and lake water. We can apply decomposition analysis to COD data in order to evaluate overall wastewater quality.
We also focus on three specific toxic chemical substances: petroleum, cyanide, and volatile phenol. Petroleum represents the amount of petroleum substances emitted in industrial wastewater. Petroleum emissions result from the use of intermediate oil products in production. Oil products are widely used in many industrial sectors. Therefore, we can compare results from a range of industries in order to identify differences in industrial wastewater treatment between sectors.
Cyanide includes several toxic chemical substances, such as hydrogen cyanide, kalium cyanide, cyanide sodium, calcium cyanide, vinyl cyanide, and cyanogen chloride. These toxic chemical substances are generated by chemical reactions during the use of intermediate chemical substances. Cyanide is primarily emitted in processes used to produce chemical materials and cyaniding. Cyanide is highly toxic to humans and aquatic organisms.
Volatile phenols include benzene, xylene, and toluene, all of which are common toxic chemicals in industrial wastewater. These chemical substances are also the major intermediate chemical constituents of solvents and paints. Most volatile phenol substances are generated in oil refining, chemical, and steel industries. The amount of cyanide and volatile phenol emissions depends on production processes and intermediate product usage. Therefore, we consider these characteristics in our discussion of results from cyanide and volatile phenol testing.
We used total revenue data deflated to 2010 dollars as our measure of economic performance (Y). Pollutant data was obtained from the China Environmental Yearbook (CEY) and the China Environmental Statistics Database. Data from these sources cover the thirteenyear period between 1998 and 2010, a period in which Chinese industrial sectors significantly reduced wastewater pollution (see Figure 1). This paper focuses on the following fifteen industrial sectors: 1) mining; 2) food, beverage, and tobacco (Food); 3) textiles; 4) paper, pulp, and printing (Paper and pulp); 5) coal and oil refining (Oil refining); 6) chemical and petrochemical (Chemical); 7) medicine; 8) chemical fiber; 9) rubber and plastic; 10) non-mineral materials; 11) smelting and pressing of iron and steel (steel); 12) smelting and pressing of non-ferrous metals (non-ferrous metal); 13) smelting and pressing of metal (metal); 14) machinery; and 15) the electricity industry. We also used data on total industry activity (Industrial sector) to understand overall trends in pollutant emissions and treatment. The fifteen industries included in this study account for the vast majority of wastewater pollutant emissions in Chinese industry in 2010, including COD (97% of total emissions), petroleum (99%), cyanide (99%), and volatile phenols (99%).
This study uses two variables to represent wastewater pollutant data. The first is the total release of pollution (E). The second is total pollution abatement (R). Here, we create one additional variable, representing the total amount of pollution initially generated (G). G is defined as “G = E + R”.
4. Model
There are a number of previous studies that use decomposition analysis as an analytical framework. Most of these studies focus on either energy consumption or CO2 emissions. In decomposition analysis studies, the independence of variables is important because interrelationships make interpretation of results difficult. However, identifying interrelationships can be valuable in wastewater pollutant management applications. This is because emissions of toxic chemical substances are usually managed through a balance of EOP and CP strategies. In this case, CP strategies actually determine the level of EOP treatment possible. This is because the amount of pollution available for abatement through EOP treatment depends on how much pollution was initially generated, an amount which can be reduced by CP treatments. Therefore, we must consider potential interrelationships between EOP treatments and the CP approach. To consider these problems, we propose a new decomposition application that is appropriate for wastewater pollutant management.
We apply a decomposition technique, referred to as the logarithmic mean Divisia index (LMDI), to changes in pollutant emissions; this technique was developed by Ang & Liu [14]. The LMDI is an index approach and has primarily been applied to energy studies [15]. Recently, a decomposition framework was applied to chemical pollution issues [16,17]. Ang [18] noted that LMDI is the preferred method for decomposition analysis because of its theoretical foundation, adaptability, ease of use and interpretation, and lack of a residual term. This residual term is generated by Laspeyres-type methodologies.
To decompose changes in pollutant emissions in industrial wastewater, we use four indicators: 1) end-ofpipe treatment (EOP); 2) a cleaner production approach (CP); 3) structural changes in industry (STRCH) and 4) changes in the scale of production (SCALE). We define the CP indicator as Gj/Yj, which gives wastewater pollutant generation per gross output in sector j. This indicator will decrease if, while maintaining the same volume of production, the level of wastewater pollutants generated is reduced. This reduction can be achieved through improved production processes and product designs that limit industrial wastewater pollution.
Next, the EOP indicator is defined as Ej/Gj, which gives the ratio of wastewater pollutant emissions to total generation in sector j. This indicator will decrease if the level of pollutants removed from wastewater increases as compared to total wastewater pollutant generation. Because the removal of pollution can be achieved through end-of-pipe treatment, we can understand the Ej/Gj indicator as a reflection of end-of-pipe treatment.
The STRCH indicator is defined as Yj/ΣjYj. This indicator reflects the relative degree to which wastewater pollution depends on production output in sector j. Because emissions of industrial wastewater pollutants strongly depend on the scale of production in the polluting sector, changes to industrial structures are an important determinant of changes in wastewater pollutant emissions in the time series data. The STRCH indicator represents the share of total industrial production that can attributed to sector j.
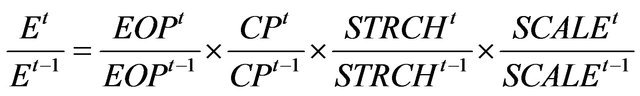
Finally, the SCALE indicator shows changes in the volume of production. This study had difficulty obtaining data on production volumes for different types of products. Therefore, total revenue (deflated to 2010 dollars) is used to represent production volume. Generally, the volume of pollutants in wastewater depends on the amount of intermediate chemical material inputs used in production processes. It is these inputs that are responsible for polluting industrial wastewater. Therefore, the scale of production is one determinant of wastewater pollutant emissions. Here, the total volume of wastewater pollutants released (E) in sector j is decomposed as Equation (1).
 (1)
(1)
We consider changes in emissions from t − 1 years (Et−1) to t years (Et). By using Equation (1), the growth ratio of emissions can be represented as follows.
 (2)
(2)
2 |
 if
if .
.Equation (3) results from transforming Equation (2) into a natural logarithmic function1.
 (3)
(3)
Multiplying both sides of Equation (3) by  , we obtain Equation (4) as follows2.
 (4)
(4)
Therefore, changes in the wastewater pollution emissions in sector j (ΔEj) can be decomposed as changes in EOP (the first term), CP (the second term), STRCH (the third term), and PSC (the fourth term). The term  operates as additive weight estimated within the LMDI framework.
5. Result and Discussion
A Tables 2-5 and Figures 2-5 display the cumulative change in wastewater pollutant emissions and the ratio calculated by the LMDI model. A positive score indicates an increase in emissions, whereas a negative score represents a decrease in emissions. The line in Figures 2-5 shows the cumulative emissions change ratio. The bars demonstrate the cumulative effect of each factor in generating changes in emissions. Both bar charts and line charts show emission change ratios compared to 1998 levels. If we compare the results in each figure, we can distinguish how different wastewater pollutant treatments impact different substances.
Each table shows the cumulative change in total emissions and ratios for 1998-2010, organized by industry and by chemical substance. ΔE represents emission change from 1998 to 2010. ΔE/E1998 shows the emission reduction ratio from 1998 to 2010 comparing with 1998 emission level. Summation of EOP, CP, STRCH, and SCALE in table is equal to ΔE/E1998.
5.1. COD Emissions
Figure 2 demonstrates that COD emissions monotonically decreased until 2003, despite production increasing over this same period. Chinese industries succeeded in reducing COD emissions by 54% between 1998 and 2010. This reduction can primarily be attributed to the effects of EOP and CP treatments. However, EOP and CP treatments were more effective at different times within this period. COD emissions were primarily reduced by EOP and STRCH in the period between 1998 and 2002. CP treatments had a greater effect in the period after 2003. Because of the severity of pollution in Chinese rivers in the late 1990s, the government was in need of an immediate strategy for reducing water pollution. The Chinese government developed a set of new and
Table 2. COD emissions by industrial sector, 1998-2010.
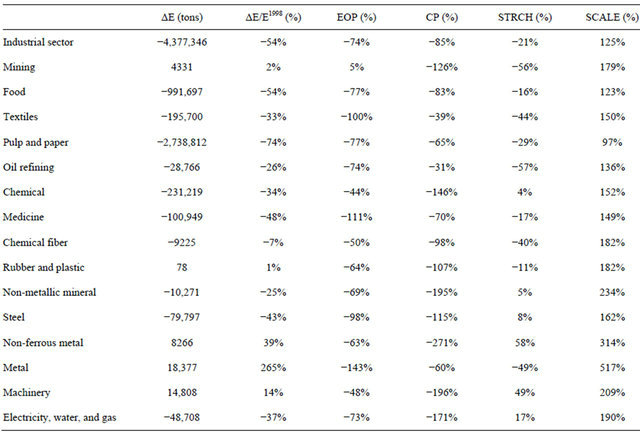
Table 3. Petroleum emissions by industrial sector.

Table 4. Cyanide emissions by industrial sector.

Table 5. Volatile phenol emissions by industrial sector.

Figure 2. Decomposition analysis results for COD emissions across all industrial sectors.
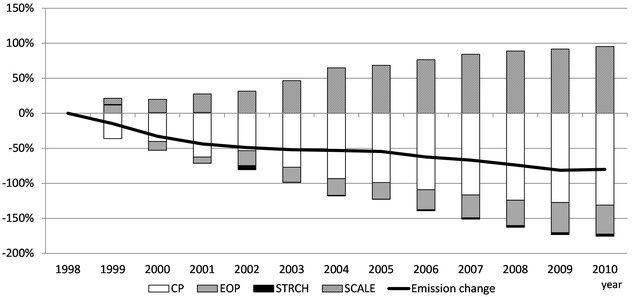
Figure 3. Decomposition analysis results for petroleum emissions across all industrial sectors.
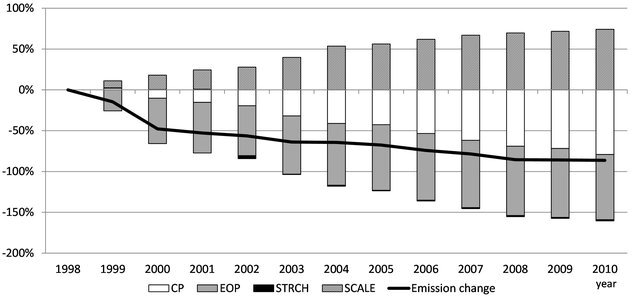
Figure 4. Decomposition analysis results for cyanide emissions across all industrial sectors.
revised environmental regulations for wastewater pollution as part of its ninth five-year plan (1996-2000). This top-down environmental policy strongly contributed to the closure of small, heavily polluting firms and encouraged the installation of EOP treatment equipment capable of reducing pollutants immediately.
Whereas top-down environmental policies were enforced in the ninth five-year plan, project-based environmental policies were a focus of the tenth five-year plan (2001-2005). In the tenth five-year plan, cleaner
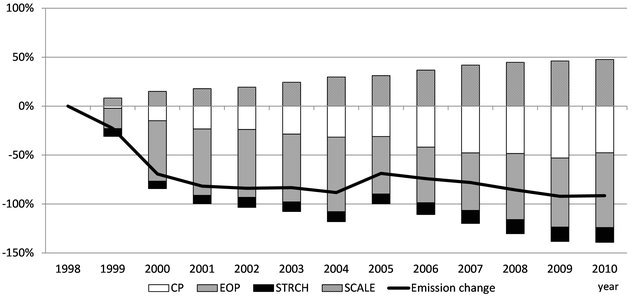
Figure 5. Decomposition analysis results for volatile phenol emissions across all industrial sectors.
production activity was promoted as a strategy to reduce COD emissions by two million tons. Additionally, the government encouraged manufacturing firms to obtain ISO 14000 certification as a way of taking a more proactive approach to environmental management in production processes. Furthermore, listed companies were required to submit environmental activity reports and environmental information reports. These new environmental policies, which focused on the management and monitoring of production processes, effectively reduced industrial COD emissions over the course of the tenth five-year plan.
Next, we consider our results by industry type. As shown in Table 2, ten industries successfully reduced their COD emissions between 1998 and 2010. During the same period, five industries increased their COD emissions. The metal industry experienced a particularly steep increase in emissions. We found that EOP treatments reduced COD emissions in all industries, particularly in the textile, medicine, and metal industries. A CP approach was more effective in decreasing emissions from non-metallic mineral, nonferrous metal, and machinery industries. The paper and pulp industry dramatically decreased its COD emissions, accounting for 62% of total industry emissions reductions. Both CP and EOP treatments contributed to a reduction of COD emissions in the paper and pulp industry.
Here, we focus on a law that began enforcing the use of cleaner production processes in January 2003. To understand the effect of this environmental policy, we conducted t-tests to investigate differences in the effects of CP strategies before and after enforcement of the cleaner production law began. From the t-test results, we found that the effects of CP programs were significantly different in Chinese industries before and after 2003 (P > |t| = 0.037). Thus, the cleaner production law was one of the catalysts for reducing COD emissions generated during production processes in Chinese industries. PSC was positive in all industrial sectors and increased total industrial COD emissions by 125% between 1998 and 2010.
5.2. Petroleum Emissions
Next, we discuss our results pertaining to petroleum emissions in China. In Figure 3, we can see that CP strategies were primarily responsible for reducing petroleum discharges between 1998 and 2010. This is because the international price of oil increased rapidly after 1998 due to reductions in crude oil production in OPEC and non-OPEC countries. The oil price in China has been linked to the international price of oil since 1998. This oil price increase offered an incentive for manufacturing firms to reduce inputs of petroleum products in order to reduce production costs. Therefore, we attribute the effects of CP programs on petroleum emissions to the influence of the market, not to environmental policy. Meanwhile, EOP treatments also contributed to emissions reductions after 2000. PSC caused emissions to increase monotonically after 1998.
Our next focus is on differences between industries. Table 3 shows a significant reduction in petroleum emissions from the mining, oil refining, chemical, steel, and machinery industries. Petroleum emissions display a different trend than COD emissions (see Table 2). While the effects of EOP treatments on COD emissions were negative in all industries except the mining industry (see Table 2), we observed a positive EOP effect on petroleum emissions in six industries in Table 3. However, the effects of CP strategies on petroleum emissions were negative, and of a smaller magnitude, than EOP effects in all industries except for the steel industry. These results indicate that petroleum emissions from all manufacturing sectors except for the steel industry were impacted more by CP treatments than by EOP treatments.
Another primary finding of this study was that there was no statistical significant difference in the effects of CP strategies on petroleum emissions before and after 2003. Thus, the cleaner production law did not contribute significantly to the management of petroleum emissions in Chinese industrial production processes. These results indicate that petroleum emissions in wastewater can be reduced successfully by CP approaches because Chinese industries can experience significant cost savings by reducing inputs of intermediate petroleum products.
5.3. Cyanide and Volatile Phenol Emissions
Here, we consider our results pertaining to cyanide and volatile phenol emissions in China. In Figure 4, we can see that both EOP and CP treatments reduced cyanide emissions between 1998 and 2010. 50% of cyanide emissions reductions occurred between 1998 and 2000. Figure 5 shows that until 2004, volatile phenol emissions decreased monotonically due to EOP treatments. Increases in emissions between 2004 and 2005 were caused by the coal and oil refining industry and the electricity industry.
Next, we look at results organized by industry type. The textile, paper and pulp, and non-ferrous metal industries display abnormal values in Table 4. This is because the cyanide emissions from these industries are not associated with specific industrial characteristics. All industries except the machinery industry successfully reduced their cyanide emissions. Changes in cyanide emissions from the chemical and steel industries accounted for 82% of total changes in industrial cyanide emissions between 1998 and 2010. Industrial cyanide emissions were reduced by a total of 86% between 1998 and 2010; this is a higher reduction than was achieved for COD and petroleum. The significant decrease in cyanide emissions was due to the mining, chemical, steel, and electricity industries (the primary industrial cyanide emitters) decreasing their emissions by more than 89%.
In Table 5, we find that all industries except the metal industry successfully decreased their volatile phenol emissions in China. Between 1998 and 2010, the paper, oil, chemical, and steel industries achieved the largest reductions. It is important to note that usage of volatile phenols differs among industries. For example, the machinery industry primarily uses volatile phenols for painting and bonding, whereas the chemical industry uses volatile phenols as both an intermediate product and for solvents. Differences in the use of volatile phenols impacts the type of emissions control required in a given manufacturing sector.
6. Conclusions
This study analyzed how different Chinese industrial sectors succeeded in reducing their emissions of wastewater pollutants between 1998 and 2010. We focused on the following four factors in emissions control: cleaner production, end-of-pipe treatment, structural changes in industry, and changes in the scale of production. We identified three key results as follows.
First, until 2002, Chinese industrial sectors primarily reduced their COD emissions by end-of-pipe treatments. In 2003, enforcement of a law promoting cleaner production began and cleaner production strategies subsequently played a larger role in COD emissions reductions. This law was found to be an environmental policy that effectively promoted reductions in COD emissions through cleaner production processes.
Second, petroleum emissions can be reduced through cleaner production. This is because rising international oil prices give the Chinese manufacturing sector an incentive to save on inputs of intermediate oil products. Reductions in inputs of intermediate petroleum products results in reductions of petroleum emissions from the Chinese manufacturing sector. Cleaner production strategies consistently contributed to reductions in petroleum emissions. These contributions showed significant differences before and after 2003.
Finally, our results pertaining to emissions of cyanide and volatile phenols differ between industries. These differences arise because cyanide and volatile phenols are used in varying ways, depending upon industrial characteristics. Furthermore, differences in production processes affect the options available for pollution management. Therefore, the government needs to consider differences in industrial characteristics between sectors when regulating the emissions of specific chemicals.
REFERENCES
- X. J. Zhang, C. Chen, J. Q. Ding, A. Hou, Y. Li, Z. B. Niu, X. Y. Su, Y. J. Xu and E. A. Laws, “The 2007 Water Crisis in Wuxi, China: Analysis of the Origin,” Journal of Hazardous Materials, Vol. 182, No. 1-3, 2010, pp. 130- 135. doi:10.1016/j.jhazmat.2010.06.006
- M. Wang, M. Webber, B. Finlayson and J. Barnett, “Rural Industries and Water Pollution in China,” Journal of Environmental Management, Vol. 86, No. 4, 2008, pp. 648-659. doi:10.1016/j.jenvman.2006.12.019
- W. Shao, “Effectiveness of Water Protection Policy in China: A Case Study of Jiaxing,” Science of the Total Environment, Vol. 408, No. 4, 2010, pp. 690-701. doi:10.1016/j.scitotenv.2009.11.019
- K, Zhang and Z. Wen, “Review and Challenges of Policies of Environmental Protection and Sustainable Development in China,” Journal of Environmental Management, Vol. 88, No. 4, 2008, pp. 1249-1261. doi:10.1016/j.jenvman.2007.06.019
- M. Frondel, J. Horbach and K. Rennings, “End-of-Pipe or Cleaner Production? An Empirical Comparison of Environmental Innovation Decisions across OECD Countries,” Business Strategy and the Environment, Vol. 16, No. 8, 2007, pp. 571-584. doi:10.1002/bse.496
- United Nations Environment Program, “Environmental Agreements and Cleaner Production,” UNEP, 2006.
- G. Kjaerheim, “Cleaner Production and Sustainability,” Journal of Cleaner Production, Vol. 13, No. 4, 2005, pp. 329-339. doi:10.1016/S0959-6526(03)00119-7
- S. X. Zeng, X. H. Meng, H. T. Yin, C. M. Tam and L. Sun, “Impact of Cleaner Production on Business Performance,” Journal of Cleaner Production, Vol. 18, No. 10-11, 2010, pp. 975-983. doi:10.1016/j.jclepro.2010.02.019
- H. Wang, “Pollution Regulation and Abatement Efforts: Evidence from China,” Ecological Economics, Vol. 41, No. 1, 2002, pp. 85-94. doi:10.1016/S0921-8009(02)00016-2
- H. Wang and D. Wheeler, “Financial Incentives and Endogenous Enforcement in China’s Pollution Levy System,” Journal of Environmental Economics and Management, Vol. 49, No. 1, 2005, pp. 174-196. doi:10.1016/j.jeem.2004.02.004
- C. Zhang, Z. Wen and J. Chen, “An Integrated Model for Technology Forecasting to Reduce Pollutant Emission in China’s Pulp Industry,” Resource, Conservation and Recycling, Vol. 54, No. 1, 2009, pp. 62-72. doi:10.1016/j.resconrec.2009.06.008
- Y. Geng, W. Xinbei, Z. Qinghua and Z. Hengxin, “Regional Initiatives on Promoting Cleaner Production in China: A Case of Liaoning,” Journal of Cleaner Production, Vo. 18, No. 15, 2010, pp. 1502-1508. doi:10.1016/j.jclepro.2010.06.028
- X. D. Diao, S. X. Zeng, C. M. Tam and V. W. Y. Tam, “EKC Analysis for Studying Economic Growth and Environmental Quality: A Case Study in China,” Journal of Cleaner Production, Vol. 17, No. 5, 2009, pp. 541-548. doi:10.1016/j.jclepro.2008.09.007
- B. W. Ang and F. L. Liu, “A New Energy Decomposition Method: Perfect in Decomposition and Consistent in Aggregation,” Energy, Vol. 26, No. 6, 2001, pp. 537-548. doi:10.1016/S0360-5442(01)00022-6
- L. Charlita de Freitas and S. Kaneko, “Decomposition of CO2 Emissions Change from Energy Consumption in Brazil: Challenges and Policy Implications,” Energy Policy, Vol. 39, No. 3, 2011, pp. 1495-1504. doi:10.1016/j.enpol.2010.12.023
- J. He, “What Is the Role of Openness for China’s Aggregate Industrial SO2 Emission? A Structural Analysis Based on the Divisia Decomposition Method,” Ecological Economics, Vol. 69, No. 4, 2010, pp. 868-886. doi:10.1016/j.ecolecon.2009.10.012
- H, Fujii and S. Managi, “Decomposition of Toxic Chemical Substance Management in three US Manufacturing Sectors from 1991 to 2008,” Journal of Industrial Ecology, (in Print). doi:10.1111/j.1530-9290.2012.00527.x
- B. W. Ang, “Decomposition Analysis for Policymaking in Energy: Which Is the Preferred Method?” Energy Policy, Vol. 32, No. 9, 2004, pp. 1131-1139. doi:10.1016/S0301-4215(03)00076-4
- B. W. Ang and F. L. Liu, “Handling Zero Values in the Logarithmic Mean Divisia Index Decomposition Approach,” Energy Policy, Vol. 35, No. 1, 2007, pp. 238- 246. doi:10.1016/j.enpol.2005.11.001
Appendix 1. A history of industrial wastewater regulation in China. 
NOTES
1Because of the properties of logarithmic functions, zero values in the dataset can cause problems in formulating decompositions. In order to solve this problem, the literature on the LMDI recommends replacing zero values with small positive numbers [19].