Journal of Environmental Protection
Vol.4 No.1(2013), Article ID:27186,8 pages DOI:10.4236/jep.2013.41009
Periphyton Biomass Response to Phosphorus Additions in an Aquatic Ecosystem Dominated by Submersed Plants
![]()
1College of Resources and Environment, Anhui Agricultural University, Hefei, China; 2Department of Ecology and Institute of Hydrobiology of Jinan University, Guangzhou, China.
Email: *wetlandxfz@163.com
Received November 10th, 2012; revised December 7th, 2012; accepted December 31st, 2012
Keywords: Periphyton; Biomass; Phosphorus; Aquatic Ecosystem; Submersed Plants
ABSTRACT
An experiment was conducted to investigate the response of periphyton biomass to addition of phosphorus (P) in an aquatic ecosystem dominated by submersed plants. Aquatic ecosystems dominated by Hydrilla verticillata (L.f.) Royle and Vallisneria natans (Lour.) Hara were constructed in mesocosm aquaria. Mesocosms were dosed weekly with different P loads (0 µg/L/Week and 100 µg/L/Week) for 17 weeks. Total P (TP), total soluble P (TSP), and soluble reactive P (SRP) concentrations in the waters of mesocosms added with P were significantly higher as opposed to the unenriched control mesocosms. The biomass of the attached periphyton and the cover of floating periphyton remained abundant in P-unenriched control mesocosms throughout the test period with a TP, TSP, and SRP concentration ranging of 0.021 - 0.049 mg/L, 0.004 - 0.024 mg/L, and 0.003 - 0.018 mg/L, respectively. P addition caused the decline of attached periphyton biomass to a low level and loss of floating periphyton. Results indicate that P enrichment in an aquatic ecosystem dominated by submersed plants could reduce attached periphyton biomass and eliminate floating periphyton. The research would be useful to maintain periphyton by reducing excessive P in aquatic ecosystem dominated by submersed plants.
1. Introduction
Attached (epiphytic) and floating (metaphytic) periphyton mats are a dominant ecological feature in many aquatic ecosystems [1]. Periphyton provides both habitat and food source for aquatic consumers, and plays a key role in nutrient cycling [1]. In addition, periphyton also influences many other features of aquatic ecosystem, as evidenced by its interactions with physiochemical environment and other biota [2,3]. Thus, changes in periphyton biomass, productivity, and taxonomic composition could affect many aspects of fresh water ecology [4,5].
Periphyton responds rapidly to changes in water quality [6]. Many studies have confirmed that the biomass of periphyton is positively correlated with total phosphorus (TP) concentration in water [7-9]. However, some studies indicate that enrichment concentrations may have little or negative effect on periphyton biomass [10-12]. For example, P fertilization did not cause any increase in epipelic production both in laboratory and actual lake conditions [9,13]. Even in large scale, losses of periphyton also occurred due to excessive P enrichment [14,15]. Thus, periphyton declines can also be strongly linked with P enrichment [14].
Decline or loss of periphyton, which could be an unusual characteristic of aquatic ecosystems subjected to P enrichment, requires further examination [18]. Meanwhile, most experimental work examining the response of periphyton merely deals with P enrichment in aquatic ecosystems dominated by none or low plant biomass [11,14,16]. Therefore, there is limited information explaining decline or loss in periphyton assemblage in relation to increases in P inputs [17,18]. Periphyton response to P additions in aquatic ecosystems dominated by submersed plants ought to be more thoroughly investigated.
The aim of the study was to evaluate the response of periphyton biomass to P enrichment in aquatic ecosystem dominated by submerged plants. Hydrilla verticillata (L.f.) Royle and Vallisneria natans (Lour.) Hara were used. These aquatic plants are among the most commonly used plants for restoration of eutrophicated lakes [19- 21]. H. verticillata is a rooted submersed species that is widely distributed [22]. V. natans, a perennial submersed plant with a wide geographical range, can be found in different freshwater habitats.
2. Material and Methods
2.1. Plant Materials
H. verticillata and V. natans were collected from Xihu Lake in Huizhou, Guangdong Province in South China, then pre-incubated at the laboratory of Jinan University for about half a year. For H. verticillata, apical shoots with a length of 20 cm were separated from the mother. For V. natans, whole plants of approximately 20 cm long were selected. Both species were washed with distilled water to remove the periphyton prior experimental use.
2.2. Set-Up of an Aquatic Ecosystem Dominated by Submersed Plants
The experiments were carried out in aquaria with the same dimensions (40 cm L × 30 cm W × 50 cm H), containing sediments and water. Sediments obtained from a lake in the suburb of Guangzhou City was air-dried then sieved (mesh size: 0.5 mm) to remove coarse debris. The mixed sediment was homogenized and added to about 10 cm in thickness in each aquarium. Aquaria were then filled to full using 55 liters lake water. This was obtained from the lake by filtering over a plankton net (mesh size: 0.064 mm) to remove both zooplankton and phytoplankton.
The plants were introduced in the aquaria on October 1, 2008. Aquaria with the submersed plants were exposed to natural sunlight with all of their sides covered with insulating material to prevent incidental light from penetrating the experimental system setup. The filtered lake water (TN 0.143 mg/L; TP 0.177 mg/L; SRP 0.013 mg/L) was added to the aquaria to maintain water level.
On May 9, 2009, all aquaria were dominated by submersed plants, thereby creating the desired aquatic ecosystem. Water from each aquarium was sampled to check similarity in some physico-chemical characteristics (nutrients) before the addition of nutrients.
2.3. Experiment Design
 was prepared and nitrogen load 2 mg/L/Week was added to each aquarium. Three of the aquaria, which served as unenriched P controls, were not added with P. The three remaining aquaria were enriched with P loading rates of 100 µg/L/Week by adding analytical grade anhydrous NaH2PO4 (hereinafter referred to as P-added treatments). The nutrients loading rate were based on the preliminary experiment in 2007 [23].
2.4. Water Sampling and Analysis
Samples for water quality analyses were collected on a weekly basis from May 9 to September 5, 2009. Water samples (500 ml) were obtained from each aquarium in the experimental system using a clean bottle.
Water quality samples were analyzed for TP, total soluble P (TSP), soluble reactive P (SRP) and chlorophyll a. TP was were analyzed after persulfate digestion [24]. Analytical methodology for TSP was the same with TP, except that the analysis was performed on filtered samples. SRP was determined using the same test on filtered (0.45 µm) but undigested samples, and measured immediately after their arrival in the laboratory. The remaining samples were acidified to pH < 2 with H2SO4 and then stored below 4˚C for TP and TSP measurement until analyzed within holding times as specified by standard methods. Chlorophyll a was determined spectrophotometrically after ethanol extraction at room temperature [25].
2.5. Periphyton Sampling and Dry Biomass
The periphyton measured on the artificial substrate was assumed to be a fair estimate of periphyton growth on submersed macrophytes [26,27]. Artificial substrates (plastic net) were used to sample periphyton. Substrates with the same size of 20 cm L × 10 cm W were suspended vertically just below the water surface in each aquarium. Every four weeks, a substrate with periphyton was taken out to assess accumulated biomass; at the same time, a new artificial substrate was placed into each aquarium. Substrates with periphyton were oven-dried to a constant weight of 80˚C and then weighed. To determine the dry weight (DW) of the periphyton biomass, the weight of the artificial substrate was subtracted from total weight (i.e., artificial substrate with periphyton).
2.6. Periphyton Coverage in Water Surface
Periphyton mats are usually attached to submersed macrophytes and/or to sediments. However, many mats can break away from their substrates and free-float because of the trapped oxygen formed during photosynthesis [28]. During the experiment, some floating (i.e., metaphytic) periphyton mats were observed at the water surface. The percent coverage of the aquaria was determined by visual assessment. Meanwhile, overhead photographs of each aquarium were taken when attached periphyton was sampled. Thus, an approximation of the coverage of the surface mats was made possible by these photographs. By the end of the experiment, all floating periphyton at the water surface was sampled by a nylon net (mesh size: 200 μm), oven-dried to constant weight of 80˚C, and then weighed.
2.7. Plant Dry Biomass
Plants were harvested and separated according to the species at the end of the experiments. Then they were washed over a 1-mm sieve to remove accumulated sediments and epiphytes. And then, they were oven-dried to constant weight at 80˚C and weighed.
2.8. Statistical Analyses
One-way ANOVA was performed to detect differences of P concentration, periphyton and submersed plant biomass under different enrichments. For all analyses, the significance level was α = 5%. All results were presented as the mean ± SD.
3. Results
3.1. P Concentration in Water
On May 9, the TP, TSP, and SRP concentration in the water of the unenriched control mesocosms were 0.021 ± 0.010 mg/L, 0.014 ± 0.006 mg/L, and 0.001 ± 0.000 mg/L, respectively (Figures 1-3). In the P-added mesocosms, prior the addition of P, the concentrations were 0.027 ± 0.007 mg/L, 0.017 ± 0.005 mg/L, and 0.001 ± 0.000 mg/L, separately (Figures 1-3). There was no significant difference (p > 0.05) between the two treatments.
After nutrients were added (after May 9), the TP, TSP, and SRP water concentrations of the unenriched control mesocosms showed similar trends (Figures 1-3). Concentrations changed slowly at low levels with time, ranging of 0.021 - 0.049 mg/L, 0.004 - 0.024 mg/L, and 0.003 - 0.018 mg/L with averages of 0.028 ± 0.007 mg/L, 0.013 ± 0.005 mg/L, and 0.009 ± 0.005 mg/L for TP, TSP, and SRP, respectively. In the P-added mesocosms, the TP, TSP, and SRP concentrations showed similar trends (Figures 1-3). Concentrations increased at high levels with time, in a range of 0.038 - 0.089 mg/L, 0.030 - 0.071 mg/L, and 0.012 - 0.055 mg/L with averages of 0.071 ± 0.015 mg/L, 0.050 ± 0.014 mg/L, and 0.034 ± 0.010 mg/L for TP, TSP, and SRP, respectively. TP concentrations in the water of P-added mesocosms were significantly higher (p < 0.05) compared with unenriched control mesocosms. The same result was also found for TSP and SRP.
3.2. Dry Biomass of Attached Periphyton
Both in the control and in the P-added mesocosms, the dominant species of attached periphyton was Rhizoclonium hieroglyphicum, Spirogyra sp. For the unenriched control mesocosms, the monthly accumulation of dry biomass of attached periphyton on the artificial substrate quickly increased during the first two sampling dates, peaking at the second sampling time, and remaining relatively constant for the remainder of the study period (Figure 4).
The dry biomass of attached periphyton increased from 29.500 ± 9.214 g/m2 in the first sampling date to 71.867 ± 12.097 g/m2 in the second sampling time, stabilizing at this high level with an average of 57.163 ± 19.449 g/m2. Meanwhile, for the P-added mesocosms, the dry biomass of the attached periphyton increased quickly and peaked in the first sampling date with a dry biomass of 33.433 ± 14.289 g/m2, decreasing to a very low level at around 4.483 ± 0.973 g/m2, and then stabilizing at this low level at an average of 4.078 ± 0.875 g/m2 for the last three sampling times (Figure 4). Except on June 6, the biomass of the periphyton was significantly lower (p < 0.05) in the P-added mesocosms com-
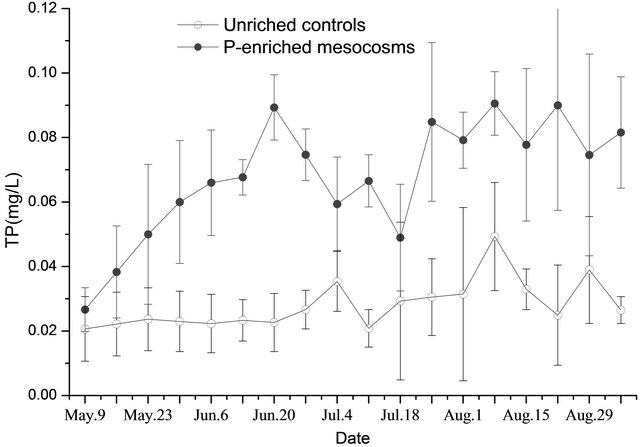
Figure 1. TP in water (triplicate, mean ± SD) of unenriched control and P-enriched mesocosms.
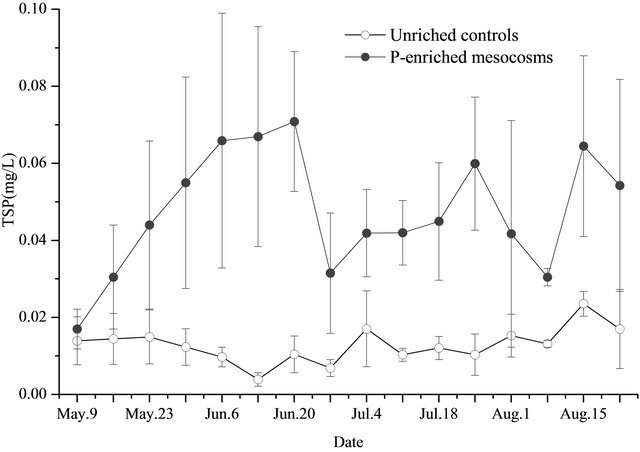
Figure 2. TSP in water (triplicate, mean ± SD) of unenriched control and P-enriched mesocosms.
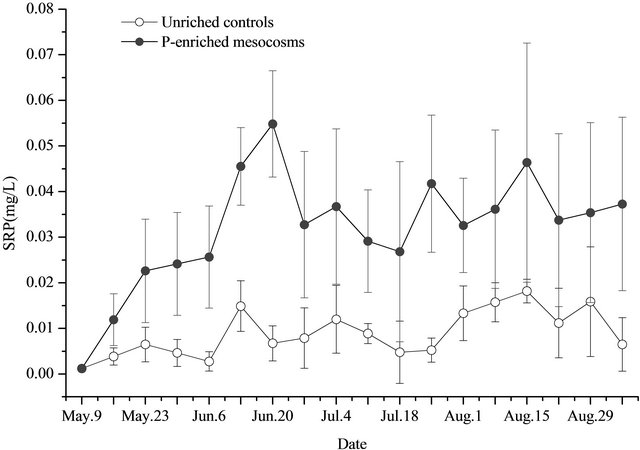
Figure 3. SRP in water (triplicate, mean ± SD) of unenriched control and P-enriched mesocosms.
pared with the unenriched control mesocosms.
3.3. Floating Periphyton Coverage and Biomass
Some periphyton (dominated by Rhizoclonium hieroglyphicum, Cladophora oligoclona, Spirogyra sp.) were observed floating at the water surface in the unenriched control mesocosms on June 6. As the experiment progressed, surface mats coverage increased quickly from 11.7% ± 7.6% (June 6) to 63.3% ± 20.2% (August 29) (Figure 5). At the end of the experiment (August 29), the weight of floating periphyton was 55.880 ± 16.108 g/m2. In unenriched mesocosmos, only on June 6 some periphyton was observed at the water surface measuring about 3.7% ± 1.5% (Figure 5); this later disappeared until no periphyton were present in the P-added mesocosms.
4. Discussion
This study indicates that periphyton biomass may decrease or disappear in response to P additions in aquatic ecosystem dominated by submersed plants. However,
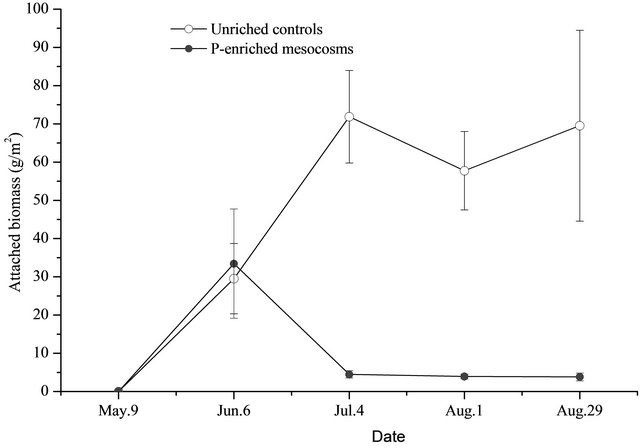
Figure 4. Attached biomass (DW, triplicate, mean ± SD) in unenriched control and P-enriched mesocosms.
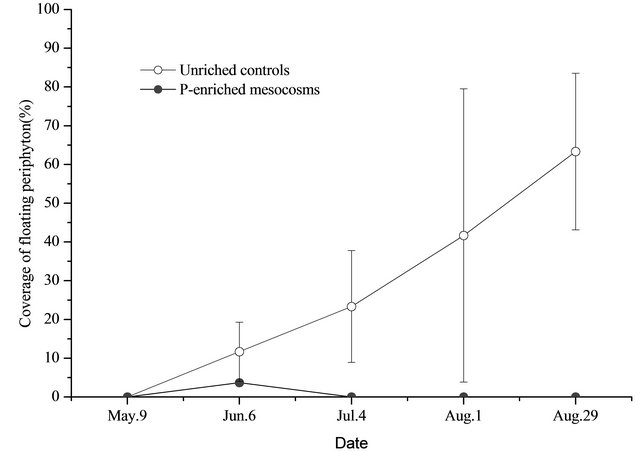
Figure 5. Percent cover of floating periphyton (triplicate, mean ± SD) in unenriched control and P-enriched mesocosms.
opinions on the loss mechanisms of matrix periphyton subjected to P enrichment were controversial [15]. Some researchers believe that the decline in periphyton biomass in response to nutrient enrichment could be attributed to increased phytoplankton biomass and the consequent inhibition of periphyton growth through shading [29]; others suggest the loss of substrate (i.e., death of submersed plants additionally induced with P) available for the attaching periphyton [30]. Meanwhile, others claim that P enrichment may stimulate the growth of other algae and bacteria within periphyton, which could also reduce mat growth through competition or other inhibitory interactions (e.g., allelopathy and lytic bacteria) [14]. Some believe that P enrichment has increased macrophyte growth, which in turn has caused a corresponding decline in periphyton biomass, productivity [31]. However, in the present experiment, the concentration of phytoplankton was not higher in the P-added mesocosms compared with the unenriched control mesocosms (Figure 6). Similarly, low attached periphyton biomass and floating periphyton eliminated in the P-added mesocosms could not be explained by competetion for nutrients or
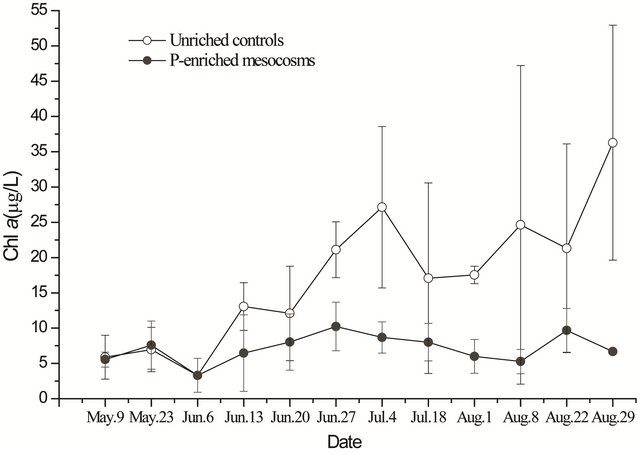
Figure 6. Chl-a concentration in water (triplicate, mean ± SD) of unenriched control and P-enriched mesocosms.
light with macrophytes because of higher water P concentrations in the P-added mesocosms. In addition, no plant died and no significantly difference (p > 0.05) was found of the plant biomass in the P-added mesocosms (185.875 ± 4.208 g/m2) compared with the unenriched control mesocosms (175.225 ± 6.475 g/m2). Moreover, in the present study, the cover of floating periphyton was never greater in P enrichment treatment, as compared with the unenriched control mesocosms.
In addition, Ini u concentration for s lower than the , U nimodal relationships between periphyton and TP in shallow lakes were found by researchers [32-34]. Periphyton biomass would increase with the P enrichment when the nutrient gradient was below the optimal concentration for growth [34]. Whereas, when the water P concentrations exceeded a certain level, the decline of periphyton would occur. In the present study, the decline or loss of periphyton in the P-added mesocosms may indicate that the P exceeds a threshold (optimal concentration) in maintaining mat integrity. Though, the exact threshold of P for periphyton growth was not found in the study, the optimal concentration varies in different aquatic ecosystems [34]. For example, in littoral zone of Lake Okeechobee, Havens et al. (1999) documented the decline of periphyton assemblage in response to P loads of 2.8 g/m2/yr [35]. While, in Everglades (south of Florida), loads of P at 1.2 g/m2/yr was expected to gradually eliminate periphyton [36].
Though, the loss mechanisms of the periphyton subjected to P enrichment was not clear [15], the existed threshold (optimal concentration) of P in determining periphyton may be one reason. Loss of periphyton, or enhanced periphyton growth would markedly alter many aspects of fresh water ecology. Under the background of human activity has profoundly altered the global biogeochemical cycle of P, and has enhanced P loading to the world’s aquatic ecosystems. Elevated concentrations of P are likely to lead to significant variation of periphyton in shallow aquatic ecosystems. Therefore, greater attention should be given to P when assessing the effects of P loading on periphyton in shallow aquatic ecosystems. Thus, the research would be helpful to maintain periphyton by reducing excessive P in aquatic ecosystems dominated by submersed plants.
In conclusion, periphyton biomass decreases in response to P additions in aquatic ecosystem dominated by submersed plants.
5. Acknowledgements
This research was sponsored by National Natural Science Foundation of China (31100339), the State Key Development Program of Basic Research of China (2008CB- 418104) and the Special Program of China Postdoctoral Science Foundation (No. 2012T50494).
REFERENCES
- P. V. McCormick, R. B. E. Shuford III, J. G. Backus and W. C. Kennedy, “Spatial and Seasonal Patterns of Periphyton Biomass and Productivity in the Northern Everglades, Florida, USA,” Hydrobiologia, Vol. 362, No. 1-3, 1998, pp. 185-208. doi:10.1023/A:1003146920533
- G. L. Phillips, D. Eminson and B. Moss, “A Mechanism to Account for Macrophyte Decline in Progressively Eutrophicated Freshwaters,” Aquatic Botany, Vol. 4, No. 2, 1978, pp. 103-126.
- J. I. Jones, J. O. Young, J. W. Eaton and B. Moss, “The Influence of Nutrient Loading, Dissolved Inorganic Carbon, and Higher Trophic Levels on the Interaction between Submerged Plants and Periphyton,” Journal of Ecology, Vol. 90, No. 1, 2002, pp. 12-24. doi:10.1046/j.0022-0477.2001.00620.x
- W. K. Dodds, “The Role of Periphyton in Phosphorus Retention in Shallow Freshwater Aquatic Systems,” Journal of Phycology, Vol. 39, No. 5, 2003, pp. 840-849. doi:10.1046/j.1529-8817.2003.02081.x
- S. T. Larned, “A Prospectus for Periphyton: Recent and Future Ecological Research,” Journal of the North American Benthological Society, Vol. 29, No. 1, 2010, pp. 182- 206.
- E. E. Gaiser, “Periphyton as an Indicator of Restoration in the Florida Everglades,” Ecological Indicators, Vol. 9, No. 6, 2009, pp. 37-45. doi:10.1016/j.ecolind.2008.08.004
- P. M. Bolas and J. W. G. Lund, “Some Factors Affecting the Growth of Cladophora glomerata in the Kentish Stour,” Proceedings of the Society for Water Treatment and Examination, Vol. 23, No. 1, 1974, pp. 25-51.
- A. Cattaneo, “Periphyton in Lakes of Different Trophy,” Canadian Journal of Fisheries and Aquatic Sciences, Vol. 44, No. 2, 1987, pp. 296-303. doi:10.1139/f87-038
- Y. Vadeboncoeur and A. D. Lodge, “Periphyton Production on Wood and Sediment: Substratum-Specific Response to Laboratory and Whole-Lake Nutrient Manipulations,” Journal of the North American Benthological Society, Vol. 19, No. 1, 2000, pp. 68-81. doi:10.2307/1468282
- P. J. Mulholland and A. D. Rosemond, “Periphyton Response to Longitudinal Nutrient Depletion in a Woodland Stream: Evidence of Upstream-Downstream Linkage,” Journal of the North American Benthological Society, Vol. 11, No. 4, 1992, pp. 405-419. doi:10.2307/1467561
- J. L. Greenwood and A. D. Rosemond, “Periphyton Response to Long-Term Nutrient Enrichment in a Shaded Headwater Stream,” Canadian Journal of Fisheries and Aquatic Sciences, Vol. 62, No. 9, 2005, pp. 2033-2045. doi:10.1139/f05-117
- M. J. Bowes, J. T. Smith, J. Hilton, M. M. Sturt and P. D. Armitage, “Periphyton Biomass Response to Changing Phosphorus Concentrations in a Nutrient Impacted River: A New Methodology for Phosphorus Target Setting,” Canadian Journal of Fisheries and Aquatic Sciences, Vol. 64, No. 2, 2007, pp. 227-238. doi:10.1139/f06-180
- A. N. D. Giorgi, “Response of Periphyton Biomass to High Phosphorus Concentrations in Laboratory Experiments,” Bulletin of Environmental Contamination and Toxicology, Vol. 55, No. 6, 1995, pp. 825-832. doi:10.1007/BF00209460
- P. V. McCormick, M. B. O’Dell, R. B. E Shuford III, J. G. Backus and W. C. Kennedy, “Periphyton Responses to Experimental Phosphorus Enrichment in a Subtropical Wetland,” Aquatic Botany, Vol. 71, No. 2, 2001, pp. 119- 139. doi:10.1016/S0304-3770(01)00175-9
- E. E. Gaiser, D. L. Childers, R. D. Jones, J. F. Richards, L. J. Scinto and J. C. Trexler, “Periphyton Responses to Eutrophication in the Florida Everglades: Cross-System Patterns of Structural and Compositional Change,” Limnology and Oceanography, Vol. 51, No. 1, 2006, pp. 617- 630. doi:10.4319/lo.2006.51.1_part_2.0617
- L. G. Goldsborough and G. G. C. Robinson, “Pattern in wetlands,” In: R. J. Stevenson, M. L. Bothwell and R. L. Lowe, Eds., Algal Ecology: Freshwater Benthic Ecosystems, Academic Press, New York, 1996, pp. 77-117.
- P. V. McCormick, R. S. Rawlick, K. Lurding, E. P. Smith and F. H. Sklar, “Periphyton-Water Quality Relationships along a Nutrient Gradient in the Northern Florida Everglades,” Journal of the North American Benthological Society, Vol. 15, No. 4, 1996, pp. 433-439. doi:10.2307/1467797
- P. V. McCormick and M. B. O’Dell, “Quantifying Periphyton Responses to Phosphorus in the Florida Everglades: A Synoptic-Experimental Approach,” Journal of the North American Benthological Society, Vol. 15, No. 4, 1996, pp. 450-468. doi:10.2307/1467798
- G. S. Wheeler and T. D. Center, “The Influence of Hydrilla Leaf Quality on Larval Growth and Development of the Biological Control Agent Hydrellia pakistanae (Diptera: Ephydridae),” Biological Control, Vol. 7, No. 1, 1996, pp. 1-9. doi:10.1006/bcon.1996.0056
- D. R. Qiu, Z. B. Wu, B. Y. Liu, J. Q. Deng, G. P. Fu and F. He, “The Restoration of Aquatic Macrophytes for Improving Water Quality in a Hypertrophic Shallow Lake in Hubei Province, China,” Ecological Engineering, Vol. 18, No. 2, 2001, pp. 147-156. doi:10.1016/S0925-8574(01)00074-X
- Y. H. Xie, S. Q. An, X. Yao, K. Y. Xiao and C. Zhang, “Short-Time Response in Root Morphology of Vallisneria natans to Sediment Type and Water-Column Nutrient,” Aquatic Botany, Vol. 81, No. 1, 2005, pp. 85-96. doi:10.1016/j.aquabot.2004.12.001
- J. F. Shearer, J. G. Michael and G. M. Dwilette, “Nutritional Quality of Hydrilla verticillata (L.f.) Royle and Its Effects on a Fungal Pathogen Mycoleptodiscus terrestris (Gerd.) Ostazeski,” Biological Control, Vol. 41, No. 2, 2007, pp. 175-183. doi:10.1016/j.biocontrol.2007.02.003
- X. F. Zhang, “Effects of Competitive Interactions of Different Life Forms Submersed Plants on Biomass Allocation in Shallow Lake,” Ecological Economy, Vol. 6, No. 3, 2010, pp. 295-299.
- American Public Health Association, “Standard Methods: For Examination of Water and Wastewater,” 18th Edition, American Public Health Association, 1992.
- A. M. Jespersen and K. Christoffersen, “Measurements of Chlorophyll a from Phytoplankton Using Ethanol as Extraction Solvent,” Archiv für Hydrobiologie, Vol. 109, No. 3, 1987, pp. 445-454.
- E. Roberts, J. Kroker, S. Korner and A. Nicklisch, “The Role of Periphyton during the Recolonization of a Shallow Lake with Submerged Macrophytes,” Hydrobiologia, Vol. 506, No. 1-3, 2003, pp. 525-530.
- A. Poulíčková, P. Halšer, M. Lysáková and B. Spears, “The Ecology of Freshwater Epipelic Algae: An Update,” Phycologia, Vol. 47, No. 5, 2008, pp. 437-450. doi:10.2216/07-59.1
- J. A. Browder, P. J. Gleason and D. R. Swift, “Periphyton in the Everglades: Spatial Variation, Environmental Correlates, and Ecological Implications,” In: S. M. Davis and J. C. Ogden, Eds., Everglades: The Ecosystem and Its Restoration, St. Lucie Press, Florida, 1994, pp. 379-384.
- K. Sand-Jensen and J. Borum, “Interactions among Phytoplankton, Periphyton, and Macrophytes in Temperate Freshwaters and Estuaries,” Aquatic Botany, Vol. 41, No. 1-3, 1991, pp. 137-175. doi:10.1016/0304-3770(91)90042-4
- K. K. Steward and W. H. Ornes, “Assessing a Marsh Environment for Waste Water Renovation,” Journal of Water Pollution Control Federation, Vol. 47, No. 7, 1975, pp. 1880-1891.
- H. J. Grimshaw, R. G. Wetzel, M. Brandenburg, M. Segerblom, L. J. Wenkert, G. A. Marsh, W. Charnetzky, J. E. Haky and C. Carraher, “Shading of Periphyton Communities by Wetland Emergent Macrophytes: Decoupling of Algal Photosynthesis from Microbial Nutrient Retention,” Archiv für Hydrobiologie, Vol. 139, No. 1, 1997, pp. 17-21.
- S. Lalonde and J. A. Downing, “Epiphyton Biomassis Related to Lake Trophic Status, Depth, and Macrophyte Architecture,” Canadian Journal of Fisheries and Aquatic Sciences, Vol. 48, No. 11, 1991, pp. 2285-2291. doi:10.1139/f91-268
- L. A. Hansson, “Factors Regulating Periphytic Algal Biomass,” Limnology and Oceanography, Vol. 37, No. 2, 1992, pp. 322-328. doi:10.4319/lo.1992.37.2.0322
- L. Liboriussen and E. Jeppesen, “Structure, Biomass, Production and Depth Distribution of Periphyton on Artificial Substratum in Shallow Lakes with Contrasting Nutrient Concentrations,” Freshwater Biology, Vol. 51, No. 1, 2006, pp. 95-109. doi:10.1111/j.1365-2427.2005.01481.x
- K. E. Havens, T. L. East, A. J. Rodusky and B. Sharfstein, “Littoral Periphyton Responses to Nitrogen and Phosphorus: An Experimental Study in a Subtropical Lake,” Aquatic Botany, Vol. 63, No. 3-4, 1999, pp. 267-290. doi:10.1016/S0304-3770(98)00121-1
- C. Chiang, C. B. Craft, D. W. Rogers and C. J. Richardson, “Effects of Four Years of Nitrogen and Phosphorus Addition on Everglades Plant Communities,” Aquatic Botany, Vol. 68, No. 1, 2000, pp. 61-78. doi:10.1016/S0304-3770(00)00098-X
NOTES
*Corresponding author.