Journal of Environmental Protection
Vol. 3 No. 12 (2012) , Article ID: 26032 , 7 pages DOI:10.4236/jep.2012.312185
Contribution of Soil Lead to Blood Lead in Children: A Study from New Orleans, LA
![]()
1Department of Environmental Toxicology, The Institute of Environmental and Human Health, Texas Tech University, Lubbock, USA; 2TraceAnalysis, Incorporated, Lubbock, USA; 3US Army Engineer Research and Development Center, Vicksburg, USA; 4#USDA Wind, Erosion, and Water Conservation Research Unit, Lubbock, USA; 5Department of Plant and Soil Science, Texas Tech University, Lubbock, USA; 6Department of Environmental Science, Baylor University, Waco, USA.
Email: *Robert.Lascano@ars.usda.gov
Received September 26th, 2012; revised October 31st, 2012; accepted November 24th, 2012
Keywords: Metals; Lead; New Orleans; Exposure Model
ABSTRACT
In recent years, a significant number of environmental studies have been conducted in New Orleans, LA and surrounding Gulf Coast areas due in part to the occurrence of hurricanes Katrina and Rita. Data collected from studies in the New Orleans area indicate that inorganic contaminants including arsenic (As), iron (Fe), lead (Pb), and vanadium (V); high concentration of bioaerosols, particularly Cladosporium and Aspergillus, and several organic pollutants (PAHs, pesticides, and volatiles) may pose a risk to human health in New Orleans. While many of these results resemble historical data, a current quantitative exposure assessment has not been conducted. We engaged in one such assessment for lead (Pb) contamination in surface soils. We used Pb concentrations in surface soils (<5 cm deep) from New Orleans and quantitative data on soil ingestion using the USEPA terrestrial wildlife model to imitate lifestyle movement (e.g., school to home to daycare) to estimate child exposure to Pb contributed by soil. Our results suggest that Pb exposure from soil could range from 1.4 µg/day to 102 µg/day for our study area within urban New Orleans. These data are concerning because children exposed to >33.5 µg/d Pb may cause their blood-Pb levels to exceed the Centers for Disease Control and Prevention (CDC) threshold for blood-Pb of 10 µg/dL. It has generally been accepted that a more protective blood Pb concentration threshold of 6 µg/dL is warranted. Using the 6 µg/dL threshold puts children exposed to as little as 20.2 µg/day Pb at risk.
1. Introduction
Recent observations within the United States show that blood-lead (Pb) concentrations in children have been reduced over the past two decades [1]. Nonetheless, the portion of the population adversely affected from Pb poisoning remains elevated, especially in urban and industrial areas [2]. Lead persistence is partially due to widespread use, making the element ubiquitous in surface soils. Despite the United States Environmental Protection Agency (USEPA) mandating the elimination of Pb from most products (e.g., paint, gasoline, etc.) the historical overuse of the element continues to make it problematic in surface soils. Lead is most prevalent throughout urban areas and concentrations of Pb in soil typically increase with the age of a city [3]. It has been determined that children are the most sensitive portion of the population to Pb poisoning and typically have an increased soil consumption rate as compared to the population as a whole. Because soil is considered a likely route for Pb exposure, it is of interest to calculate the contribution that soil has on Pb concentration in children’s blood. In fact, research suggests that blood-Pb concentrations are strongly correlated to Pb concentrations in soil [3-5].
Human exposure and health effects caused by Pb have been meticulously studied and are well documented [3-6]. Studies suggest Pb exposure in children will cause a decrease in cognitive skills including attention deficit hyperactivity disorder (ADHD). Measured intelligence (IQ) has been correlated with blood-Pb concentrations in several studies. It is now believed that the blood-Pb threshold established by the Center for Disease Control (CDC) of 10 µg/dL does not provide adequate protection from developmental effects caused by Pb [7]. Studies have demonstrated that when average Pb concentrations in blood exceed 6 µg/dL, higher-level thinking (IQ > 125) is improbable [7,8]. Subsequent studies have concluded that Pb concentration in blood has no apparent lower bound threshold in regards to impairment of neurological development [1]. Other organs affected by Pb include the kidney, the gastrointestinal tract, and the cardiovascular, hematopoietic, endocrine, immune and skeletal systems. Initial effects of Pb are also recognized in the protoporphyrin cycle with the inhibition of δ-aminolevulinic dehydratase (ALAD) [3,4].
Most health care providers and laboratories are required to report elevated blood-Pb concentrations to an appropriate regional health department [8]. While many cities have reported the occurrence of children’s bloodPb concentrations >10 µg/dL, several cities potentially have blood-Pb epidemic problems both in the United States and abroad. New Orleans, LA, New York City, NY, Chicago, IL, Baltimore, MD, Shanghai, China, Moscow, Russia and Mexico City, Mexico all had an elevated occurrence of blood-Pb concentrations >10 µg/dL (>12%). Research suggests that prior to hurricanes Katrina and Rita, as much as 30% of the children in New Orleans, LA had a blood-Pb concentration >10 µg/dL. Mielke et al. [5] provided a detailed spatial distribution of soil-Pb concentrations from the New Orleans area and demonstrated that soil-Pb was a strong predictor of blood-Pb for those results.
Following hurricanes Katrina and Rita, several government agencies and academic institutions, including United States Geological Survey (USGS), United States Environmental Protection Agency (USEPA), United States Army Corps of Engineers (USACE), Louisiana State University (LSU), Tulane University (TU), University of Missouri-Rolla, and Texas Tech University (TTU), evaluated the environmental impact of the hurricanes on New Orleans, LA [9-16]. Each institution reported elevated occurrences of Pb in soil, sediment, or water. Abel et al. [17] developed a spatial distribution model from data, which strongly correlates with the spatial distribution map that Mielke et al. [5] created before the hurricanes. These data suggest that floodwaters in New Orleans from hurricanes Katrina and Rita did not change the distribution profile of Pb in soil. Lead concentrations in New Orleans soil ranged from 7.7 µg/g to 8550 µg/g, 15% of the values exceeded the USEPA threshold criterion for Pb remediation [18,19].
In an effort to reduce Pb concentrations in children’s blood from the New Orleans area, it is critical to determine the contribution of Pb in soil to blood-Pb concentrations in children. An important aspect of this process is to use human activity data to understand and predict land usage. In exposure modeling, it is important to establish cohorts that subdivide activity patterns for both external and individual considerations. While research has defined adult human activity, children activity patterns are more challenging due to insufficient data. Few databases exist that explain spatial and temporal activities of children, especially children ages 1 to 4 years, who are the most sensitive to Pb exposure. Exposure of children to environmental contaminants in soil is often greater than that of adults due to their hygienic and activity habits. Most activity data for children can be obtained from the Consolidated Human Activity Database (CHAD) developed by the USEPA; however, CHAD still lacks essential cohorts for many activities [20-22]. CHAD suggests that children spend a majority of their time in three microenvironments: home, childcare or school, and parks. Due to this pattern the use of a wildlife model to determine ingestion rates was considered to give more reasonable prediction of the activities in these microenvironments resembling the movement of wildlife more than adult human activity.
Our goal was to use a spatial distribution contour map constructed from environmental Pb concentrations collected from New Orleans after hurricanes Katrina and Rita and survey data for child activity from CHAD in conjunction with established soil ingestion rates for children using the USEPA terrestrial wildlife model to predict Pb exposure from soil in New Orleans, LA. Risk associated from Pb absorption determined from available Pb fraction in soil was calculated using an established elimination rate.
2. Methods
Multiple data sets were used to construct our exposure assessment model. First, we obtained estimated Pb concentrations in surface soil from our spatial distribution map [17]. Second, we used CHAD to estimate outdoor activities for children ages 1 to 4 years [20,22]. Third, soil ingestion rates for children ages 1 to 4 years were taken from a study done in Anaconda, MT [23]. Finally, we incorporated these data into a modified terrestrial soil exposure model [24,25]. The output from the model was used to calculate Pb concentrations contributed by soil in children’s blood.
To obtain environmentally relevant Pb concentrations, multiple soil samples from New Orleans were collected and sent to Trace Analysis, Inc. (Lubbock, TX.) for analysis. Samples were prepared using US EPA method 3050 B and analyzed according to US EPA method 6010 B [26-29]. A thorough explanation of the sampling, preparation, analysis, reporting and moisture-corrected results are available in Abel et al. [14]. To expand the data set, we included the Pb concentration data collected by Suedel et al. [16] from Violet Marsh, an undeveloped area directly northeast of the ninth ward, with our Pb concentration data from metropolitan New Orleans to create a more thorough spatial distribution map. A spatial distribution map was developed using Pb concentrations in soil and incorporating them into GS+ version 7 (Gamma Design Software, Plainwell, MI; GS+), a GIS mapping software program. Prior to being mapped spatially, each data point converted exponentially and interpolated by kriging by the software. The exposure model was interpreted after the Pb concentrations were back transformed from the GS+ output. Since studies have shown that Pb is stable in a natural soil environment potential health effects can be modeled without making further assumptions [6].
To model childhood Pb exposure that can be attributed to soil, we modified the USEPA soil ingestion model for terrestrial wildlife [30]. Two notable changes were made to the model. First, children’s activities are believed to occur in microenvironments; therefore, home range variables were replaced with a series of likely locations for children’s outdoor activities. Secondly, we were only concerned with Pb exposure; therefore, multi-contaminant variables were eliminated from the model.
The exposure model follows:
where, Ei = total Pb exposure attributable to soil ingestion, J = the location of each microenvironment, m = total number of microenvironments being modeled, tj = time spent outside per day at microenvironment “j”, T = the total time spent outside per day, Ir = the child ingestion rate of soil, and Cj = the soil concentration of Pb at microenvironment “j”.
To model child exposure to soil Pb concentrations from New Orleans, human activity data were incorporated to predict how children are exposed to soil [20,21]. The limited, existing data confirm that children ages 1 to 4 years spend a substantial amount of time outdoors. Even though it is obvious that indoor dust and mucociliary clearance of inhaled particles can contribute to soil ingestion exposure, it is believed that the main source of soil ingestion is attributed to outdoor hand to mouth activities [31]. Children ages 1 to 4 spend a majority of their time in three defined locations: home, childcare/school, and parks, according to CHAD. To ensure public health a 7-km2 area with the highest concentration of Pb was selected from the Bywater district for modeling (Figure 1). The three microenvironments children frequent were assessed through the model. Universal Transverse Mercator (UTM) coordinates were obtained for 483 homes, 17 childcare facilities, and 6 parks and playgrounds existing in the 7-km2 area. The spatial distribution map was used to cross-reference Pb concentrations with the established UTM coordinates.
The USEPA default exposure factors and quantitative
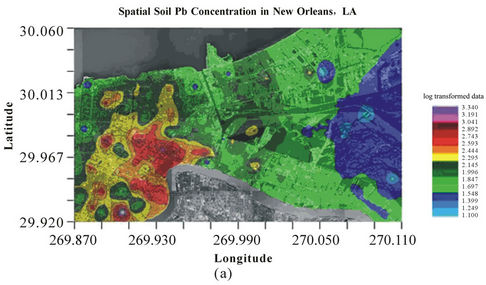
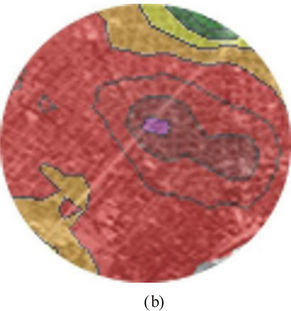
Figure 1. (a) Log transformed Pb concentrations for New Orleans, LA. (Infrared orthrophoto provided courtesy of the Louisiana Oil Spill Coordinator’s Office) and (b) Study area in the Bywater District of New Orleans, LA.
data obtained from the Anaconda smelter study in Montana were used to make soil ingestion predictions [23]. The USEPA established soil ingestion model provides a sufficient margin of safety. The default value for soil ingestion given by the USEPA is 114-mg/kg body weight/ day. Other soil ingestion models obtained from quantitative data instead of being theoretically derived provide much smaller consumption estimates. Reliable soil ingestion estimates for children are difficult to establish due to the variability of ingestion behavior. The Anaconda study calculated that the 25th, median, 75th, 90th and 95th percentile mean ingestion rates of children ages 1 to 4 years over a 7 day period were: 7 mg/day, 16 mg/day, 72 mg/day, 151 mg/day, and 160 mg/day, respectively [23]. All ingestion rates were incorporated into our model to provide a margin of safety and a more probabilistic exposure.
We incorporated one location for each of three different microenvironments from a 7-km2 area into our exposure assessment model. Every possible combination of these led to 49,266 iterations for each soil ingestion assumption. The model calculated the maximum, minimum, average, and median daily Pb exposure rates.
The available soil Pb fraction is biologically significant. We attempted to determine the portion of soil-Pb in New Orleans that children might absorb by exposure using a subset consisting of 20 samples from our original sample set. From these 20 samples, four fractions were determined: available, reducible, oxidizable, and residualsoil-Pb, (Figure 2) as explained in Pueyo et al. [32]. The available fraction is the most critical fraction when determining human toxicity from consumption. Each fraction was recovered in similar ranges with a standard deviation of less than 0.055. The error bars in Figure 2 represent the range (min/max) of the soil-Pb fraction. To model the soil contribution to blood-Pb concentrations in children the available fraction of the total soil-Pb content was used. We assumed 9.3% available Pb, the largest available fraction from our subset, to be protective of human health.
An established blood-Pb elimination half-life of 20.3 days was used to determine Pb concentrations in children’s blood [3,4]. Blood volume in toddlers ages 1 to 4 will vary widely but can be assumed to be 100 mL per kg of body weight [24]. We assumed a blood volume of 1.0 liter to model blood-Pb concentrations in children for this study. From these values a blood-Pb equilibrium was generated assuming constant consumption of soil. The blood-Pb equilibrium was cross-referenced with the CDC limit of 10 µg/dL and the Lowest Observable Effect Level (LOEL) of 6 µg/dL [7,8]. Possible risk scenarios were determined comparing these values to those that were calculated.
3. Results
Spatial distribution of Pb was determined using 137 data points from New Orleans and Violet Marsh areas. Soil was characterized for Pb in a 7-km2 area of the Bywater district centered at Interstate Highway 10 and Saint Bernard Ave. Lead concentrations were evaluated for 17 childcare facilities, 6 parks and playgrounds, and 483 individual homes resulting with a geometric mean of 355 µg/g, 301 µg/g, and 348 µg/g, respectively. While the averages were similar, Pb concentrations within the three microenvironmentsvariedwidely. Childcare facilities had Pb concentrations ranging from 172 µg/g to 647 µg/g. Lead concentrations ranged from 192 µg/g and 426 µg/g at parks and playgrounds. Home sites had the widest distribution of Pb ranging from 68.5 µg/g to 832 µg/g. These variations in soil-Pb concentrations can lead to extremely different exposure profiles, even within our small 7-km2 study area.
The USEPA’s protective soil ingestion rate of 114 mg/kg body weight/day yields a Pb exposure between 139 µg/day and 817 µg/day for a 10 kg child [19]. This ingestion rate would predict a long-term contribution to blood-Pb from soil of 38.5 µg/dL to 226 µg/dL for an assumed blood volume of 1.0 liter. Quantitative data suggest that the USEPA soil ingestion model is overly conservative. Mean soil ingestion rates established by Stanekand Calabrese [23] at the Anaconda, MT site infers a maximum soil ingestion rate of 283 mg/day, far less than USEPA’s assumption. Using the 95th percentile soil ingestion rate of 160 mg/day indicates Pb exposure would be between 19.5 µg/day and 115 µg/day. This ingestion rate would predict a 5.4 µg/dL to 31.9 µg/dL long-term contribution to blood-Pb from soil, assuming a blood volume of 1.0 liter. At the 95th percentile, 48,361 of the 49,266 (98.2%) activity scenarios indicate a long-term blood-Pb concentration of >10 µg/dL which could be attributable to soil consumption. The 90th percentile soil consumption maintains similar Pb exposure with a range between 18.4 µg/day and 108 µg/day. These exposure scenarios would yield a long-term blood Pb concentration between 5.10 µg/dL and 29.9 µg/dL with the same blood volume assumptions. Using the 90th percentile soil ingestion assumption, 47,795 of 49,266 (97%) scenarios
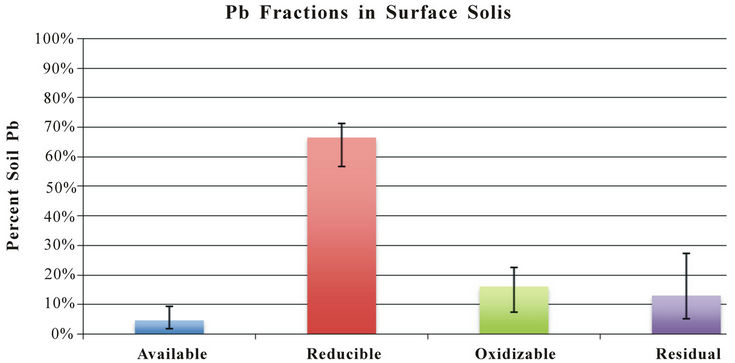
Figure 2. Average Pb availability given in percent of total Pb concentrations as described in Pueyo et al. [32] (Error bars represent max/min recovered Pb from a subset of 20 sample sites).
exceed the CDC blood-Pb criteria of 10 µg/dL. Using the 75th percentile predicted soil ingestion indicates a Pb exposure between 8.80 µg/day and 51.6 µg/day. Using this exposure profile, 2478 of 49,266 (5.0%) will exceed blood-Pb concentrationsof 10 µg/dL due to soil ingestion alone. The median scenario had no incidents greater than of the EPA limit of 10 µg/dL occurred.
A more protective blood-Pb concentration has been estimated at 6 µg/dL [3]. To maintain this blood level while assuming the same elimination half-life of 20.3 days and a blood volume of 1.0 liter, a maximum exposure to Pb would be 21.7 µg/day. The consumption rate of 10 mg/day of soil would produce a Pb exposure between 1.22 µg/day to 7.17 µg/day according to our model. This would not be indicative of any blood-Pb concentrations greater than 6 µg/dL within our study area. Also, the median consumption rate of 45-mg/day soil is construed by our model to have 5.50 µg/day to 32.3 µg/day Pb exposure with 3476 of 49,266 (7.1%) exceeding blood-Pb concentrations of 6 µg/dL in our study area. With a consumption rate of 72 mg/day (75th percentile) soil, 39,666 exposure scenarios of the possible 49,266 (80.5%) had Pb exposure >21.7 µg/day, which would in turn translate into 6 µg/dL. Using the criterion of 6 µg/dL to protect neurological development would mandate that a large portion of the childhood population might be at risk inside the study area evaluated.
4. Discussion
Trace metal exposure has been strongly correlated with surface soil concentrations and can be linked to incidenttal soil ingestion [31]. Well-established deleterious effects of Pb have generated critical concern for Pb exposure in children and inspired the pursuit of a better model to predict blood-Pb concentrations in children [3]. While soil-Pb concentrations can be high, the available fraction of the soil-Pb is a better predictor of potential toxicity to children [33]. While our results indicate a large potential hazard and match similar work done in New Orleans [17] it is important to realize that Pb-body burden is strongly correlated to blood volume. With our current assumptions (1.0 liter blood volume), soil-Pb concentrations exceeding 310 µg/g would result in blood-Pb concentrations exceeding the 10 µg/dL threshold. Changing the assumption of a 10 kg child to a 20 kg child would increase the assumed blood volume from 1.0 to 2.0 liters. In this circumstance, only 7.3% of the 90th percentile would exceed the CDC’s 10 µg/dL threshold and no samples exceeded the CDC’s threshold at the 75 percentile rate of ingestion.
Children under the age of four years spend 15 to 20 hours/day in indoor microenvironments, based on multiple surveys [20].Outdoor activities can range broadly from 30 min/day to an 8 hour/day based on family priorities. CHAD indicates the three outdoor microenvironments used in our model (home, childcare, and parks) had average usage of 2.5 hours/day, 2.0 hours/day, and 0.5 hours/day, respectively, and we kept these assumptions constant throughout our calculations according to the USEPA terrestrial wildlife model. Given that the time spent outside at home was the largest, the Pb concentration there was the determining factor for the model, followed by childcare facilities and then parks and playgrounds. With a broad range of Pb concentrations in our study area (68.5 µg/g to 832 µg/g), exposure scenarios are unpredictable without a thorough investigation of soil-Pb concentrations. Our study area (7-km2) can have significant differences in a child’s Pb exposure prediction due to significant variations in soil-Pb concentrations and toddler soil consumption rates (1.22 g/day to 115 g/day).
In this study, several assumptions were made which allowed us to generate a quantitative model. If the most significant source of soil ingestion is not outdoor hand-to-mouth activities, our Pb exposure profile would be substantially altered. Also, activity patterns were assumed to be constant. While it is obvious that aspects such as gender, physical activities, diet, and race/ethnicity could affect children’s exposure to soil, insufficient data are available to consider them in our model [22]. Our goal was to be protective yet environmentally relevant, focusing on the largest ingestion rates which have been observed in a quantitative study and which could be reasonably applied in New Orleans. Furthermore, our study keeps physical activities constant. Changes in daily activity were not incorporated into this model (i.e., weekend vs. weekday activity, and preclusion from outdoor activities such as vacation and illness) [24,25]. Changing the outdoor microenvironment ratios may have an effect on Pb exposure as well as change the controlling location for Pb exposure in soil. Finally, our bioavailability assumption is based on quantitative data from New Orleans. However, research suggests that Pb that is not readily available may be extracted by gastric or intestinal fluids [33]. This research predicts that Pb absorption could be as great as 30% of exposed Pb. Using this upper bound would have a profound effect on our results, increasing child exposure to Pb by three-fold. This would place all children in New Orleans at a higher risk.
In subsequent studies uncertainty could be reduced from several sources. A more thorough evaluation of Pb availability in soils could isolate human absorption potential. This information would allow researchers to calculate with greater accuracy long-term blood-Pb levels from a given exposure. An exhaustive study conducted on childhood behavior in New Orleans would also reduce many sources of error in our model. Incorporating gender, physical activities, diet, and race/ethnicity into an exposure model could give significant insights into child exposure profiles.
REFERENCES
- L. M. Chiodo, S. W. Jacobson and J. L. Jacobson, “Nuerodevelopmental Effects of Postnatal Lead Exposure at Very Low Levels,” Neurotoxicology and Teratology, Vol. 26, No. 3, 2004, pp. 359-371. doi:10.1016/j.ntt.2004.01.010
- H. W. Mielke and P. L. Reagan, “Soil Is an Important Source of Childhood Lead Exposure,” Environmental Health Perspectives, Vol. 106, Suppl. 1, 1998, pp. 217- 229. doi:10.1289/ehp.98106s1217
- S. Skerfving and I. A. Bergdahl, “Lead,” In: G. F. Nordberg, B. A. Fowler, M. Nordberg and L. T. Friberg, Eds., Handbook on the Toxicology of Metals, 3rd Edition, Academic Press, Burlington, 2007. doi:10.1016/B978-012369413-3/50086-0
- R. A. Goyer, “Toxic Effects of Metals,” In: C. D. Klaassen, Ed., Cassarett and Doull’s Toxicology, The Basic Science of Poisons, 5th Edition, McGraw-Hill, New York, 1996.
- H. W. Mielke, C. R. Gonzales, M. K. Smith and P. W. Mielke, “The Urban Environment and Children’s Health: Soils as an Integrator of Lead, Zinc, and Cadmium in New Orleans, Louisiana, USA,” Environmental Research Section A, Vol. 81, No. 2, 1999, pp. 117-129. doi:10.1006/enrs.1999.3966
- M. B. McBride, “Trace and Toxic Elements in Soils,” In: M. B. McBride, Ed., Environmental Chemistry of Soils, Oxford University Press, New York, 1994, pp. 308-341.
- R. L. Canfield, C. R. Henderson, D. A. Cory-Slechta, C. Cox, T. A. Jusko and B. P. Lanphear, “Intellectual Impairment in Children with Blood Lead Concentrations below 10 µg Per Deciliter,” New England Journal of Medicine, Vol. 348, No. 16, 2003, pp. 1517-1526. doi:10.1056/NEJMoa022848
- Center for Disease Control and Prevention, “Preventing lead Poisoning in Young Children,” US Department of Health and Human Services, Public Health Service, Center for Disease Control and Prevention, Atlanta, 1991.
- S. M. Presley, T. R. Rainwater, G. P. Austin, S. G. Platt, J. C. Zak, G. P. Cobb, E. J. Marsland, K. Tian, B. Zhang, T. A. Anderson, S. B. Cox, M. T. Abel, B. D. Leftwich, J. B. Huddleston, R. M. Jetter and R. J. Kendall, “Assessment of Pathogens and Toxicants in New Orleans, LA Following Hurricane Katrina,” Environmental Science and Technology, Vol. 40, No. 2, 2006, pp. 468-474. doi:10.1021/es052219p
- J. H. Pardue, W. M. Moe, D. McInnis, L. J. Thibodeaux, K. T. Valsaraj, E. Maciasz, I. van Heerden, N. Korevec and Q. Z. Yuan, “Chemical and Microbiological Parameters in New Orleans Floodwater Following Hurricane Katrina,” Environmental Science and Technology, Vol. 39, No. 22, 2005, pp. 8591-8599. doi:10.1021/es0518631
- C. Adams, E. C. Witt, J. Wang, D. K.Shaver, D. Summers, Y. Filali-Meknassi, H. Shi, R. Lunaand and N. Anderson, “Chemical Quality of Depositional Sediments and Associated Soils in New Orleans and the Louisiana Peninsula Following Hurricane Katrina,” Environmental Science and Technology, Vol. 41, No. 10, 2007, pp. 3437-3443. doi:10.1021/es0620991
- G. M. Solomon and M. Rotkin-Ellman, “Contaminants in New Orleans Sediment: An Analysis of EPA Data,” Natural Resources Defense Council, 2006. http://www.nrdc.org/health/effects/katrinadata/sedimentepa.pdf
- E. C. Witt III, C. Adams, J. Wang, D. K. Shaver, D. K. and Y. Filani-Meknassi, “Selected Chemical Composition of Deposited Sediments in the Flooded Areas of New Orleans Following Hurricane Katrina,” Science and Storms: The USGS Response to the Hurricanes of 2005, 2006. http://pubs.usgs.gov/circ/1306/pdf/c1306_ch7_b.pdf
- M. T. Abel, S. M. Presley, T. R. Rainwater, G. P. Austin, S. B. Cox, L. N. McDaniel, E. J.Marsland, B. D. Leftwich, T. A. Anderson, R. J. Kendall and G. P. Cobb, “Spatial and Temporal Evaluation of Metal Concentrations in Soils and Sediments from New Orleans, Louisiana, USA, Following Hurricanes Katrina and Rita,” Environmental Toxicology and Chemistry Vol. 26, No. 10, 2007, pp. 2108-2114. doi:10.1897/06-595R.1
- G. P. Cobb, M. T. Abel, T. R. Rainwater, G. P. Austin, S. B. Cox, R. J. Kendall, E. J. Marsland, T. A. Anderson, B. D. Leftwich, J. C. Zak and S. M. Presley, “Metal Distributions in New Orleans Following Hurricanes Katrina and Rita: A Continuation Study,” Environmental Science and Technology, Vol. 40, No. 15, 2006, pp. 4571-4577. doi:10.1021/es060041g
- B. C. Suedel, J. A. Steevens, A. J. Kennedy, S. M. Brasfield and G. L. Ray, “Environmental Consequences of the Failure of the New Orleans Levee System during Hurricane Katrina: Chemical, Toxicological, and Benthic Community Analysis,” Environmental Science and Technology, Vol. 41, No. 7, 2007, pp. 2594-2601. doi:10.1021/es061977s
- M. T. Abel, S. M. Presley, T. R. Rainwater, G. P. Austin, S. B. Cox, L. N. McDaniel, R. Rigdon, T. Goebel, R. Zartman, B. D. Leftwich, T. A. Anderson, R. J. Kendall and G. P. Cobb, “Lead Distributions and Risks in New Orleans Following Hurricanes Katrina and Rita,” Environmental Toxicology and Chemistry, Vol. 29, No. 7, 2010, pp. 1429-1437. doi:10.1002/etc.205
- United States Environmental Protection Agency, Soil Screening Levels, “Region 6 Corrective Action Strategy (CAS) RCRA Projects,” USEPA, Dallas, 2005. http://www.epa.gov/earth1r6/6pd/rcra_c/pd-o/riskman.htm
- “United States Environmental Protection Agency Region 6 High Priority Bright Line Screening Table,” USEPA, Dallas, 2000. http://www.epa.gov/Arkansas/6pd/rcra_c/pd-o/capp-dhpblt.pdf
- N. E. Klepeis, W. C. Nelson, W. R. Ott, J. P. Robinson, A. M. Tsang, P. Switzer, J. V. Behar, S. C. Hern and W. H. Engelmann, “The National Human Activity Pattern Survey (NHAPS): A Resource for Assessing Exposure to Environmental Pollutants,” Journal of Exposure and Analytical Environmental Epidemiology, Vol. 11, No. 3, 2001, pp. 231-252. doi:10.1038/sj.jea.7500165
- T. McCurdy and S. E. Graham, “Using Human Activity Data in Exposure Models: Analysis of Discriminating Factors,” Journal of Exposure and Analytical Environmental Epidemiology, Vol. 13, No. 4, 2003, pp. 294-317. doi:10.1038/sj.jea.7500281
- E. A.Cohen Hubal, L. S. Sheldon, J. M. Burke, T. R. McCurdy, M. R. Berry, M. L. Rigas, V. G. Zartarian and N. C. G. Freeman, “Children’s Exposure Assessment: A Review of Factors Influencing Children’s Exposure, and the Data Available to Characterize and Assess That Exposure,” Environmental Health Perspectives, Vol. 108, No. 6, 2000, pp. 475-486. doi:10.1289/ehp.00108475
- E. J. Stanek III and E .J. Calabrese, “Daily Soil Ingestion Estimates for Children at a Superfund Site,” Risk Analysis, Vol. 20, No. 5, 2000, pp. 627-635. doi:10.1111/0272-4332.205057
- M. A. Jayjock, C. F. Chaisson, S. Arnold and E. J. Dederick, “Modeling Framework for Human Exposure Assessment,” Journal of Exposure Analysis and Environmental Epidemiology, Vol. 17, No. S1, 2007, pp. S81-S89. doi:10.1038/sj.jes.7500580
- Risk Assessment Forum. USEPA, “Guidelines for Exposure Assessment,” Federal Register, Vol. 57, No. 104, 1992, pp. 22888-22938.
- United States Environmental Protection Agency, “Acid Digestion of Sludges, Solids and Soil,” SW-846. Pt 1; Office of Solid and Hazardous Wastes, USEPA, Cincinnati, 1996.
- United States Environmental Protection Agency, “Inductively Coupled Plasma Atomic Emission Spectrometry,” SW-846. Pt 1; Office of Solid and Hazardous Wastes, USEPA, Cincinnati, 1996.
- United States Environmental Protection Agency, “Methods for the Determination of Metals in Environmental Samples,” Supplement I, USEPA, Cincinnati, 1994.
- A. D. Eaton, A. S. Clesceri and A. E. Greenberg, “Standard Methods for the Examination of Water and Wastewater,” 19th Edition, 1995.
- B. E. Sample, M. S. Aplin, R. A. Efroymson, G. W. Suter II and C. J. E. Welsh, “Methods and Tools for Estimation of the Exposure of Terrestrial Wildlife to Contaminants,” Environmental Sciences Division, Publication No. 4650, 1997.
- H. W. Mielke, D. Dugas, P. W. Mielke Jr., K. S. Smith, S. L. Smith and C. R. Gonzales, “Associations between Soil Lead and Childhood Blood Lead in Urban New Orleans and Rural Lafourche Parish of Louisiana,” Environmental Health Perspectives, Vol. 105, No. 9, 1997, pp. 950-954. doi:10.1289/ehp.97105950
- M. Pueyo, J. Sastre, E. Hernandez, M. Vidal, J. F. LopezSanchez and G. Rauret, “Heavy Metals in the Environment Prediction of Trace Element Mobility in Contaminated Soils by Sequential Extraction,” Journal of Environmental Quality, Vol. 32, No. 6, 2003, pp. 2054-2066. doi:10.2134/jeq2003.2054
- R. A. Schoof, M. K. Butcher, C. Sellstone, R. W. Ball, J. R. Fricke, V. Keller and B. Keehn, “An Assessment of Lead Absorption from Soil Affected by Smelter Emissions,” Environmental Geochemistry and Health, Vol. 17, No. 4, 1995, pp. 189-199. doi:10.1007/BF00661331
NOTES
*Corresponding author.
#Mention of trade names or commercial products in this publication is solely for the purpose of providing specific information and does not imply recommendation or endorsement by the US Department of Agriculture. USDA is an equal opportunity provider and employer.