Smart Grid and Renewable Energy
Vol.2 No.4(2011), Article ID:8276,13 pages DOI:10.4236/sgre.2011.24043
Investigation of the Performance of CIS Photovoltaic Modules under Different Environmental Conditions
![]()
Applied Sciences Department, College of Technological Studies, Shuwaikh, Kuwait.
Email: *aa.ghoniem@paaet.edu.kw
Received July 1st, 2011; revised July 27th, 2011; accepted August 4th, 2011.
Keywords: PV Module, Module Parameters, Series Resistance, Shunt Resistance, Ideality Factor
ABSTRACT
This work investigates the effects of temperature and radiation intensity on the parameters of a copper indium diselenide (CIS) photovoltaic module. The module performance parameters are determined from calculated module parameters. An outdoor experimental setup is installed to carryout a series of I-V curve measurements under different irradiance and temperature conditions for the module. A numerical model which considers the effect of series and shunt resistances is developed to evaluate the different parameters of PV modules. Orthogonal distance regression (ODR) algorithm is adapted for fitting I-V measurements and extracting module parameters from I-V measurements. The values of module parameters, series resistance Rs, shunt resistance Rsh, diode ideality factor n and reverse saturation current Io determined from I-V measurements at different irradiation intensity and temperature range are in good agreement with the corresponding parameters obtained from the developed numerical model. The module parameters extracted from I-V measurements are employed to calculate the module performance parameters, i.e. open circuit voltage Voc, fill factor FF and module efficiency h at different irradiation intensity and temperature range. Present results indicate that the largest drop in open circuit voltage Voc due to about 20˚C increase in temperature is approximately 8.8% which is not compensated for by the relatively small increase in short circuit current, (2.9% in Isc), resulting in a reduction in maximum power of about 6.3%. Results let us conclude that the shunt resistance RSh increases with radiation at low radiation values (<400 W/m2). As radiation increases at high radiation values (>400 W/m2), RSh begins to decease sharply and dramatically. Also, as the light intensity incident on the solar module increases, the series resistance and the output voltage decrease. When the irradiance intensity increases, the series resistance decreases but with a very low rate at the two studied temperatures ranges. The low rate decrease of Rs is found to have little effect on module performance in comparison with the significant change of other module parameters. The ideality factor n and saturation current Io decrease first sharply in the low range of radiation intensity (<400 W/m2) and this decrease becomes smaller for irradiance values greater than 400 W/m2. The previous observations and conclusions regarding the module parameters RSh, RS, n and Io obtained at 20˚C observed again at 40˚C but there is a great difference between the peak values of RSh at both temperature levels. Present results also show that module efficiency decreases with increasing irradiance intensity due to the combined effect of both Voc and FF.
1. Introduction
The main objective of photovoltaic research industry is to develop high efficiency low cost photovoltaic cells and modules. Photovoltaic technology clearly offers tremendous environmental benefits, requiring no fuel and producing no emissions or other waste beyond that inherent in the manufacturing process. Moreover, photovoltaic have proven to be economical for a wide range of applications that have traditionally relied on diesel generators. The advantages that photovoltaic have over competing power options are: they have no moving parts and produce power silently. They are non-polluting with no detectable emissions or odors. They can be standalone systems that reliably operate unattended for long periods. They require no connection to an existing power source or fuel supply. They consume no fossil fuels-their fuel is abundant and free. Unfortunately solar cells are still far too expensive to produce a significant fraction of the worlds energy needs. The use of photovoltaic cells has increased in the last few decades as their manufacturing cost has decreased and as people have become more concerned about energy use.
A thin-film solar cell is a solar cell that is made by depositing one or more thin layers of photovoltaic material on a substrate. The thickness range of such a layer is wide and varies from a few nanometers to tens of micrometers. Many different photovoltaic materials are deposited with various deposition methods on a variety of substrates. Thin-film solar cells are usually categorized according to the photovoltaic material used: amorphous silicon (a-Si), cadmium telluride (CdTe), copper indium gallium selenide (CIS or CIGS) and dye-sensitized solar cell (DSC) and other organic solar cells. Thin film solar cells have achieved efficiencies of about 15 - 20%. The highest efficiencies recorded recently for all thin film photovoltaic technology on laboratory scale or module scale are for chalcopyrite solar cell based on Cu (InGa)Se2 absorbers. So, obtaining the outdoor performance of the base material Cu In Se2 (CIS) or the more efficient one Cu (InGa)Se2 (CIGS) under different solar irradiance and device temperature and or spectral irradiance is vital for selecting the proper solar module for certain location and specific application.
Series and shunt resistances in solar cells are parasitic parameters, which significantly affect the illuminated I-V characteristics and cell efficiency. Series resistance, Rs, is mainly the sum of contact resistance on the front and back surfaces. So, the series resistance should be kept to a minimum for efficient conversion of solar energy. The shunt resistance, Rsh, represents a parallel high conductivity path across the p-n junction or the cell edges and decreases the efficiency of the cells by increasing the leakage current that lowers the maximum output power (Pm), the open voltage, Voc and the fill factor, FF. Several methods are available in the literature for extracting the series and shunt resistances of a solar cell [1-12] as well as related device parameters. Some of the methods involve measurement of illuminated I–V characteristics, some use dark conditions or utilize dark and illumination measurements. Other methods apply curve fitting method to some assumed functional relationship or employ integration procedures based on the computation of the area under the I-V curves or use linear regression. It is also possible to predict PV module performance under illumination through a several numerical or algebraic methods [13-18].
Most of the above mentioned methods are based on single exponential model of solar cell and assume that the shunt resistance, Rsh, is infinite and presume that Rs is independent of the intensity of illumination which is not a correct assumptions especially for solar cells that have low Rsh as amorphous silicon and CIS modules.
For this reason, an improved five parameter model which considers the shunt resistance is developed to carry out the present work. The model can handle the different cell technologies namely amorphous crystalline and copper indium diselenide (CIS) thin-film modules. The five parameter model uses the data provided by the manufacturers and empirical correlation equations to predict the solar cell parameters at different operating conditions. Measurements of I-V characteristics are carried out in the photovoltaic facility installed at the roof of the main building in the College of Technological Studies, Kuwait. These measurements are carried out at different illumination intensity and temperature. Non linear curve fitting of experimental I-V data proposed by Burgers et al. [19] is adapted to extract different solar modules parameters from I-V measurements. A comparison between solar modules parameters predicted from the developed numerical model and the corresponding parameters obtained from I-V measurements to validate the accuracy of the developed numerical model proposed for this study. The module parameters extracted from I-V measurements are employed to calculate the module performance parameters, i.e. short circuit current (Isc) open circuit voltage (Voc), fill factor (FF) and efficiency (h) at different irradiation intensity and temperature range.
2. Theoretical Analysis
A PV cell may consist of a single crystal, a number of smaller crystals (polycrystalline), or it may lack crystal structure all together (amorphous). Other semiconducting materials such as thin film chalcopyrite are employed in PV cells for extraterrestrial or sun concentrator applications, but this description will concern a silicon PV cell. The light intensity affects primarily the amount of current produced, making it proportional, while the cell temperature controls the voltage produced. As the cell temperature increases, the current produced remains the same but the voltage is reduced, reducing the output power. All of these factors need to been taken into consideration to accurately predict the energy production.
To choose an appropriate model for detailed simulation, several factors need to be considered. The most important one is the accuracy which can be obtained. A PV cell is not a fixed voltage source, so the model should be able to predict the current and voltage over the entire operating voltage range. Another factor is whether the data required by the model is provided by the manufacturers or not. Another important consideration is whether the data needed to use an I-V model are readily available to the system designer. Models with a large number of parameters, although possibly more accurate, either requires access to generally unpublished and proprietary manufacturer's data, or else require prototype test data. The most detailed, consistent information commonly available is provided in brochures from commercial module manufacturers.
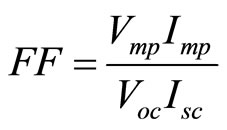
Standard test conditions (STC) are usually specified so that a performance comparison can be made between different PV units (cell, modules). The conditions for standard test conditions are specified as follows: The reference irradiance GRef with a typical value of 1000 W/m2, the reference cell temperature TC,Ref with a typical value of 25˚C and a specified light spectral distribution with an air mass, AM = 1.5. There are three classic parameters that are very important on the PV characteristics namely Isc, Voc and the maximum power point (Imp; Vmp). These points are usually given as part of a manufacturer's data sheet for a PV module. Another important parameter of the PV performance is called the Fill Factor (FF). It is a term that describes how the curve fills the rectangle that is defined by (Voc) and (Isc). It gives an indication of the quality of a cell's semiconductor junction and measures of how well a solar cell is able to collect the carriers generated by light. It is defined as:
 (1)
(1)
After a simple manipulation, one gets the equation:
Voc Isc FF = VmpImp = Pmax (2)
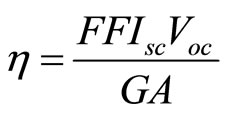
It can be easily observed that FF is always less than unity and differs from material to material. The closer the value of the fill factor is to unity, the better the operation of the PV cell. The PV efficiency (h) is defined as the ratio of the maximum output power Pmp to the solar power received by the cell surface area (A):
 (3)
(3)
A five parameter photovoltaic model is adapted in this study to determine the module parameters. In the present work, the five parameter model is used to simulate the characteristic of thin film solar cells at different weather conditions. This model adds Rsh to the four-parameter model making it applicable to both crystalline and thin film PV solar cells.
The mathematical model describing the performance of the solar modules should accurately predict how solar module output would vary with ambient temperature and radiation conditions. Since the solar cell is a nonlinear power source, so the output current and voltage depend on the radiation level and temperature. There are different photovoltaic simulation programs developed for modeling the performance of the solar cell. In these models, the solar cell is treated as an equivalent circuit. Such models require a program to simultaneously determine the current-voltage (I-V) characteristics as well as the output of a PV module. The four parameters model is a widely used model for determining the characteristic curves of solar cells. The four-parameters appearing in the IV equation are the light current (IL), the series resistance (Rs), and two theoretical diode characteristics. These parameters are not measurable quantities and are not generally included in manufactures catalog data. As a result, they must be determined from systems of I-V equations at various operating points; these points are taken from catalog data. The detailed analysis of the four-parameter PV model was introduced by Townsend [13] and incorporated into TRNSYS [14].
The four parameter model assumes that the slope of the I-V curve is flat at the short-circuit condition. This means that this model neglects Rsh because it is very large compared with Rs for the crystalline silicon (C-Si) cell. However, this assumption is not generally valid for amorphous photovoltaic. So, the four parameters model accurately predicts the performance of single crystal and polycrystalline PV arrays. In the other hand, the four parameters model can not accurately predict the performance of thin film PV modules. The main deviation is around the maximum power point because a-Si solar cell does not have a good fill factor as the C-Si cell does. In order to explain the low fill factors measured, the shunt resistance, which are lower than that of C-Si cell should be taken into consideration. Thee five parameters model takes Rs into account. Adding this parameter makes the five-parameter model applicable to both crystalline and amorphous PV cells. In the present work, a five parameter model is developed to simulate the characteristics of CIS module at different weather conditions.
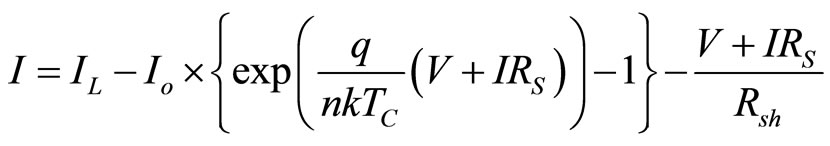
The electrical behavior of the five parameter model is usually described by an equivalent circuit. The IV equation for five parameter model is generally expressed by:
 (4)
(4)
where IL is the light current, Io is the diode reverse saturation current, junction of the cell material. The diode current, ID is the current flowing internally across the cell’s semiconductor junction. All the internal dissipative electrical losses are lumped together into the series resistance, RS. Rsh is the shunt resistance and as it approaches infinity, this arrangement becomes identical to the fourparameter model. Thus, all the equations employed in the five-parameter model reduce to those in the simpler four parameter scheme for very large values of Rsh. Equation (4) also includes ideality factor (n), electron charge (q), Boltzmann constant (k) and cell temperature (TC). The five parameters from which the five parameter model obtains its name are: n, IL, Io , Rs and Rsh. Amorphous and CIS photovoltaic cells exhibit a pronounced slope at the short circuit point, therefore a finite shunt resistance exists. A numerical model is adapted to solve Equation (4) to obtain the five parameters at different illumination intensity and operating temperatures. The magnitude of the IV slope at short-circuit is related inversely to the shunt resistance. As Rsh approaches infinity, this arrangement becomes identical to the four-parameter model. Thus, all the equations employed in the five-parameter model reduce to those in the simpler four parameter scheme for very large values of Rsh.
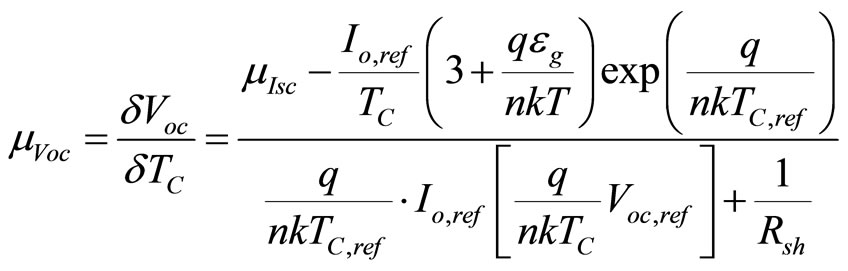
An additional equation is needed to numerically solve IV equation. The catalog value that is employed to get the additional equation is the temperature coefficient of open-circuit voltage (mVOC). Taking the derivative of Equation (4) and using an equation for the temperature dependence of Io yields:
 (5)
(5)
The diode reverse saturation current (Io) depends on temperature, as well as on the material band gap energy (εg) and the number of cells in series (Ns). So, when the value of saturation current increases, the I-V curve shifts toward the left decreasing the value of the open circuit voltage and the voltage at the maximum power point.
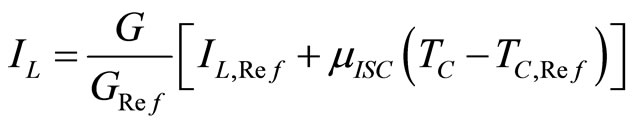
The light current (IL) parameter was observed to depend on the effective solar irradiance, the cell temperature (Tc), the short circuit current temperature coefficient (mIsc), and the air mass modifier. The equation for IL is:
 (6)
(6)
Subscript (Ref) refers to values at reference conditions.
2.1. Determining the Shunt Resistance
Adding Rsh introduces another unknown value into the model. Like IL, Io, n, and Rs, Rsh is not an easily measured physical quantity. Thus, it must be determined from information available from the manufacturer. The primary effect of Rsh on the IV characteristics is to change the short circuit slope. Thus, it is logical to use the measured value of this slope to back out a value for Rsh. The short-circuit slope is not a value which is generally included in the list of catalog specifications. However, it is possible to approximate this value if the IV curve is available. In order to determine the relationship between the short-circuit slope and the shunt resistance it is first necessary to differentiate the IV expression presented in Equation (4) with respect to voltage. Performing the differentiation, setting V to 0 and I to Isc,ref yields:
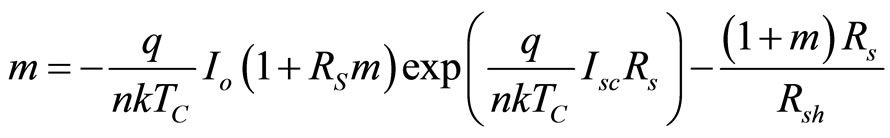 (7)
(7)
where the variable m is equal to the short circuit slope  solving Equation (7) for Rsh yields:
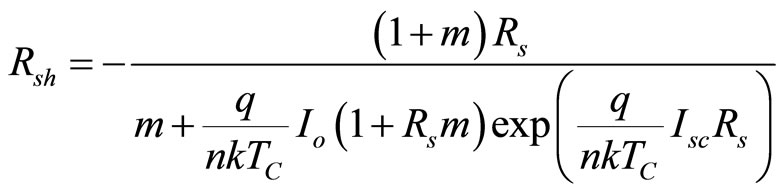 (8)
(8)
The difficulty with Equation (8) is that, in addition to the short-circuit slope, it includes the parameters n and Rs which cannot be explicitly written in terms of the manufacturers’ parameters. Thus, solving for these values simultaneously would involve a computationally intensive two-stage iteration scheme. It is proposed that Equation (8) may be simplified with the approximation:
 (9)
(9)
To test the validity of Equation (9), several sample IV curves with different shunt resistances values were produced using the adapted five parameter model.
2.2. FORTRAN Component for I-V Characteristics
Several computer-based Software such TRNSYS [14], PV F-Chart [20], PVFORM [21], and Sandia National Laboratories [22] design handbooks methods exist for estimating the performance of PV systems. An important distinction among models is whether the model performs simulations over frequent, usually hourly, intervals or whether a reduced set of calculations is done based on average behavior over a longer, usually monthly interval. The detailed models require extensive weather data; Typical Meteorological Year (TMY) data. Another major distinction is whether or not the model is limited to use on maximum power-tracked systems. None of the previous available models are able to model direct-coupled loads of arbitrary I-V shape.
The method presented in this work uses long-term average weather data to estimate system output for directcoupled loads of any I-V shape. The equations in the previous sections are implemented to develop a numerical model to determine the characteristics of copper indium diselenide (CIS) module. The FORTRAN code necessitates three different groups of information: a set of parameters, an array of input variables and an array of output variables. The parameters are characteristic values which are fixed through out the run. Inputs to the code are the time dependent variables such as irradiance and temperature. The output depends on the parameters needed to analyze the performance of PV modules. The iteration process begins with an initial guess of V as an input to the PV array component. The PV array component calculates the corresponding current into the load component. The load component produces a new voltage serving as a second guess for PV array component. The successive substitution is continued until convergence is obtained and the operating point is achieved.
2.3. Non Linear Curve Fitting of Experimental Data
To extract the PV module parameters a non linear curve fitting program IVFIT of experimental I-V data proposed by Burgers et al. [19] is adapted for this study. Measurements of the I-V curves of solar modules are one of the most important means of obtaining information about PV modules. Straightforward least squares fitting of I-V curves leads to non accurate fit leading to a bad fit at the maximum power point and lower voltage values. The strongly varying slope makes it difficult to fit PV modules I-V curves with standard least square techniques. To deal with this problem, Burgers et al. [19] propose using weighting functions to minimize the area between data and fit instead of least squares procedure.
Voltage noise has a big influence on fitting due to the steep slope of an I-V curve for higher voltage values. So, Burgers et al. [19] have used Orthogonal Distance Regression (ODR) which is a mathematical method for fitting measurements and in the meantime it allows for computing the I-V curve parameters. The goodness of fit, c2, is used to judge whether the oneor two-diode models are suitable. The computer code adapted employs an iterative scheme such that the fitted current and not the measured current are used to calculate the effect of series resistance. The program accounts for noise in the current as well as in the voltage signal of the measured datasets. ODR algorithms process both the error signal of the current and of the voltage close to Isc and Voc. Noise levels determined from the IVFIT is checked such that the IV curve fit at STC proved to be as accurate as possible.
3. Experimental Setup
Figure 1 shows a schematic diagram of the outdoor PV modules test facility installed at the College of Techno-
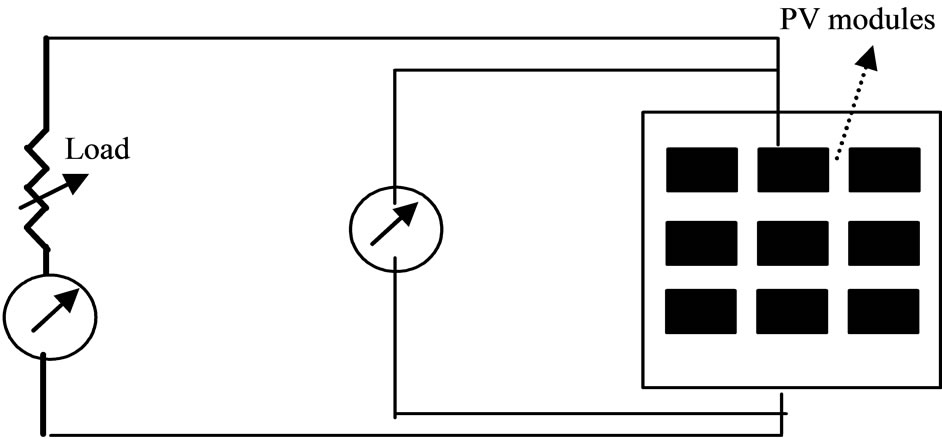
Figure 1. Schematic diagram of I-V setup for PV modules.
logical Studies, Kuwait. This test facility is designed to measure the I-V characteristics of different types of PV modules at different radiation and temperature levels in Kuwait climate. The solar modules are mounted on the roof of the main building in the College of Technological Studies facing south at a tilt angle 31˚ which is equal to Kuwait latitude. The place of the solar modules is chosen such that a shadow will not be cast into the solar modules at any time during the test period.
The test method proposed for the measurement of the I-V characteristics of PV modules at different radiation and temperature levels requires the measurements of the following parameters: 1) the global radiation on the solar module, 2) the I-V curve at different radiation levels and 3) the I-V curve at different temperature levels.
The intensity of the solar radiation incident on the module surface are measured and recorded by an Eppley Precision Spectral Pyranometers (PSP model) connected to the data acquisition system. Measurements are recorded for periods where variations in global radiation through the measurement period do not exceed ±20 W/m2. The accuracy of the temperature measurements devices differ according to the purpose they are used for. The ambient air temperature should be measured within an accuracy of ±0.1˚C. A standard resistance thermometer detector (RTD-PT100) is used to monitor the surrounding ambient temperature to guarantee high accuracy for this critical temperature. It is to be noted that the RTD sensor of the ambient temperature is shaded from direct and diffuse solar radiation.
The Keithley Source Meter instrument is adapted to perform I-V characteristics of different solar cell modules. The Keithley Source Meter instrument combines a programmable power source with the measurement functions of a digital multimeter. The Keithley LabTracer software allows users to coordinate the measurement and sourcing voltage or current and collect voltage and/or current readings, as well as a timestamp for each measurement set. One can sweep voltage or current allowing collection of complete test sequences. Results can be exported to windows based programs like EXCEL spreadsheet for calculation, and analysis.
Temperature measurements of PV devices are usually a difficult task. In general, measured temperatures should be those of the actual semiconductor junctions, but usually the only temperature that can be measured is at the rear surface of a cell. For modules, it not possible to contact individual cells and one is forced to apply temperature sensors to the rear surfaces. This leads to an error because the rear surface will normally be cooler than the cells laminated inside. At 1000 W/m2, this error is about 2.5% for typical PV modules.
A five set of thermocouples are placed in the rear surface of the modules, one at each corner plus one at the module center to measure the module temperature. During the module tests, the corresponding values of environmental parameters were recorded by Keithley 2700 data acquisition device. All of this information is saved to different data files in a personal computer. The obtained measured data files are treated first to eliminate erroneous points. The I-V curves are then plotted and a numerical technique is adapted to analyze the measured data and extract the different modules parameters. The outdoor exposure tests were carried out during the period from 8th August 2009 to 10th August 2010. The sourcemeter is used to sweep voltage through the solar modules and measure current to obtain the I-V curve of the modules.
In PV system design, many of the calculations are based on the determination of module temperature from ambient temperature and NOCT [23-25]. From the linear regression of the plotting of the difference between module temperatures minus ambient temperature against the irradiation, a preliminary value of NOCT is obtained. This value is corrected to 800 W/m2 and 20˚C depending on the average values of ambient temperature and wind speed during the test. To obtain a good spread of measured points, simulations under different current ratings and various meteorological conditions were performed. The voltage and current of the module is recorded at each operating point with high precision digital numbers.
4. Results and Discussions
The I-V curves of CIS thin-film modules were monitored for the period August 8, 2009 to August 10, 2010. the I-V curves are monitored using Keithley Sourcemeter. TheI-V characteristic of the PV modules while deployed outdoor represents the performance under real operating conditions Table 1 lists the manufacturer specifications of the module used in this study at reference conditions STC (GRef = 1000 W/m2, TC,Ref = 25˚C).
To check the reliability of the present numerical model, the measured I-V characteristics are compared to the corresponding characteristics obtained from the numerical model as shown in Figure 2. As illustrated by
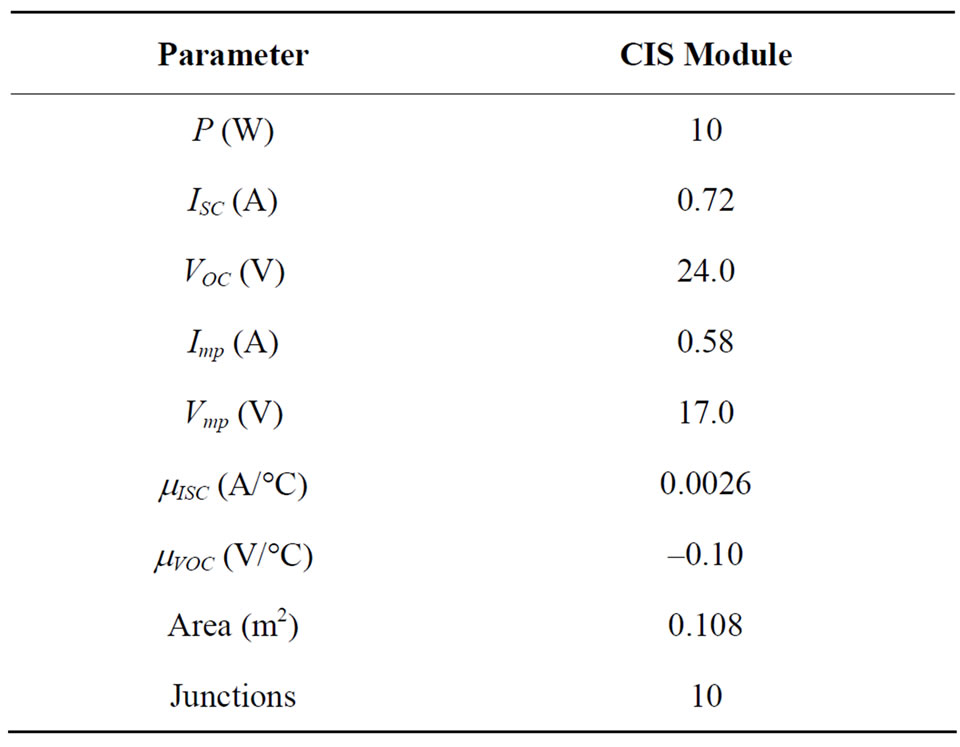
Table 1. Modules specifications.
the figure, the two predictions agree very well. Also, the two predictions agree well with the IV curves provided by the module manufacturer. These facts indicate the reliability of the adapted numerical model. It should be noted that both temperature coefficients of short circuit current (mISC) and open circuit voltage (mVOC) are provided by the manufacturer of the module. All the data are repeated at different days and time for the same radiation levels. So, the measured I-V points presented in the figures can be considered as the average points for the module during the test period. As predicted from Figure 2, there is a linear increase in photo-generated current with increased photon flux as irradiance levels increase, resulting in the observed increase in current with increased irradiance.
The variation of power and the values of Pmax produced by the module is calculated for each radiation level using the present developed model. These values are compared with the ones extracted using the IV fit program [19] and are found to be in good agreement. It was found that there is a significant increase in the module power with increased irradiance levels. It should be mentioned that the maximum power point is not always corresponding to solar noon which is 12:00. The reason for this may be attributed to the fact that the amount of irradiance received by the module is at its maximum at solar noon. Hence Isc, is also at its maximum. In the meantime there is a drop in open circuit voltage, Voc, around solar noon, which may be attributed to the elevated temperatures at this time of the day Also, it is observed that the voltage corresponding to maximum power point changes with radiation levels. The operating temperature of the PV module is one of the most important parameters affecting the solar module power output and its efficiency to convert sunlight into electricity. The output of the photovoltaic module de-

Figure 2. Comparison between measured and predicted. I-V characteristics for CIS module (Ta = 20˚).
creases with increase of the cell temperature. In order to improve PV module maximum efficiency and output power, the module temperature must be reduced.
The effect of temperature on the I-V curve of CIS module is illustrated by Figure 3. Different curves are measured around noon on different days at different module temperatures. The presented graph represents the average measurements for different days and times but at the same radiation intensity level (800 W/m2). The decrease in Voc with increase in temperature is clearly illustrated in the figures. Also, the figure clearly indicates that the open circuit voltage, Voc, is more temperature dependent than the short circuit current Isc. The largest drop in voltage due to about 20˚C increase in temperature is approximately 8.8% drop in Voc which is not compensated for by the relatively small increase in current, (2.9% in Isc), resulting in a reduction in Pmax of 6.3%. If not taken into account, excessive temperatures coupled with variation in irradiation, can lead to under-designing of PV systems, which in turn may lead to system failure. As stated before, the comparison between the results obtained from the numerical model and the experimental I-V data indicated the accuracy of the present measurements.
So, the non linear curve fitting technique proposed by Burgers et al. [19] is adapted to extract the PV module parameters from the experimental I-V data at different environmental conditions. The five parameters of the PV module are: IL, Io, Rs, Rsh and ideality factor, n, which is a measure of cellular imperfection. The IL for CIS module is observed to depend strongly on the solar irradiance. In addition, results imply that IL directly proportional to irradiance intensity level. In the following we present a discussion for the effect of environmental conditions on the other four parameters of CIS module.
The module parameters variation with radiation at temperature 20˚C is presented in Figure 4. As indicated by the figure, Rsh increases with radiation at low radiation values (<400 W/m2). The increase in Rsh with radiation at low radiation values may be attributed to the existence of local inhomogeneities leading to non uniform current flow or to the charge leakage across the p-n junction in the cell. The reason of this behavior is that RSh is associated with the localized defect regions which in turn have a larger concentration of traps that make them electrically active. We believe that the electrical activity of traps in this case is stronger at low irradiance. The same behavior has been observed by Priyanka et al. [26] and Cunningham et al. [27] for silicon solar cells. Contrary to their results, as radiation increases at high radiation val-
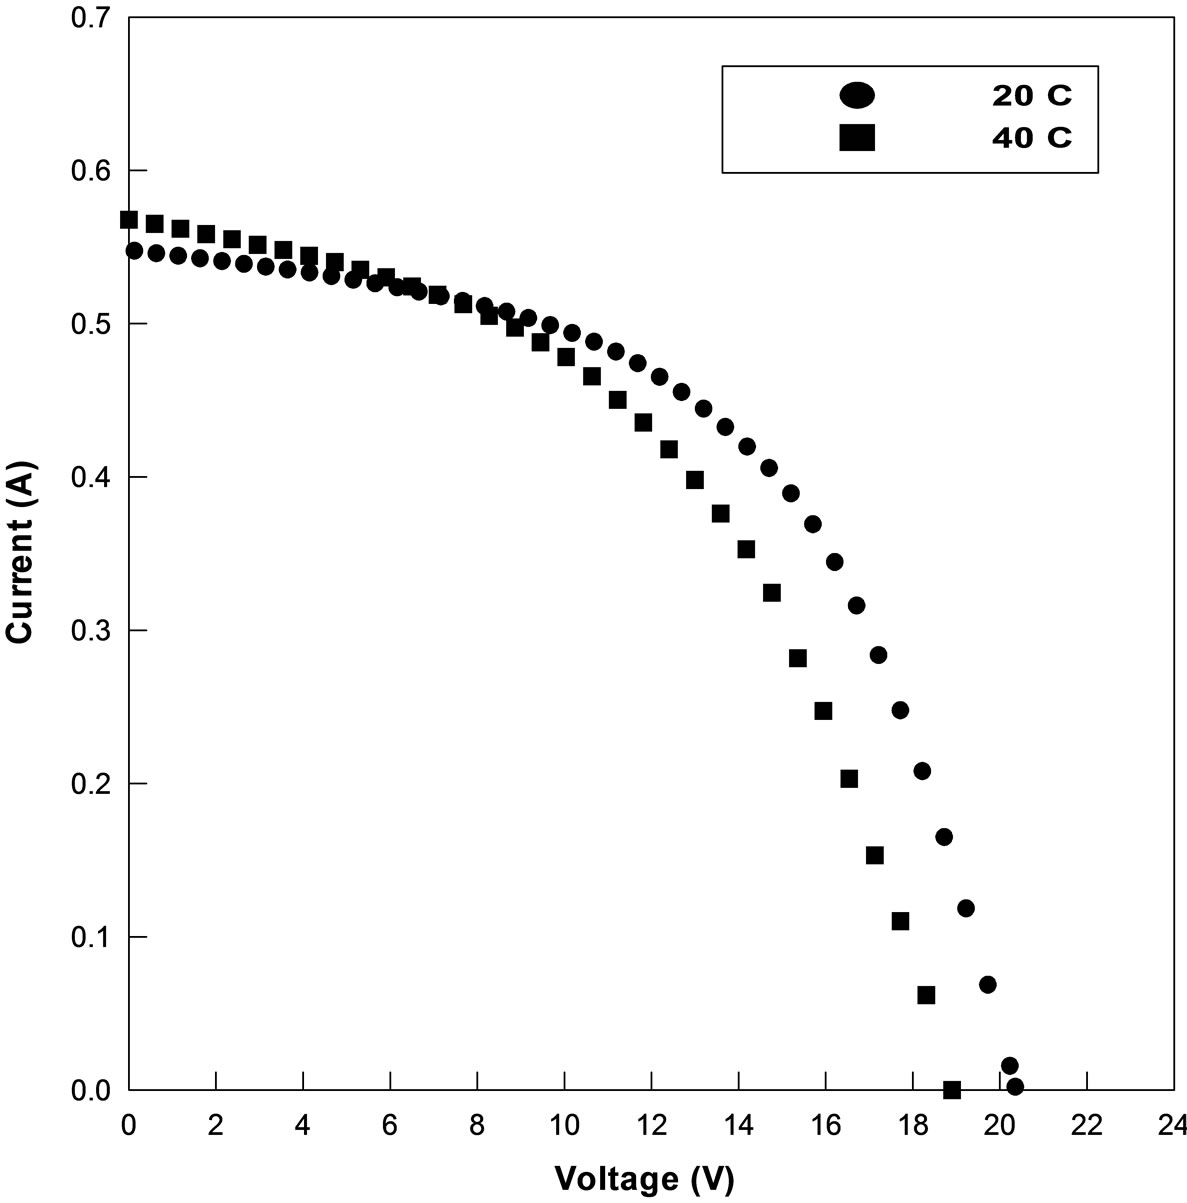
Figure 3. Variation of I-V characteristics with temperature for CIS module (G = 800 W/m2 ).
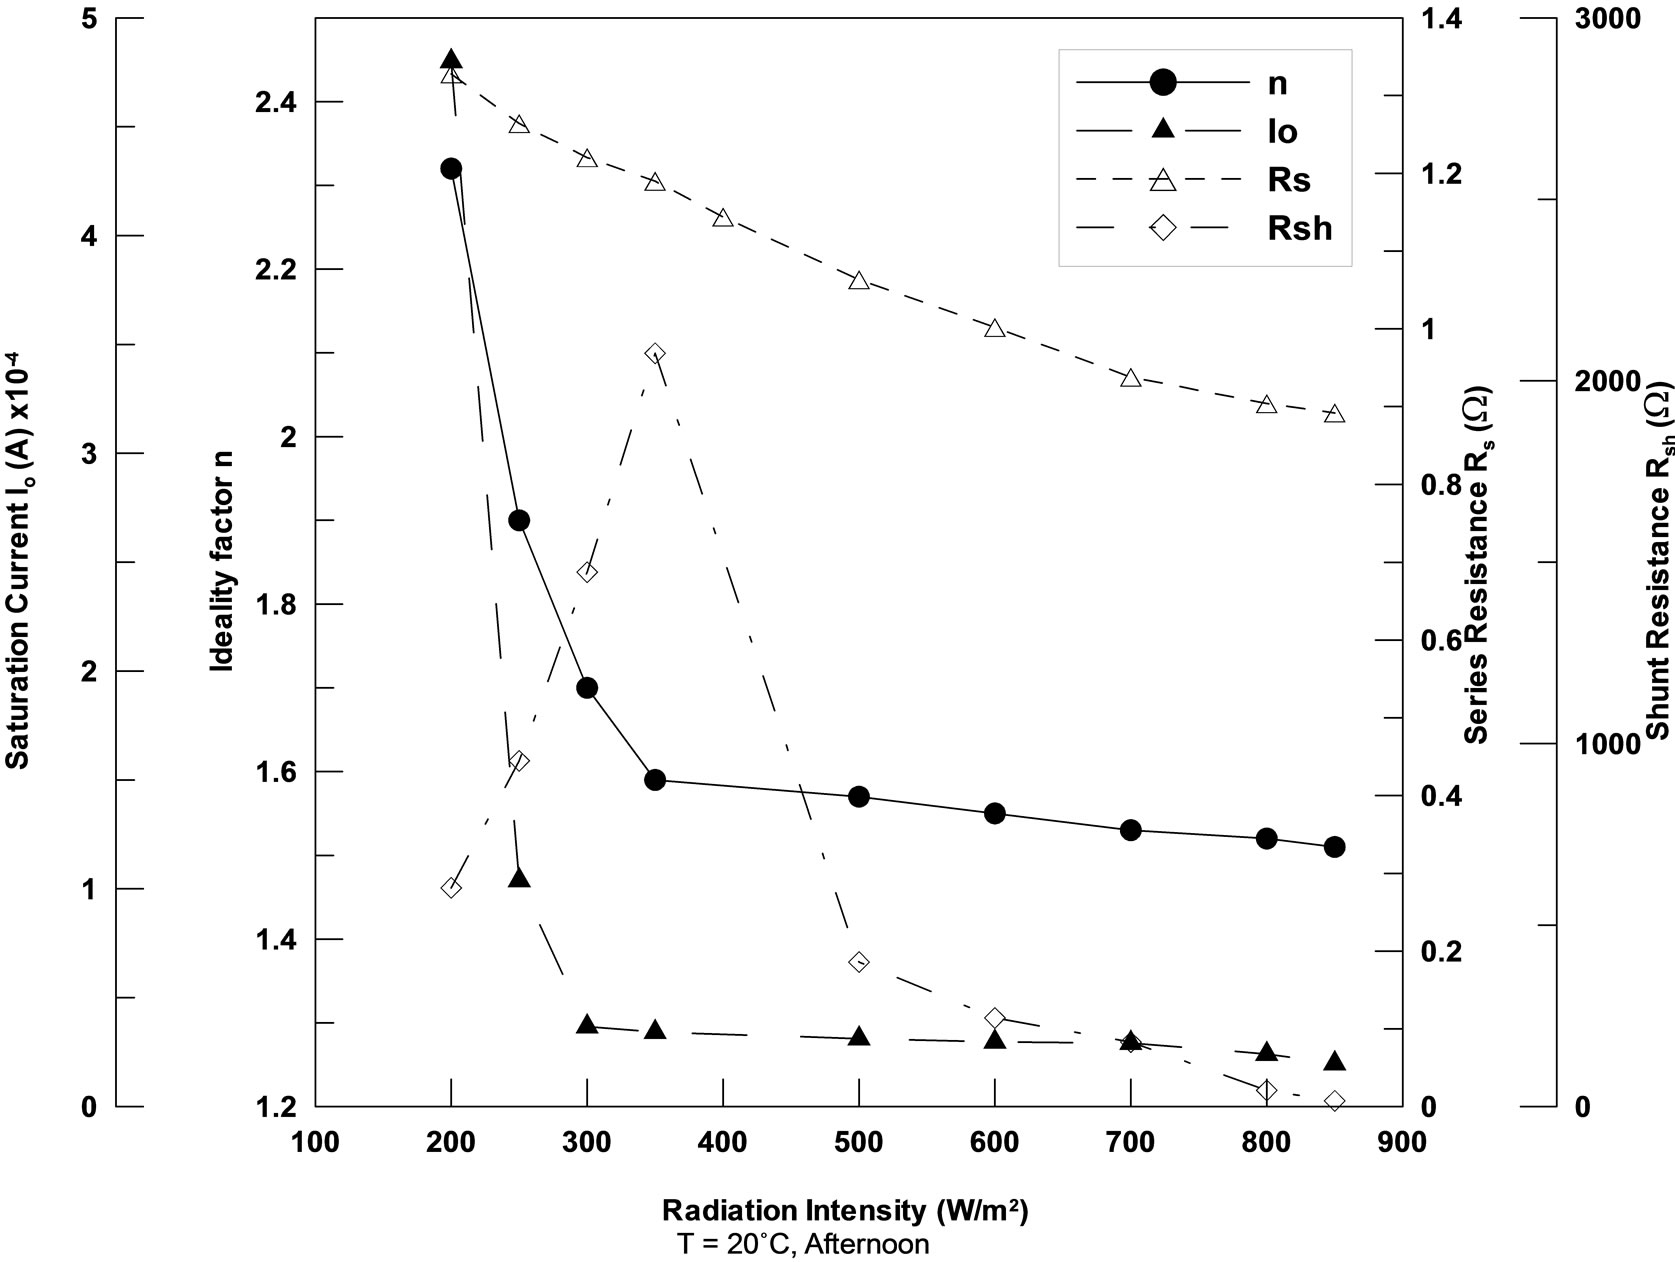
Figure 4. The module parameters variation with radiation intensity at module temperature 20˚C.
ues (>400 W/m2), Rsh begins to decease sharply. As the radiation intensity increases, the traps start getting filled and this of course results in increase of leakage current which in turn causes the sharp decrease observed in Rsh. As the irradiance increases up to the value 900 W/m2, the leakage current starts to increase more and more and Rsh reaches very low values as indicated by Van Dyk et al. [28] in their investigation of the effect of increasing irradiance intensity on Rsh for CIS modules. Also, at high values of radiation, some other effects as the heating of the cell can degrade Rsh to these low values [29].
It is known that Rsh is due to shunt paths that lead the current away from the intended load and their effects are detrimental to the module performance especially at low irradiance. The number of shunts in thin film cell may increase after prolonged exposure to light. The increase in the number of shunts increases the effect of shunt currents in the module and hence decreases Rsh with increasing irradiance level. So, the sharp decrease of Rsh for high radiation level (>400 W/m2) indicates that some of the module cells increase shunt currents and conesquently stop contributing to the total output of the module. Rs represents the total resistance that current meets when crossing the cell from one end to the other, so it represents resistances in the cell solder bonds, emitter and base region, cell metallization, cell interconnect bus bars and resistances in the junction books termination It is evident that Rs decreases the value of Voc, Isc and FF. As concluded previously [28,30], as the light intensity incident on the module increases, Rs and the applied voltage decrease. When the irradiance intensity increases, Rs decreases but with a very slow rate at the two studied temperatures (20˚C and 40˚C) as presented in Figures 4 and 5.
This decrease may be attributed to an increase in the conductivity of the active layer with the increase of the radiation intensity. The slow rate decrease of Rs has little effect on solar module performance compared with the significant change of other module parameters.
Also Figures 4 and 5 shows the effect of irradiance level on the ideality factor n and the saturation current Io at 20˚C and 40˚C respectively. It is well known that CIS materials are highly compensated with fluctuations in stoichiometry and composition which cause electrostatic fluctuations and band gap fluctuations respectively [31]. In case of polycrystalline thin films, it is almost trivial that not only electrostatic potential fluctuations at grain boundaries must occur, but also band gap fluctuations within the grain and from grain to grain. The primary effect of grain boundaries on polycrystalline CIS results
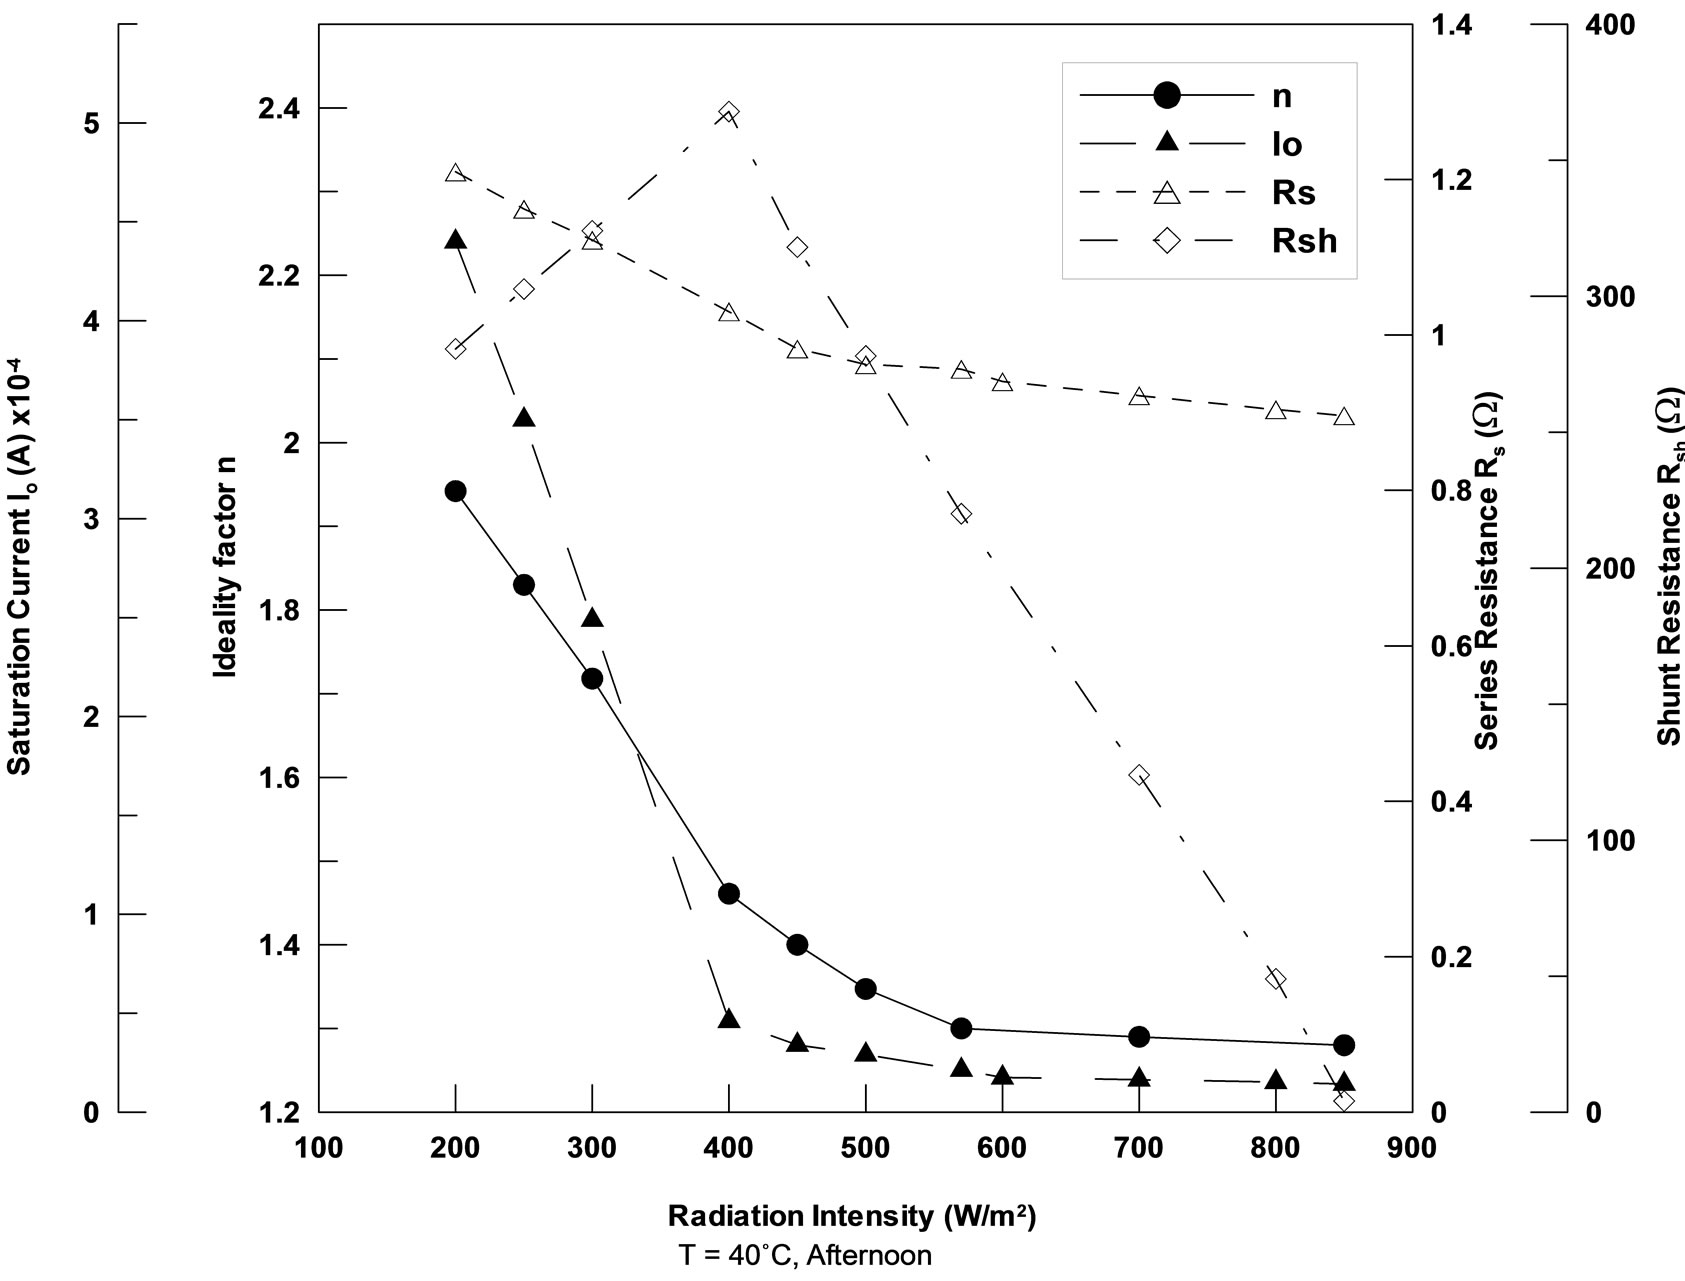
Figure 5. The module parameters variation with radiation intensity at module temperature 40˚C.
from the interruption of the long range order provided by the periodicity of the crystal. Such interruption leads to defect electronic states in the energy gap at its center and at band edges, which trap the photo-generated carriers causing recombination. For CIS solar cells and modules the values of n and Io are due to different types of recombination of photo-generated carriers or minority carriers [32]. Recombination losses in CIS don't affect the Isc only but also the Voc and the FF. Ideality factor equals to 2 is valid for recombination with the states exactly in the gap centre, while ideality factor equals to 1 is valid for recombination at the band edges [33]. The saturation current Io has a dramatic and direct effect on Voc as directly predicted from the following equation:
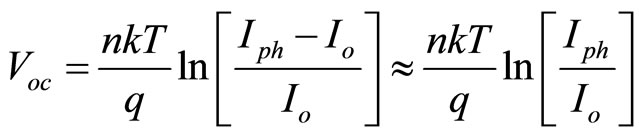 (10)
(10)
Figures 4 and 5 show that as irradiance intensity increases, n and Io decrease first sharply in the low range of radiation intensity (<400 W/m2) and this increase becomes small for irradiance values greater than 400 W/m2. This behavior is attributed to the non-radiative recombination in the space charge region which is dominant for CIS devices and this type of recombination is more effecttive at low radiation intensity and low junction voltage [34]. With increasing irradiance intensity the contribution of non-radiative space charge recombination to the total recombination processes start to decrease as n and Io values in this case are mainly due to the bulk and surface recombination mechanisms. The module parameters variation with radiation at module temperature 40˚C is presented in Figure 5. The previous observations and conclusions regarding the module parameters Rsh, Rs, n and Io obtained at 20˚C are applicable again at 40˚C. However, it is noticed that when the irradiance intensity increases, Rsh increases for irradiance values less than 400 W/m2 or decreases for irradiance values greater than 400 W/m2 but the rate of change at 40˚C is less than that at 20˚C. Also, there is a great difference between the peak values of Rsh at both temperature levels. The maximum value of Rsh at 20˚C is about 2100 W compared to about 475 W at 40˚C.
The values of the CIS module parameters shown in Figures 4 and 5 along with Isc are implemented in equation (4) to calculate the module performance parameters, i.e., Voc, FF and h. It should be mentioned that the module performance parameters obtained from IVFIT software compare well with the corresponding values obtained from the present theoretical predictions. Figures 6 and 7 show the variation of Voc, FF and module efficiency (h) with radiation intensity for temperatures 20˚C and 40˚C for the same day of measurements of Figures 4 and 5. The module efficiency h given by Equation (3) can be rewritten in the following form:
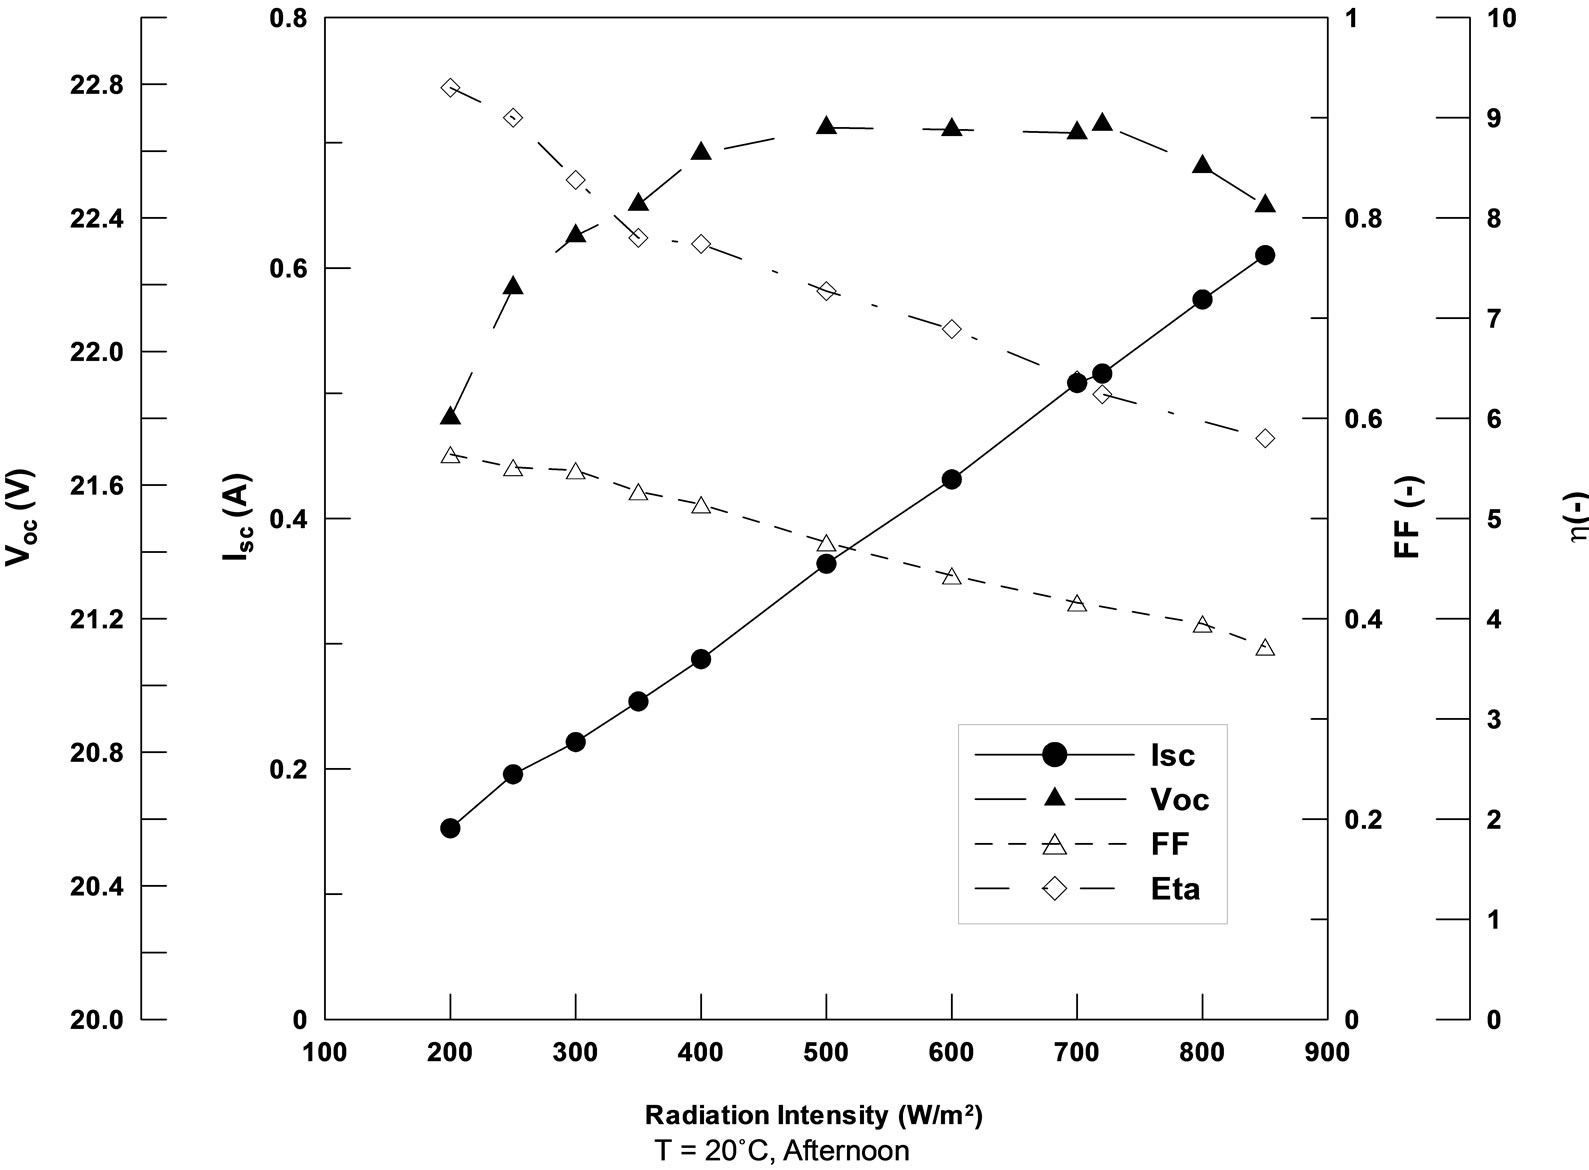
Figure 6. Variation of module performance parameters with radiation intensity at module temperature 20˚C.
 (11)
(11)
As predicted from Equation (11), Isc is linearly proportional to the irradiance, so it can be considered that it has no obvious effect on efficiency as the increase in Isc is compensated by the increase in radiation intensity. So, the decrease in efficiency with increasing irradiance level can be attributed to the combined effect of both Voc and FF. Fill factor continuously decreases at small rate with increasing irradiance level similar to the behaviour of n and Io previously discussed. On the other hand, Voc increases with irradiance intensity up to the value 400 W/m2 then decreases by a very slow rate also similar to the behaviour of n, Io and Rsh. So, as a result the efficiency h decreases continuously with irradiance level due to the combination effect of Voc and FF. The same behaviour is depicted again at high temperature level (40˚C) as illustrated by Figure 7. It is worth to mention that the effect of increasing temperature from 20˚C to 40˚C results in decrease in the value of Voc by about 8.8%. It should be mentioned that the order of precision for the predicted values of the CIS parmeters is in the range of accepted errors. Estimated errors in the present measurements are found to fluctuate somewhere around 2%, a value which is relatively reasonable compared to other published works.
5. Conclusions
An experimental setup is designed at the College of Technological Studies, Kuwait to monitor the I–V characteristics of PV modules under realistic outdoor conditions in the period from August 8, 2009 to August 10, 2010. The data obtained showed the value of monitoring PV modules over a period of time. The monitoring also yielded useful results on how the PV module performed over an extended period of time with regard to energy generating capability and operational efficiencies. Measurements are carried out to determine the I-V characteristics of copper indium diselenide (CIS) module at different radiation and temperature ranges. A theoretical model is developed to calculate the module parameters and module performance parameters. The validation of the used numerical model has been checked and results proved the reliability of the present developed numerical model. This work successfully emphasizes the importance of outdoor performance monitoring as there was a difference between outdoor measurements and indoor measurements published by the module manufacturer. Running the program code several times has allowed reaching the convergence of the equations system; then the determination of the main parameters of CIS module. Based on the results obtained, the following conclusions are drawn:
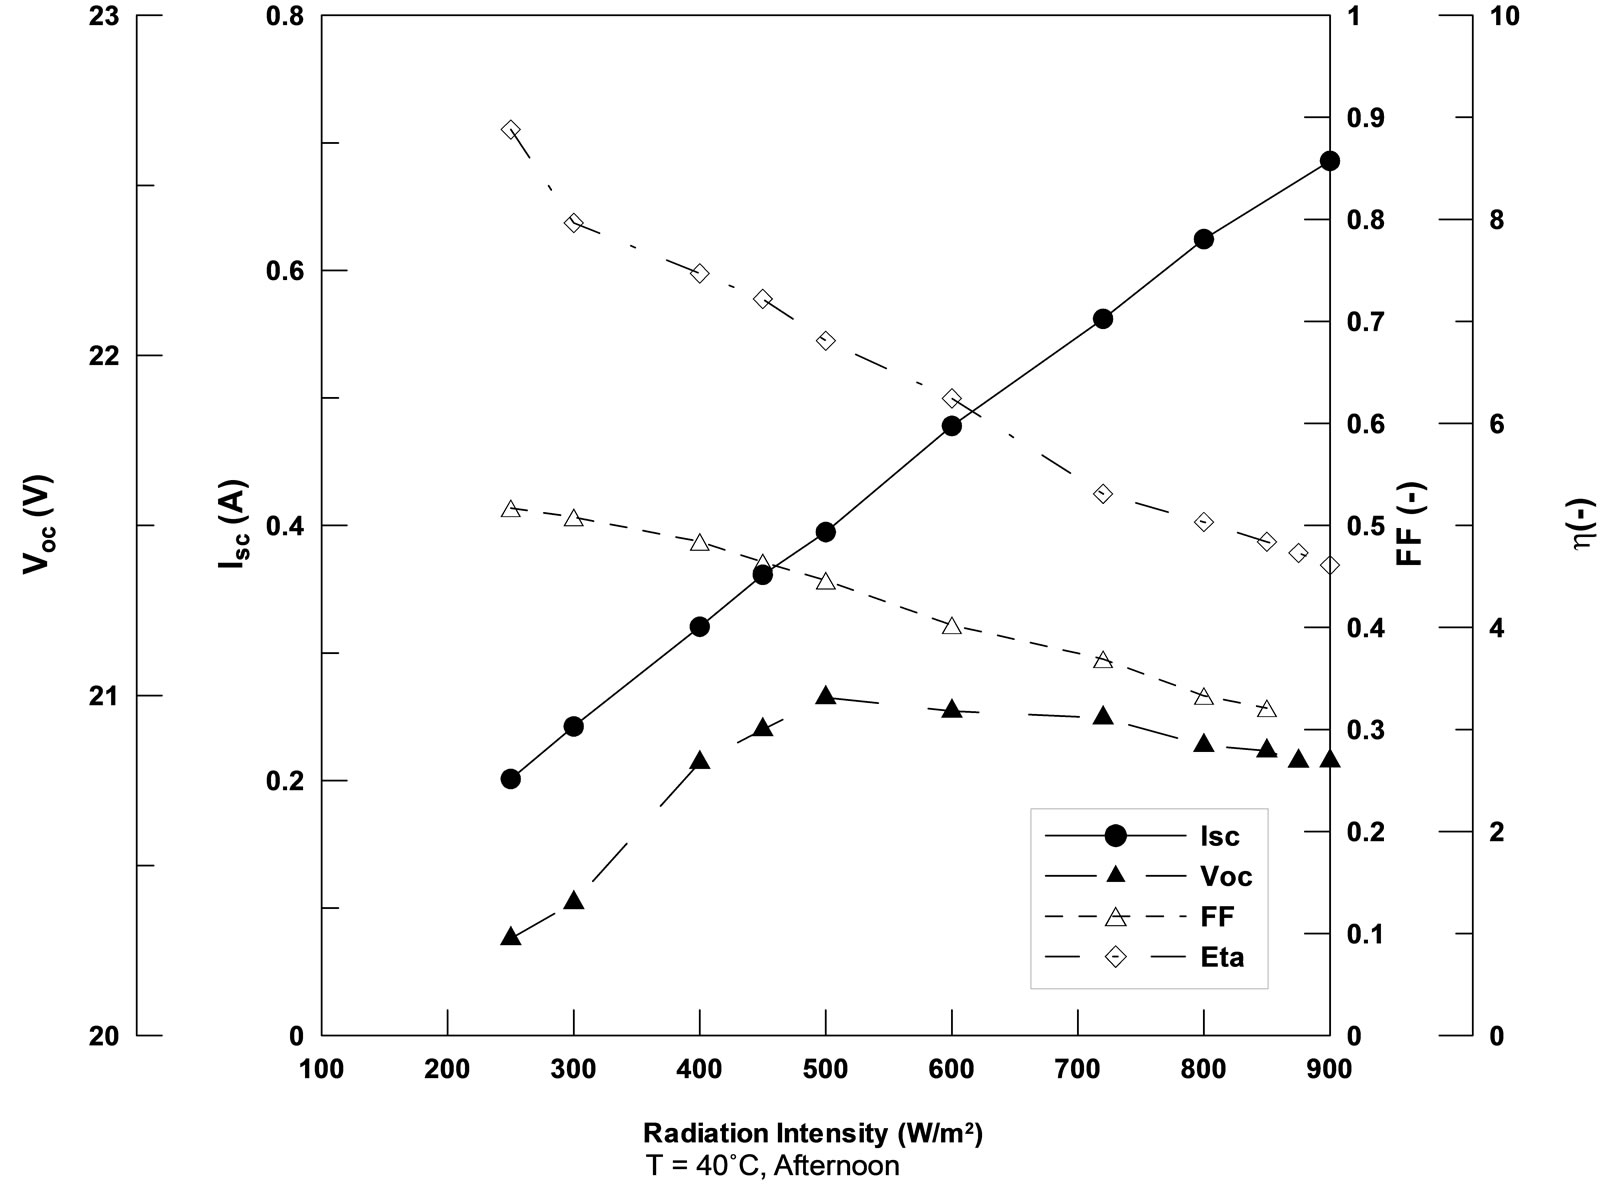
Figure 7. Variation of module performance parameters with radiation intensity at module temperature 40˚C.
• Photo-generated current linearly increase with increased irradiance.
• A comparison between the characteristics given by the developed numerical model and those obtained by outdoor measurement tests demonstrated the reliability of the developed numerical model.
• The largest drop in Voc due to about 20˚C increase in temperature is approximately 8.8% which is not compensated for by the relatively small increase in current, (2.9% in Isc), resulting in a reduction in Pmax of about 6.3%.
• The shunt resistance Rsh increases with radiation at low radiation values (<400 W/m2). While it begins to decease sharply as radiation increases at high radiation values greater than 400 W/m2.
• The series resistance decreases as the irradiance intensity increases, but with a very low rate at the two studied temperatures (20˚C and 40˚C). So, Rs has little effect on module performance in comparison with the significant effect of other module parameters.
• As irradiance intensity increases, ideality factor n and saturation current Io decrease first sharply in the low range of radiation intensity (<400 W/m2) and this decrease becomes smaller for irradiance values greater than 400 W/m2.
• There is a great difference between the peak values of Rsh at both studied temperature levels. The maximum value of Rsh at 20˚C is about 2100 W compared to 475 W at 40˚C.
• Fill factor FF continuously decreases at small rate with increasing irradiance level similar to the behaveior of n and Io. Open circuit voltage Voc increases with irradiance intensity up to 400 W/m2 then decreases by a very small rate similar to the behavior of n, Io and Rsh.
• The efficiency h decreases continuously with irradiance level due to the combined effect of Voc and FF for both studied temperatures.
• The present work did not consider the effect of variation of spectral irradiance through the day on the module parameters. This effect should be studied to accurately predict the module performance.
• The order of precision for the predicted values of the CIS parameters is in the range of accepted errors. The estimated errors fluctuate somewhere around 2%, a value which is relatively reasonable compared to previously published works.
6. Acknowledgements
The research team would like to express their sincere gratitude to The Public Authority for Applied Education and Training (PAAET) for financial support of this work under the project No. (TS-08-02).
REFERENCES
- M. Wolf and H. Rauschenbach, “Series Resistance Effects on Solar Cells Measurements,” Advanced Energy Conversion, Vol. 3, No. 2, 1963, pp.455-479. doi:10.1016/0365-1789(63)90063-8
- K. Rajkanan and J. Shewchun, “A Better Approach to the Evaluation of the Series Resistance of Solar Cells,” SolidState Electron, Vol. 22, No. 2, 1979, pp.193-197. doi:10.1016/0038-1101(79)90112-6
- S. K. Agarwal, R. Muralidharan, Amit Agarwal, V. K. Tiwary and S. C. Jain, “A New Method for the Measurement of Series Resistance of Solar Cells,” Journal of Physics D: Applied Physics, Vol. 14, No. 9, 1981, pp. 1643-1646. doi:10.1088/0022-3727/14/9/011
- G. L. Araujo and E. Sanchez, “A New Method for Experimental Determination of the Series Resistance of a Solar Cell,” IEEE Transactions on Electron Devices, Vol. 29, No. 10, 1982, pp. 1511-1513. doi:10.1109/T-ED.1982.20906
- M. Chegaar, Z. Ouennouchi and A. Hoffmann, “A New Method for Evaluating Illuminated Solar Cell Parameters,” Solid-State Electron, Vol. 45, No. 2, 2001, pp. 293- 296. doi:10.1016/S0038-1101(00)00277-X
- E. E. van Dyk, E. L. Meyer, F. J. Foster and A. W. R. Leitch, “Long-Term Monitoring of Photovoltaic Devices,” Renewable Energy, Vol. 25, No. 2, 2002, pp. 183- 197. doi:10.1016/S0960-1481(01)00064-7
- E. Radziemska, “Dark I-U-T Measurements of Single Crystalline Silicon Solar Cells,” Energy Conversion Management, Vol. 46, 2005, pp. 1485-1494.
- M. Priyanka and S. N. Singh, “A New Method for the Measurement of Series and Shunt Resistance of Silicon Solar Cells,” Solar Energy Materials and Solar Cells, Vol. 46, No. 9-10, 2007, pp. 137-142. doi:10.1016/j.enconman.2004.08.004
- K. I. Ishibashi, Y. Kimura and M. Niwano, “An Extensively Valid and Stable Method for Derivation of All Parameters of a Solar Cell from a Single Current-Voltage Characteristics,” Journal of Applied Physics, Vol. 103, No. 9, 2008, pp. 094507-094513. doi:10.1063/1.2895396
- G. P. Smestad et al., “Reporting Solar Cell Efficiencies in Solar Energy Materials and Solar Cells,” Solar Energy Materials and Solar Cells, Vol. 92, No. 4, 2008, pp. 371- 373. doi:10.1016/j.solmat.2008.01.003
- S. Mohammed and M. Ahmed, “Outdoor Testing of Photovoltaic Arrays in the Saharan Region,” Renewable Energy, Vol. 33, No. 12, 2008, pp. 2516-2524. doi:10.1016/j.renene.2008.02.016
- S. N. Singh and M. Husain, “Effect of Illumination Intensity on Cell Parameters of a Silicon Solar Cell,” Solar Energy Materials and Solar Cells, Vol. 94, No. 9, 2010, pp. 1473-1476. doi:10.1016/j.solmat.2010.03.018
- T. U. Townsend, “A Method for Estimating the LongTerm Performance of Direct-Coupled Photovoltaic System,” Mechanical Engineering, University of Wisconsin-Madison, Madison, 1989.
- S. A. Klein et al., “TRNSYS Users Manual,” Version 14.1, University of Wisconsin-Madison, Engineering Experimental Station, 1994.
- A. Ortiz-Conde, F. J. G. Sanchez and J. Muci, “New Methods to Extract Model Parameters of Solar Cells from the Explicit Analytic Solutions of Their Illuminated I-V Characteristics,” Solar Energy Materials and Solar Cells, Vol. 90, 2006, pp. 352-361.
- W. De Soto, S. A. Klein and W. A. Beckman, “Improvement and Validation of a Model for Photovoltaic Array Performance,” Solar Energy, Vol. 80, No. 1, 2006, pp. 78-88. doi:10.1016/j.solener.2005.06.010
- F. Almonacid, C. Rus, L. Hontoria, M. Fuentes and G. Nofuentes, “Characterisation of Si-Crystalline PV Modules by Artificial Neural Networks,” Renewable Energy, Vol. 34, No. 4, 2009, pp. 941-949. doi:10.1016/j.renene.2008.06.010
- K. Ishaque, Z. Salam and H. Taheri, “Simple and Accurate Two-Diode Model for Photovoltaic Modules,” Solar Energy Materials and Solar Cells, Vol. 95, No. 2, 2011, pp. 586-594. doi:10.1016/j.solmat.2010.09.023
- A. R. Burgers, J. A. Eikelboom, A. Schonecker and W. C. Sinke, “Improved Treatment of the Strongly Varying Slope in Fitting Solar Cell I-V Curves,” Proceedings 25 the IEEE PVSC Conference, Washington DC, 1996, pp. 569-572.
- S. A. Klein and W. A. Beckman, “PV f-Chart User’s Manual: f-Chart Software,” Middleton, EI Paso, 1983.
- D. F. Menicucci and J. P. Fernandez, “User’s Manual for PVFORM,” 1988.
- Stand-Alone Photovoltaic Systems, “A Handbook of Recommended Design Practices,” Sandia National Laboratories, Albuquerque, SAND87-7023, 1988.
- M. C. A. Garcia and J. L. Balenzategui, “Estimation of Photovoltaic Module Yearly Temperature and Performance Based on Nominal Operation Cell Temperature Calculations,” Renewable Energy, Vol. 29, No. 12, 2004, pp. 1997-2010. doi:10.1016/j.renene.2004.03.010
- D. King, J. Kratochvil and W. Boyson, “Temperature Coefficients for PV Modules and Arrays: Measurement Methods, Difficulties, and Results,” 26th IEEE PV Specialists Conference, Anaheim, 29 September - 3 October 1997, pp. 1183-1186.
- E. Skoplaki and J. Lyvos, “Operating Temperature of Photovoltaic Modules: A Survey of Pertinent Correlations,” Renewable Energy, Vol. 34, No. 1, 2009, pp. 23- 29. doi:10.1016/j.renene.2008.04.009
- M. Priyanka and S. N. Singh, “A New Method for the Measurement of Series and Shunt Resistance of Silicon Solar Cells,” Solar Energy Materials and Solar Cells, Vol. 91, No. 2-3, 2007, pp. 137-142. doi:10.1016/j.solmat.2006.07.008
- D. W. Cunningham, A. Parr, J. Posbic and B. Poulin, “Performance Comparison between BP Solar Mono and Traditional Multicrystalline Modules,” 23rd European PV Solar Energy Conference Proceedings, Valencia, 1-5 September 2008, pp. 2829-2833.
- E. E. Dyk and E. L. Meyer, “Analysis of the Effect of Parasitic Resistances on the Performance of Photovoltaic Modules,” Renewable Energy, Vol. 29, No. 3, 2004, pp. 333-344. doi:10.1016/S0960-1481(03)00250-7
- M. Priyanka, S. N. Singh and M. Husain, “Temperature Dependence of I-V Characteristics and Performance Parameters of Silicon Solar Cells,” Solar Energy Materials and Solar Cells, Vol. 92, No. 12, 2008, pp. 1611-1616. doi:10.1016/j.solmat.2008.07.010
- V. Perraki and A. Gianniou, “The Effect of the Series Resistance on the Photovoltaic Properties of CIS Solar Cells,” 25th EUPVSEC, Valencia, 6-10 Septemper, 2010.
- J. H. Werner, J. Mattheis and U. Rau, “Effeciency Limitations of Polycrystalline Thin Film Solar Cells: Case of (In, Ga)Se2,” Thin Solid Films, Vol. 480-481, No. 1, 2005, pp. 399-409. doi:10.1016/j.tsf.2004.11.052
- U. Rau, K. Taretto and S. Siebentritt, “Grain Boundaries in Cu (In, Ga) (Se, S) 2 Thin Filmsilar Cells,” Applied Physics A, Vol. 96, No. 1, 2009, 221-2234. doi:10.1007/s00339-008-4978-0
- S. Siebentritt, “What Limits the Efficiency of Chalcopyrite Solar Cells?” Solar Energy Materials and Solar Cells, Vol. 95, No. 6, 2011, pp. 1471-1476. doi:10.1016/j.solmat.2010.12.014
- F. Khan, S. N. Singh and M. Husain, “Effect of Illumination Intensity on Cell Parameters of a Silicon Solar Cell,” Solar Energy Materials and Solar Cells, Vol. 94, No. 9, 2010, pp. 1473-1476. doi:10.1016/j.solmat.2010.03.018