Journal of Water Resource and Protection
Vol. 2 No. 4 (2010) , Article ID: 1686 , 9 pages DOI:10.4236/jwarp.2010.24041
Lake Water Monitoring Data Assessment by Multivariate Statistics
1Chair of Analytical Chemistry, Faculty of Chemistry, University of Sofia “St. Kl. Okhridski”, Sofia, Bulgaria
2Laboratory of Environmental Physics, Georgi Nadjakov Institute of Solid State Physics, Bulgarian Academy of Sciences, Sofia, Bulgaria
3Chair of Physical Chemistry, Faculty of Chemistry, University of Sofia “St. Kl. Okhridski”, Sofia, Bulgaria
E-mail: vsimeonov@chem.uni-sofia.bg, {poly-sim, lovcinov}@issp.bas.bg, stsakovski@chem.uni-sofia.bg
Received November 13, 2009; revised December 3, 2009; accepted January 21, 2010
Keywords: Lake Water, Chemometrics, Water Quality, Pollution
ABSTRACT
The application of multivariate statistical methods to high mountain lakes monitoring data has offered some important conclusions about the importance of environmetric approaches in lake water quality assessment. Various methods like cluster analysis and principal components analysis were used for classification and projection of the data set from a big number of lakes from Pirin Mountain in Bulgaria. Additionally, self-organizing maps of Kohonen were constructed in order to solve some classification tasks. An effort was made to relate the maps with the input data in order to detect classification patterns in the data set. Thus, discrimination chemical parameters for each pattern (cluster) identified was found, which enables better interpretation of the ecological state of the system. A methodology for application of combination of different environmetric methods was suggested as a pathway to interpret high mountain lake waters monitoring data.
1. Introduction
The careful monitoring of natural water systems like river streams, lakes, wells, and underground sources is a very responsible task. Usually, a set of chemical and physicochemical parameters reflecting the surface or underground water quality are carefully analysed and the results obtained are compared to certain threshold values in order to decide if the water quality meets the quality desired. The choice of quality parameters is normally standardized and described in various instructions and directives for individual countries or unions like EU [1-4]. Recently, a very specific attention requires a different type of water quality parameter called “toxicity” (“ecotoxicity”) [5-7]. It is also important to note that lake waters are important element of the aquatic ecosystems. They constitute ecological niches (especially in combination with the lake bottom sediments) supporting not only fish but also benthic organisms, i.e. animals and plants living on the bottom of bodies of water, and are a source of nutrients for aquatic organisms such as small invertebrates and protozoans. An assessment of the effect of pollution on life in lake water bodies requires also monitoring of bottom sediment samples both for chemical, physicochemical, and toxicity parameters. They are very useful material for various environmental studies because they act as sorption column and provide a clear image of all events taking place in the overlying water layer.
Very often, however, the monitoring data are considered in a “univariate” way—each parameter separately. In the reality the state of an ecosystem is depending simultaneously on many factors and parameters. Therefore, these systems are multivariate in nature. That is why the classification, modeling and interpretation of the monitoring data sets have to be performed by the use of the chemometrics and environmetrics [8-14], where the references given are only a tiny part of many environmetric studies. The specific point in the studies of lake waters is that there is lack of intelligent data analysis of the monitoring sets comprising of different water quality parameters simultaneously interpreted.
The aim of the present chapter is to demonstrate the role of environmetric classification, modeling, and interpretation of monitoring data from the lake systems of Pirin Mountain, Bulgaria.
2. Chemometric Methods
The modern chemometrics is a branch of chemistry (very often related to analytical chemistry) which deals with the application of mathematical and statistical methods in order to evaluate, classify, model, and interpret chemical and analytical data, to optimize and model chemical and analytical processes and experiments and to extract a maximum of chemical and analytical information from experimental data. When the methods of chemometrics are applied to data sets obtained by monitoring of various environmental compartments (surface water, atmosphere, soil, sediments, biota etc) the term environmetrics is used to stress the information ability of the methods to gain specific information from samples of the total environment.
Very important methods of multivariate statistics employed in environmetrics are cluster analysis, principal components analysis and self-organizing maps of Kohonen which will be briefly presented and applied.
Cluster analysis (CA) is an exploratory data analysis tool for solving classification problems [15]. CA enables objects stepwise aggregation according to the similarity of their features. As a result hierarchically or non-hierarchically ordered clusters are formed. Primary standardization of features becomes necessary to avoid effects of dimensionality on the classification results. There are a variety of different measures of inter-cases distances and inter-cluster similarities and distances to use as criteria when merging nearest clusters into broader groups or when considering the relation of an object to a cluster. The most applied is the Euclidean distance (after the standardization of the raw data).
In case of CA one task is related with determination of similarity between measured objects as well as similarities between the features describing the objects. As in case of distance measure various algorithms (linkage techniques) are available to decide on the number of clusters. Very popular linkage algorithm in hierarchical clustering problems is Ward’s method [15].
In hierarchical agglomerative clustering the graphical output of the analysis is usually a dendrogram—a tree-like graphics, which indicates the linkage between the clustered objects with respect to their similarity (distance measure). For practical reasons the Sneath index of cluster significance is widely used. It represents this significance on two levels of distance measure D/Dmax relation: 1/3Dmax and 2/3Dmax. Only clusters remaining compact after breaking the linkage at these two distances are considered significant and are object of interpretation.
Principal Component Analysis (PCA) seems to be the most widespread multivariate chemometric technique and is a typical display method (also known as eigenvector analysis, eigenvector decomposition or Karhunen-Loéve expansion). It enables revealing the “hidden” structure of the data set and helps to explain the influence of latent factors on the data distribution [16,17]. PCA transforms the original data matrix into a product of two matrices, one of which contains the information about the objects and the other about the features. The matrix characterizing objects contains the scores (understood as projection) of objects on principal components (PCs). The other one, characterizing features is a square matrix and contains the set of eigenvectors (understood as weights, in PCA terminology called “loadings”) of the original features in each PC.
Some important features of PCA could be summarized as follows. The principal components axes (the axes of the hidden variables) are orthogonal to each other. Most of the variance of the data is contained in the first principal component. In the second component there is more information than in the third one etc. For interpretation of the projected data both the score and the loading vectors are plotted. In the score plots, the grouping of objects can be recognized. A loading plot reveals the importance of the individual variables with respect to the principal component model.
A very important task in PCA is the estimating the number of principal components necessary for a particular PC model. Several criteria exist in determining the number of components in the PCA model: percentage of explained variance, eigenvalue—one criterion, Scree— test, cross validation [16,17].
Interpretation of the results of PCA is usually carried out by visualization of the component scores and loadings.
Self Organizing Map (SOM) algorithm has been proposed by Kohonen in 1980 [18]. It is a neural-network based model which shares, with the conventional ordination methods, the basic idea of displaying a high-dimensional signal manifold onto a much lower dimensional network in an orderly fashion (usually 2D space). The most common shape of the Kohonen map is a rectangular grid with the number of hexagonal nodes.
When a plenty of features is considered it is difficult to compare all maps for all features and thus becomes necessary to find similarity between them, and simultaneously, in the cases’ space and classify them into clusters. Input features’ planes (e.g. variables) could be visualized on a summary SOM map (called also as unified distance matrix or U-matrix) to show the contribution of each feature in the self-organization of the map. U-matrix visualizes distances between neighboring map units, and helps to identify cluster structure of the map. The U-matrix joined with features’ planes can be effectively applied for assessment of inter-features and inter-cases relations. Finally, the best classification with the lowest Davies-Bouldwin index should be chosen (it is a function of the ratio of the sum of within-cluster scatter and between-cluster separation).
Main advantages of SOM algorithm application are: Semi-quantitative information about the distribution of a given feature in the space of the cases; visualization of similarity between positive as well as negative correlated features; visualization and classification of “outliers” i.e. those features or cases which do not belong to a wellorganized, homogeneous populations; SOM is noise tolerant (this property is highly desirable when site-measured data are used).
3. Results and Discussion
The application of the multivariate statistical methods described above as one of the most important tool in assessment of lake water quality can be illustrated by specific case studies. Thus, the classification, data projection, modeling and interpretation of lake water monitoring data sets becomes understandable and turns to be a pattern to follow in lake pollution research.
The data was collected during expeditions in 2001 and 2002 for big number of lakes located in Pirin Mountain, which is one of the highest mountains in Bulgaria. The sampling sites and their heights are indicated in Table 1. The sampling period was between May and October. The sampling itself was performed on the lake surface approximately 2 m from the costal line. The water samples (about 100 mL) were placed in polyethylene flasks. The chemical analysis was carried out within 4 days after sampling at Faculty of Chemistry, University of Sofia. Altogether eleven chemical parameters (major cations and anions like sodium, potassium, calcium, magnesium, chloride, sulfate, nitrate, hydrogen carbonate) were analysed by electrothermal atomic absorption spectrometry and ion chromatography as well as pH (potentiometrically), conductivity (conductometrically), water temperature, and dissolved matter (by summing up of chemical concentrations). Due to the rapid changes of some parameters like pH, temperature, conductivity their determination was done directly at the sampling site by the use of portable instruments. The number of lakes involved in this study was over forty. It is worth to mention that water samples were taken not only from the lakes but also from rivers and springs in the vicinity of the lakes in order to obtain a more realistic estimation of the water quality and of the various natural and anthropogenic impacts.
The data sets from the lakes from the two mountains were classified, modeled and interpreted by the use of cluster analysis, principal components analysis and self-organizing maps of Kohonen. The goal of the environmetric interpretation was to identify groups of similarity between the lakes, to find relationship between the chemical parameters for the lake water quality, to detect hidden factors responsible for the data structure as well as to reveal discriminating chemical parameters, which
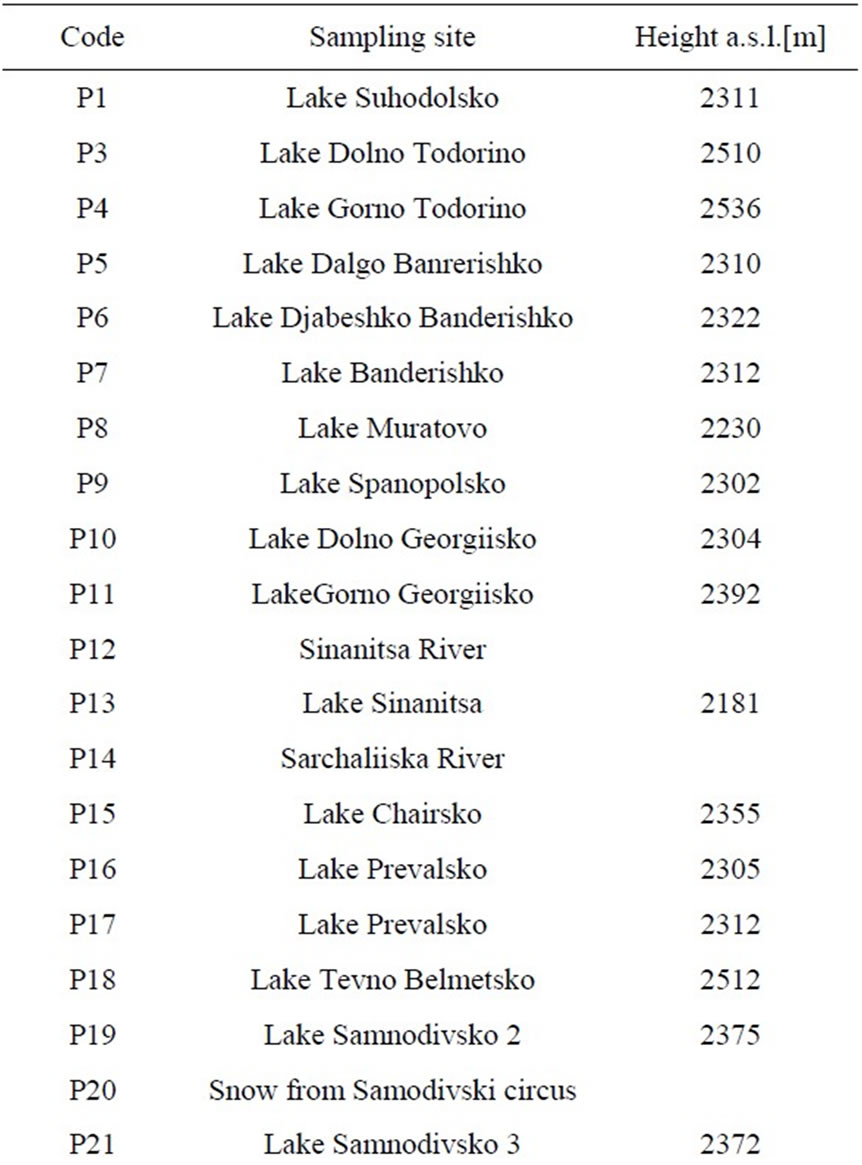
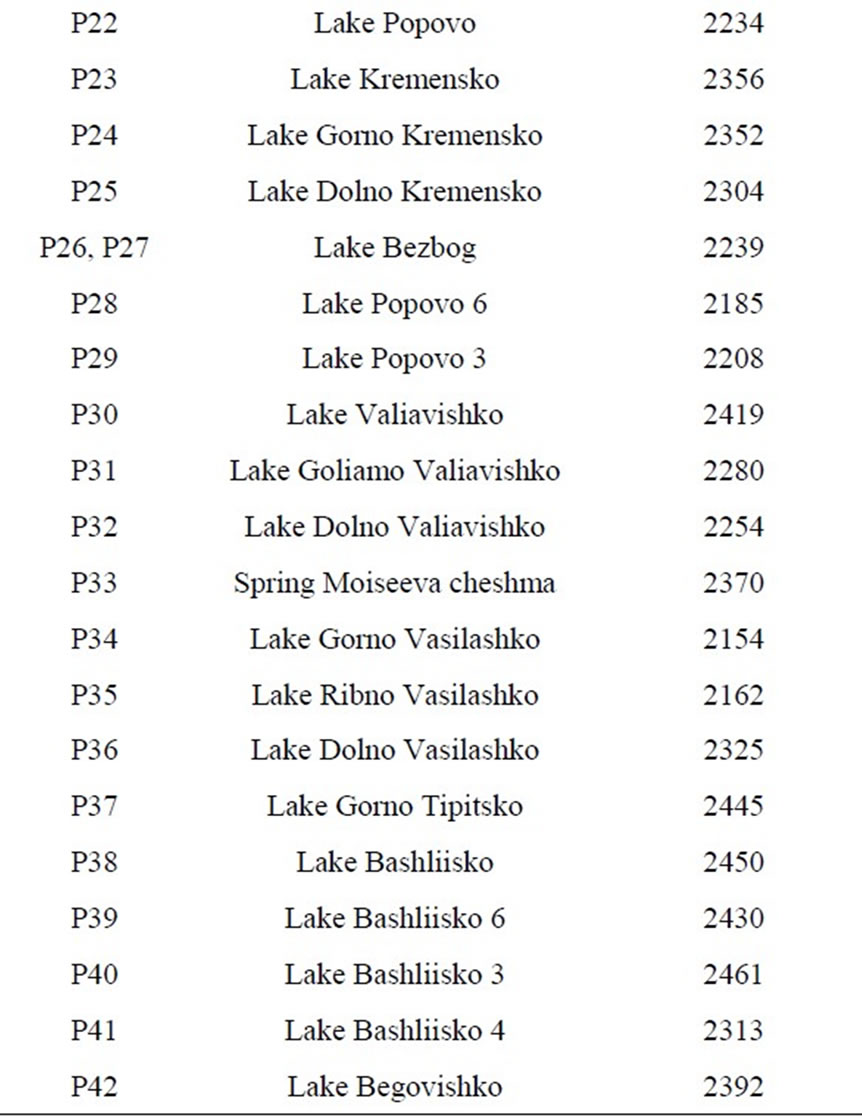
Table 1. Short description of the lakes in Pirin subject to assessment.
determine the separation of the lakes in different groups of similarity (or dissimilarity).
The initial data set for the samples from Pirin lakes includes 74 objects (sampling locations and sampling periods). No normal distribution of data (for each of the variables) is found, which means that the input data were subject of standardization before applying multivariate statistics (Table 2).
The first step in the classification of the monitoring data was clustering of the sampling sites (Ward’s method of linkage, squared Euclidean distance as similarity measure, z-transformation of data and check of the cluster significance by the Sneath index). The hierarchical dendrogram is shown in Figure 1.
It is readily seen that a good homogeneity of the water quality for all lakes is found. There is a tiny group of outliers (for the more strict Sneath’s criterion of 2/3Dmax) mostly from the region of Lake Sinanitsa and Sinanitsa River characterized by quite specific lithoral composition.
In Figure 2 the hierarchical dendrogram for linkage of water quality parameters is presented. Four clusters are formed as follows: (nitrate, chloride, sulfate), (potassium, sodium), (calcium, magnesium, conductivity), (hydrogen carbonate, dissolved matter) and pH as an outlier. It could be concluded from the cluster analysis results that factors like water hardness, water acidity, salt content and turbidity are responsible for the relative separation of the sampling events. However, this information is not convincing enough to make final decisions on the lake water quality.
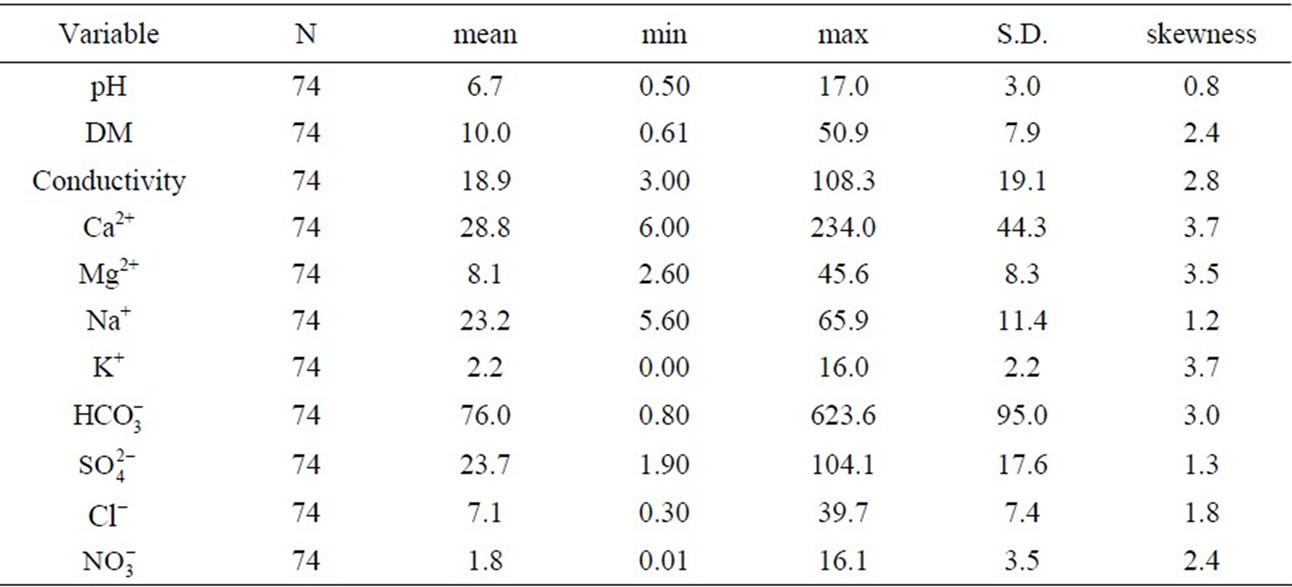
Table 2. Basic statistics for all Pirin lakes.
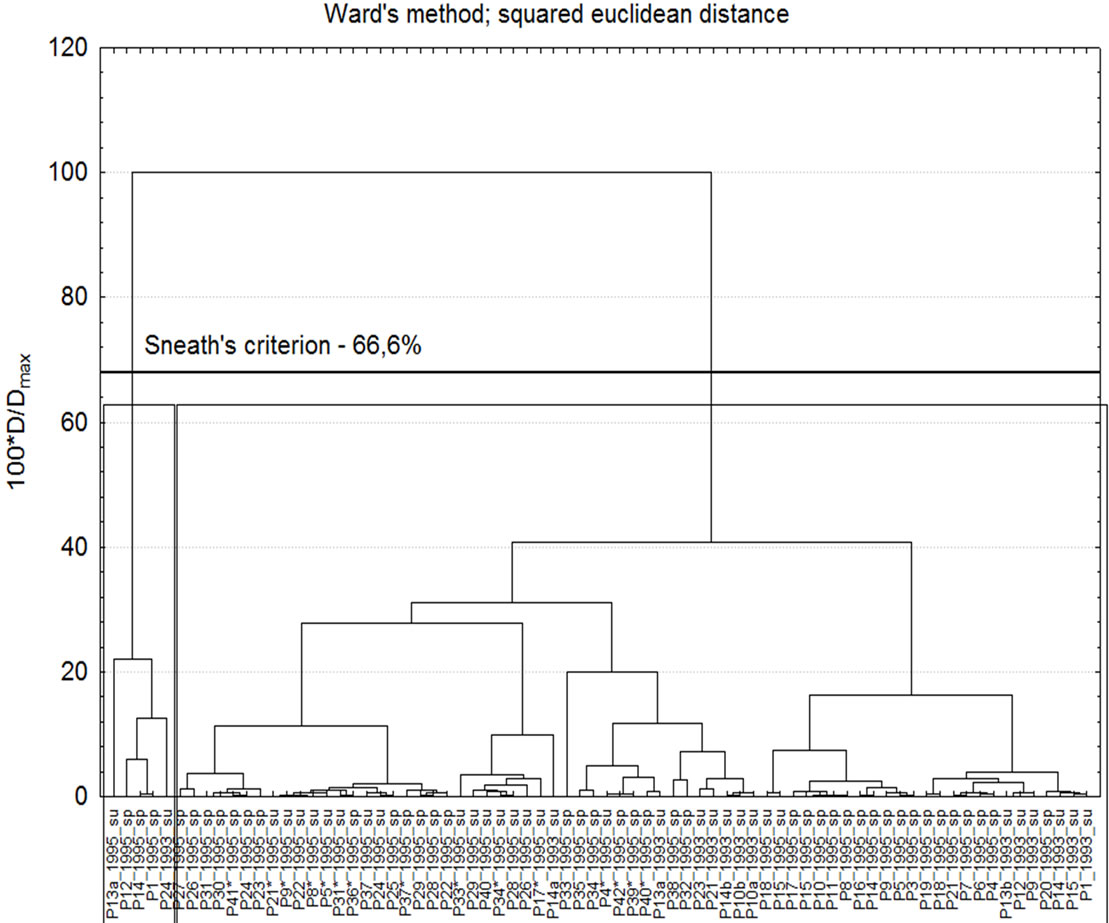
Figure 1. Hierarchical dendrogram for sampling locations.
In order to gain additional information from the data set PCA was performed on the normalized input data. Firstly, the factor scores plot will be considered (Figure 3).
The homogeneity of the data (very close levels of most of the chemical parameters characterizing the lake water quality) is indicated again by the big cloud of similar objects. The outliers marked are from the specific dolomite circus where the lakes Sinanitsa, Suhodolsko and Gorno Kremensko are located. Again, the separation is due to a geographical (natural) rather than anthropogenic impact.
Figure 4 (PC1 vs. PC2) for the factor loadings (normalized data, Varimax rotation mode) indicates the grouping of the chemical variables with respect to the identified latent factors. It is seen that high correlation along PC1 axis is found for chloride, sulfate and hydrogen carbonate and along PC2 axis—for calcium, magnesium, conductivity and dissolved matter. These results slightly contradict those found by the classification with cluster analysis and that is why a more careful inspection of the PCA results is needed.
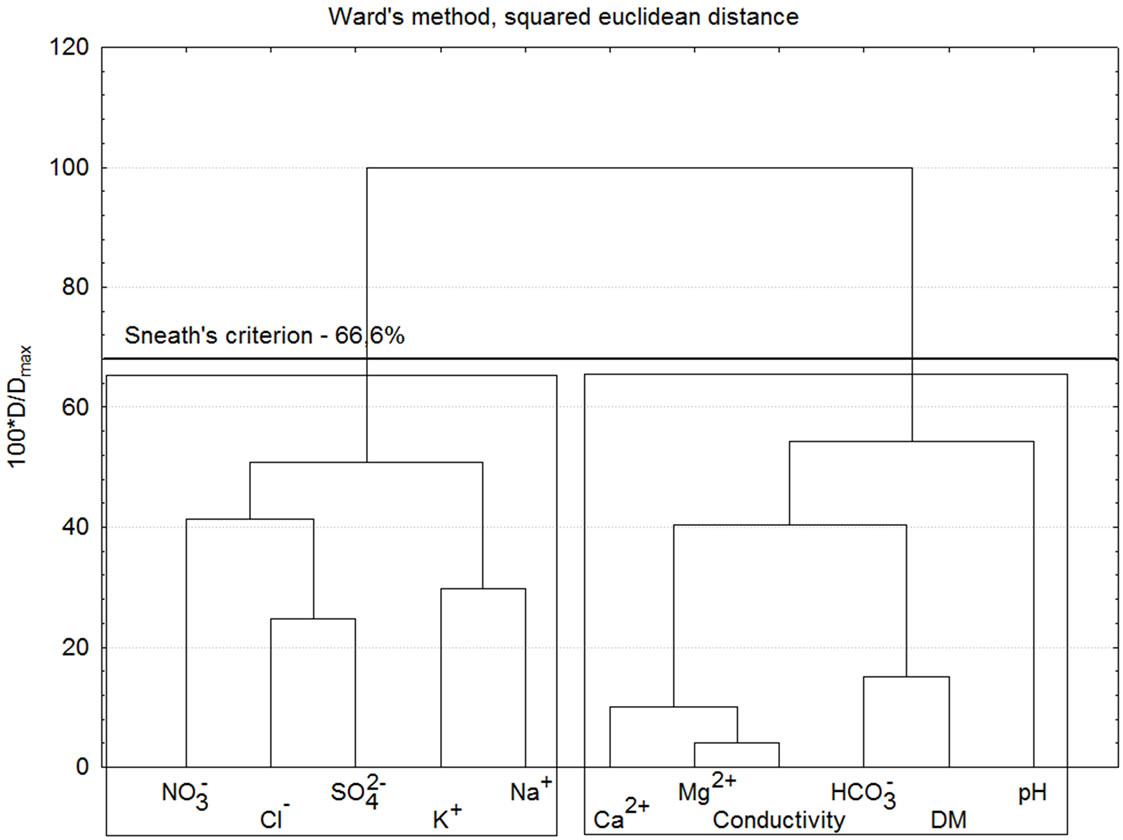
Figure 2. Hierarchical dendrogram for variables.
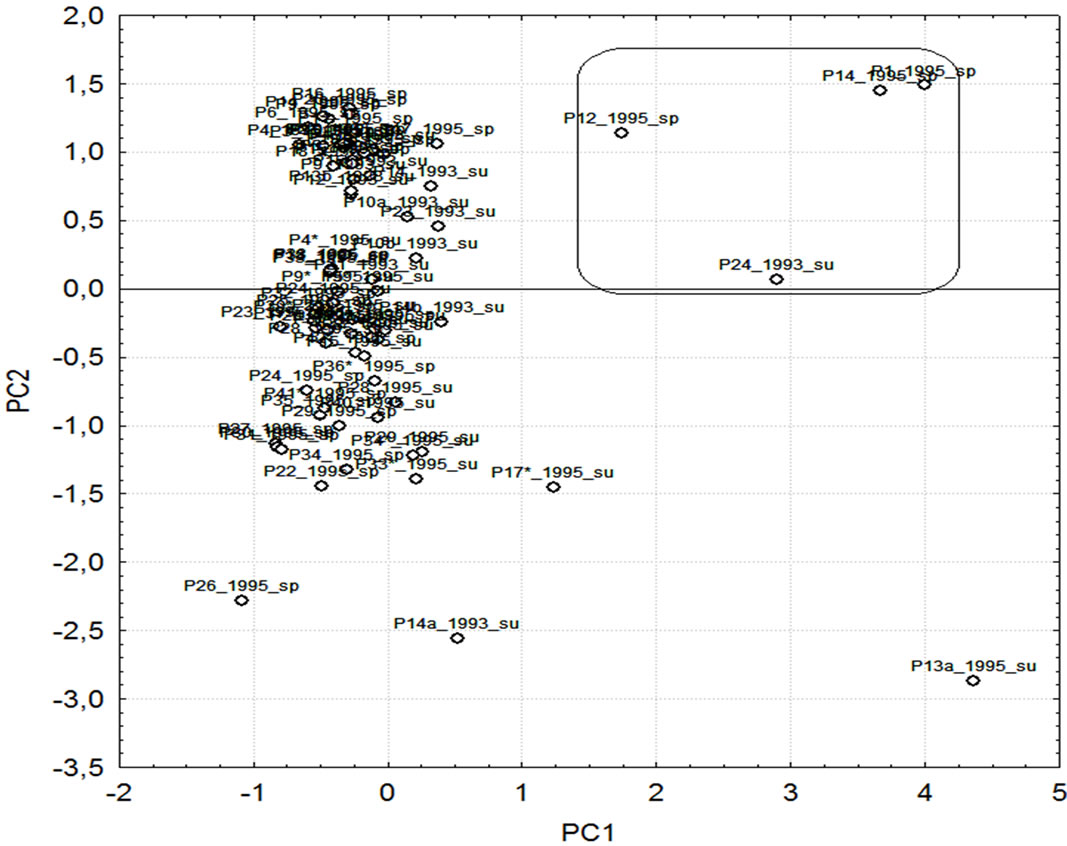
Figure 3. Factor scores plot (PC1 vs. PC 2).
In Table 3 the factor loadings for the identified four latent factors are presented. These four factors explain over 75% of the total variance of the system. The first one could be conditionally named “water hardness” factor since it indicated high correlation between calcium, magnesium, conductivity, and dissolved matter. The second latent factor is related to hydrogen carbonate, sulfate and chloride and, logically, its conditional name might be “anthropogenic impact” since it indicates possible pollution by atmospheric transfer of secondary emissions. The third factor should be attributed to processes of lake water acidification by the negative correlation between pH and nitrate.
The fourth and the last latent factor is characterized by high (statistically significant loadings) for sodium and potassium and could be conditionally named “salt” factor.
The separation of several outliers by CA and PCA and the identification of the latent factors responsible for the data structure could be improved and completed by data classification using SOM. In Figure 5 the self-organizing maps for all variables and all sampling events are shown. Similarities detected by Ca and PCA are also obvious on some of the maps—e.g. conductivity, calcium, magnesium, and dissolved matter maps reveal one and the same pattern—the highest concentration levels are grouped in the upper part of the maps.
In Figure 6 the SOM grouping of the variables is presented. The grouping is slightly different as compared to the PCA results or CA classification. Very stable (the same for all classification approaches) is the group consisting of calcium, magnesium, dissolved matter, and conductivity. This is an important indication for the role of this relationship for the lake water quality assessment of Pirin region. In Figure 6 one could detect similarity between hydrogen carbonate and sodium (not with sulfate and chloride), which is rather an indication for lithoral impact than acidification one. Thus, the different types of classification of the monitoring data indicate possibly different pathways in correlation between the water quality parameters and, parallel to it, the stable for all classification patterns.
Very important step is to divide the data set into significant clusters with their spatial vicinity (possible only by SOM classification) and, further, to detect the discriminate parameters for each one of the clusters formed. In Figure 7 the optimal number of clusters and the respective hit diagram are shown.
For all monitoring data from Pirin lakes three clusters are formed. Their content can be easily determined along with the discriminating tracers for each one of them (Figure 8).
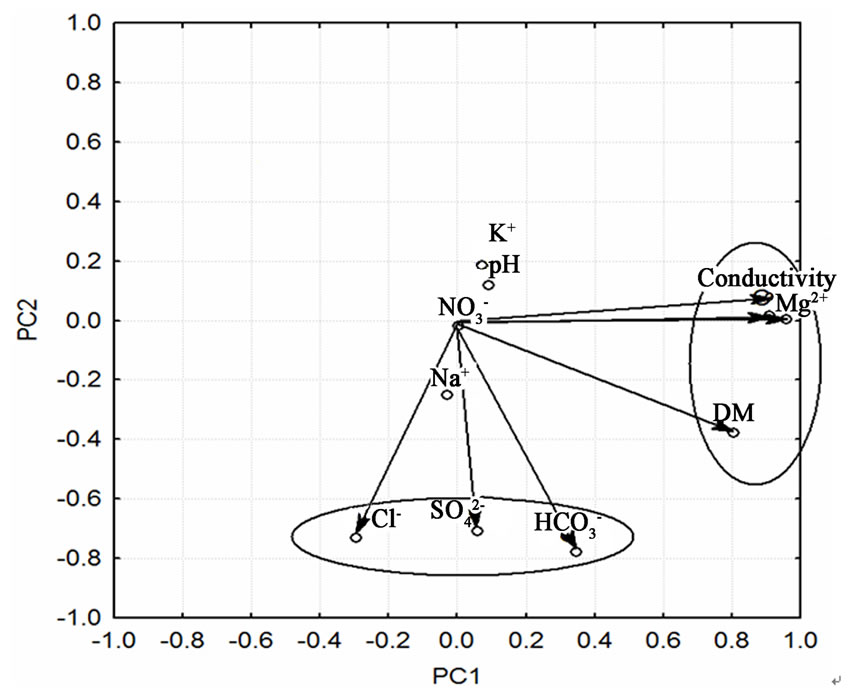
Figure 4. Factor loadings plot (PC1 vs. PC 2).
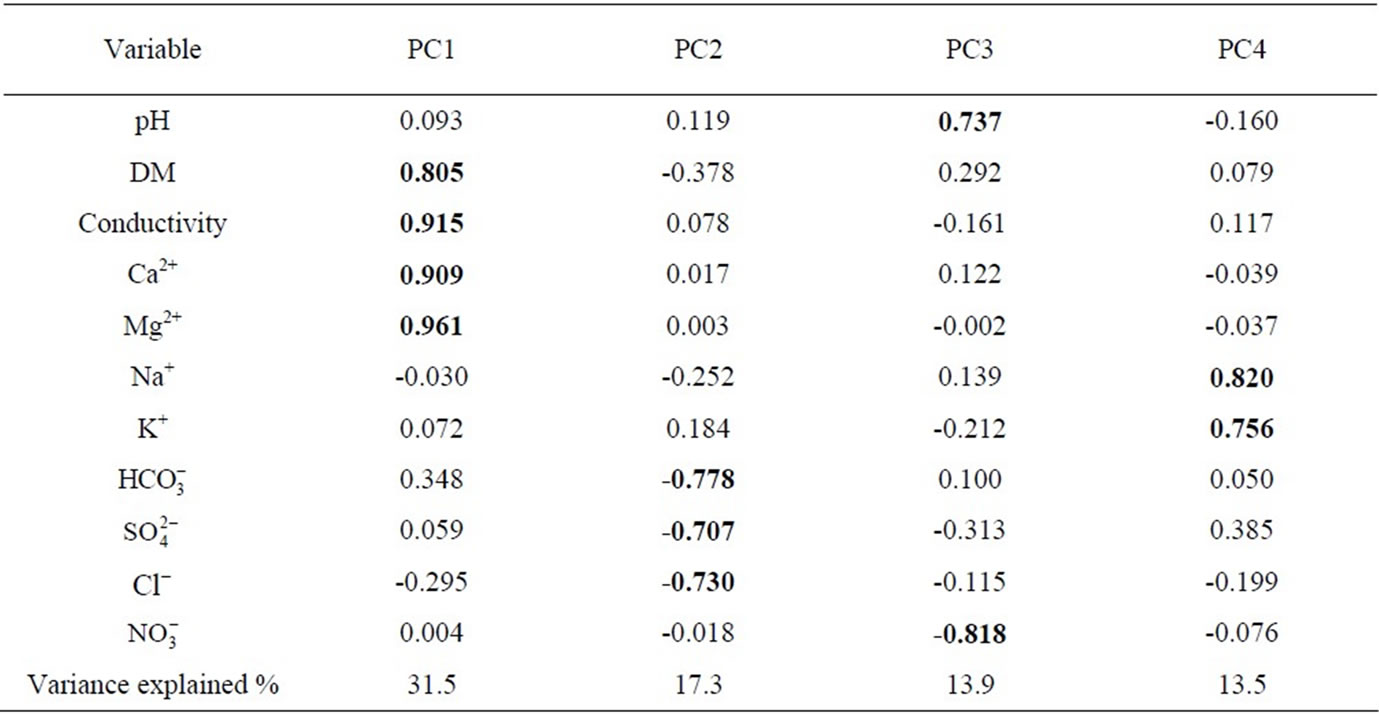
Table 3. Factor loadings(normalized Varimax Rotation).
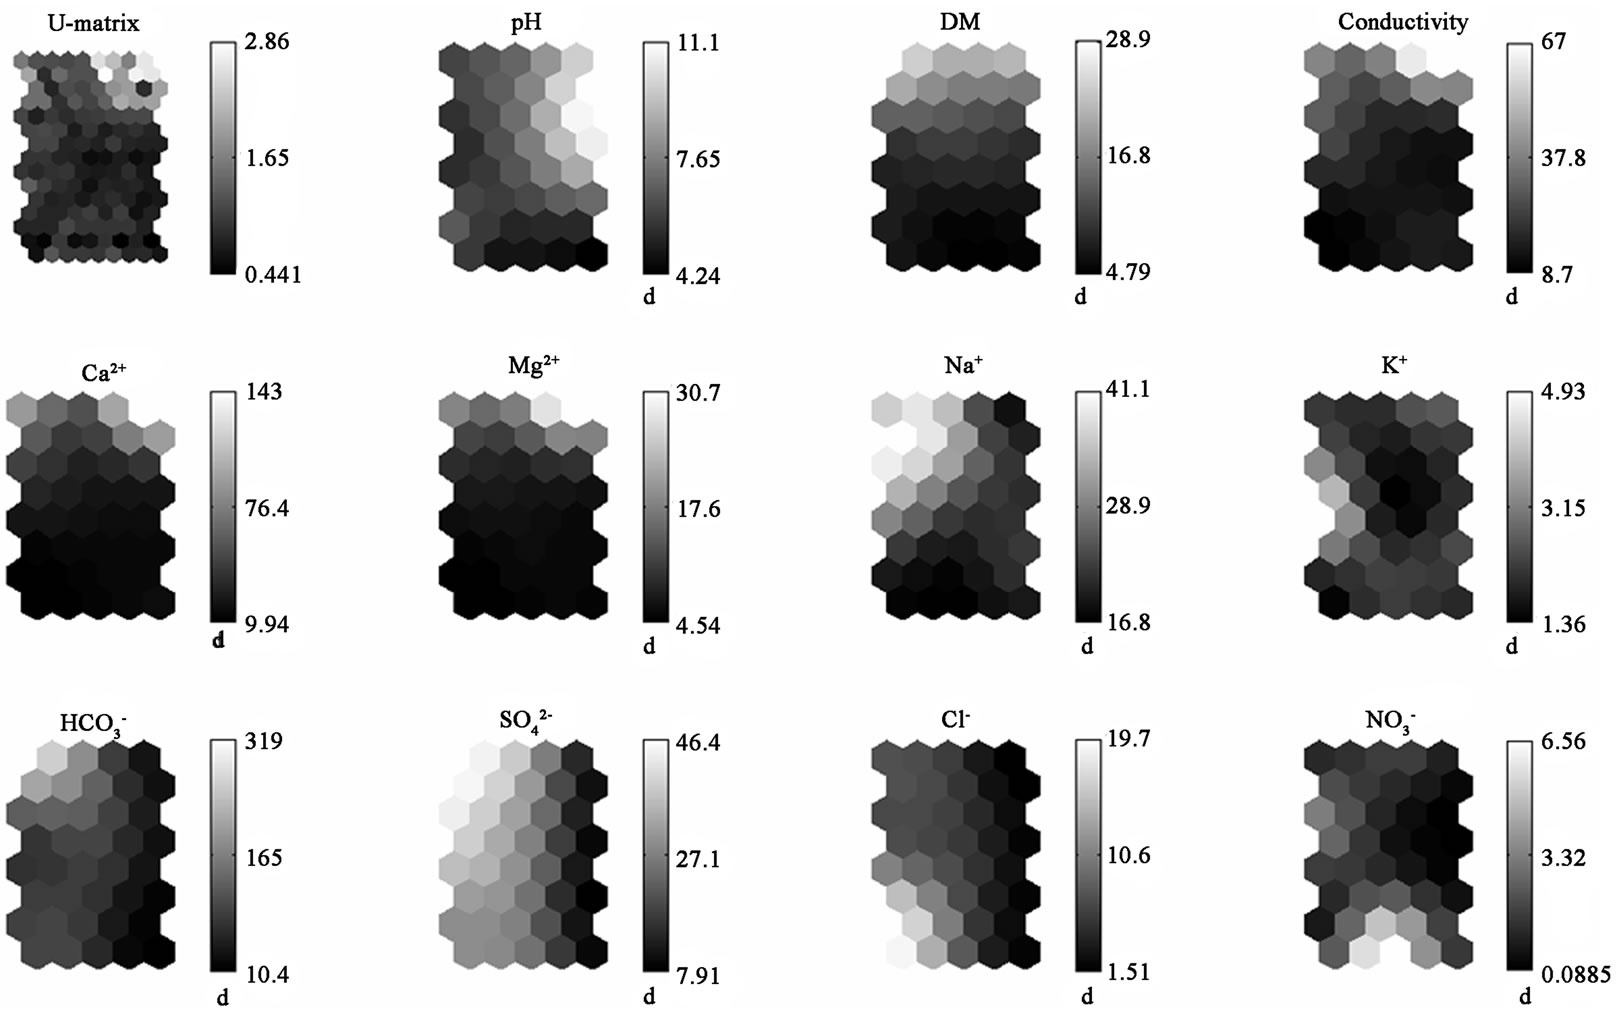
Figure 5. SOM classification for each variable at all sampling locations.
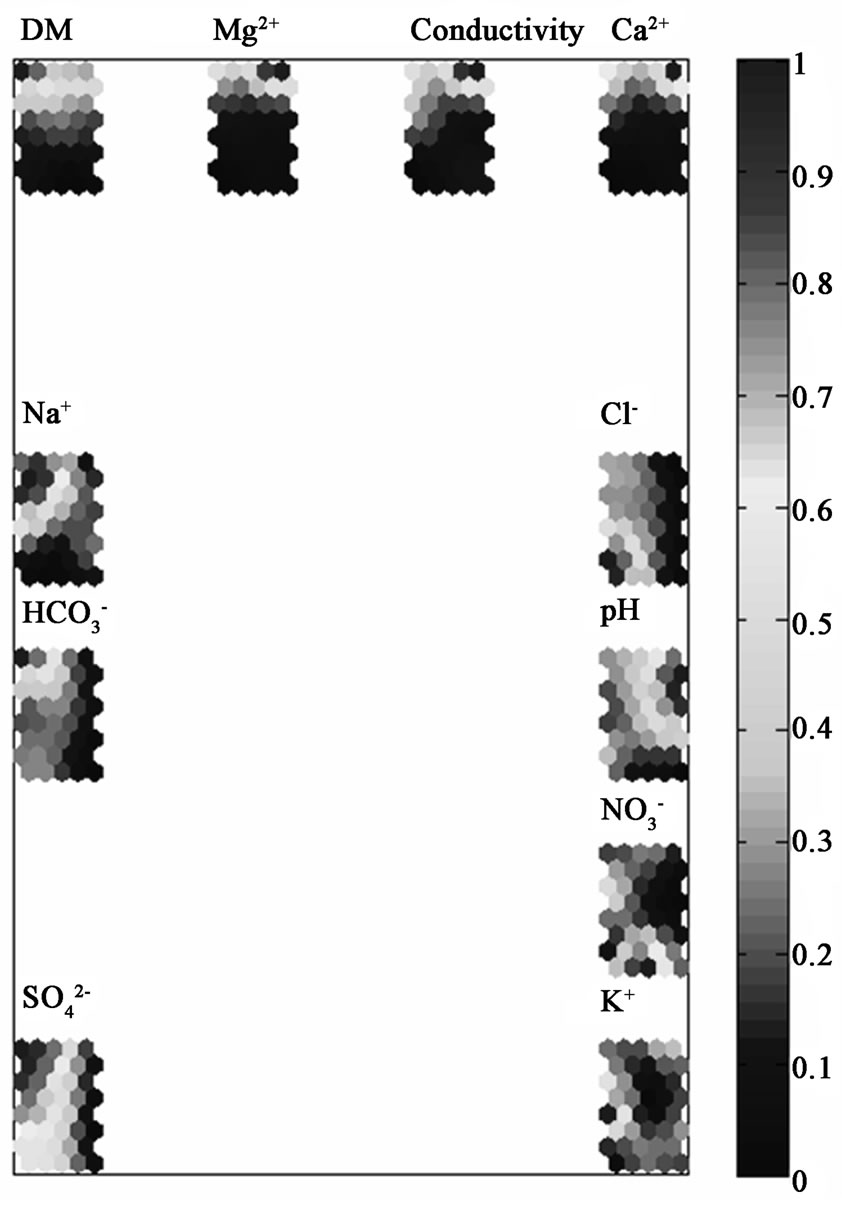
Figure 6. SOM of grouping of variables.
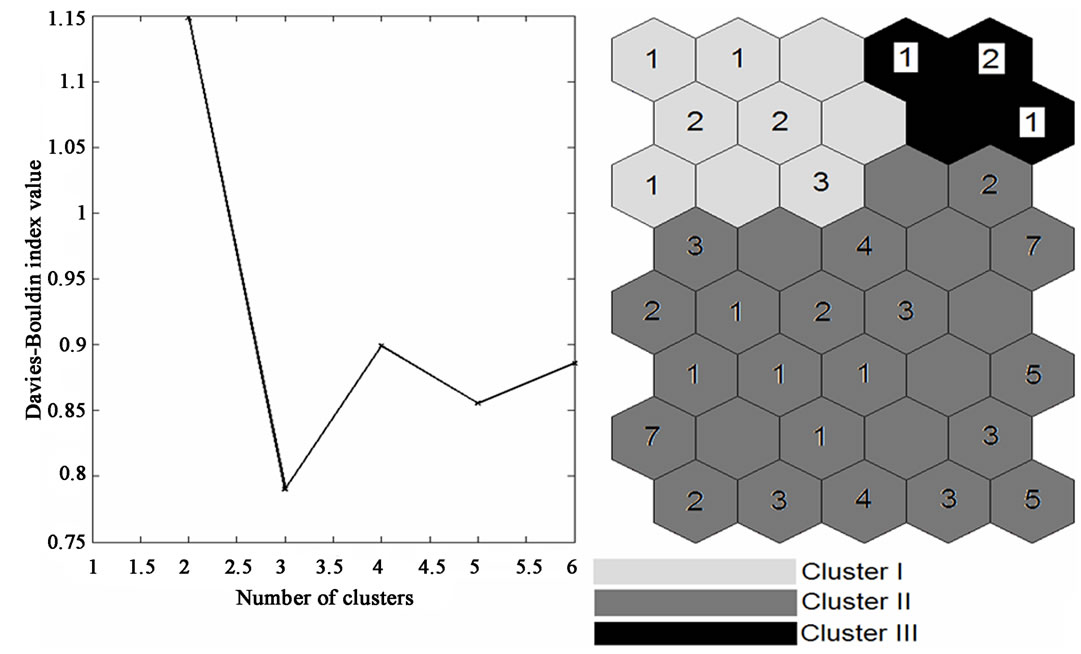
Figure 7. Groups of clusters by SOM.
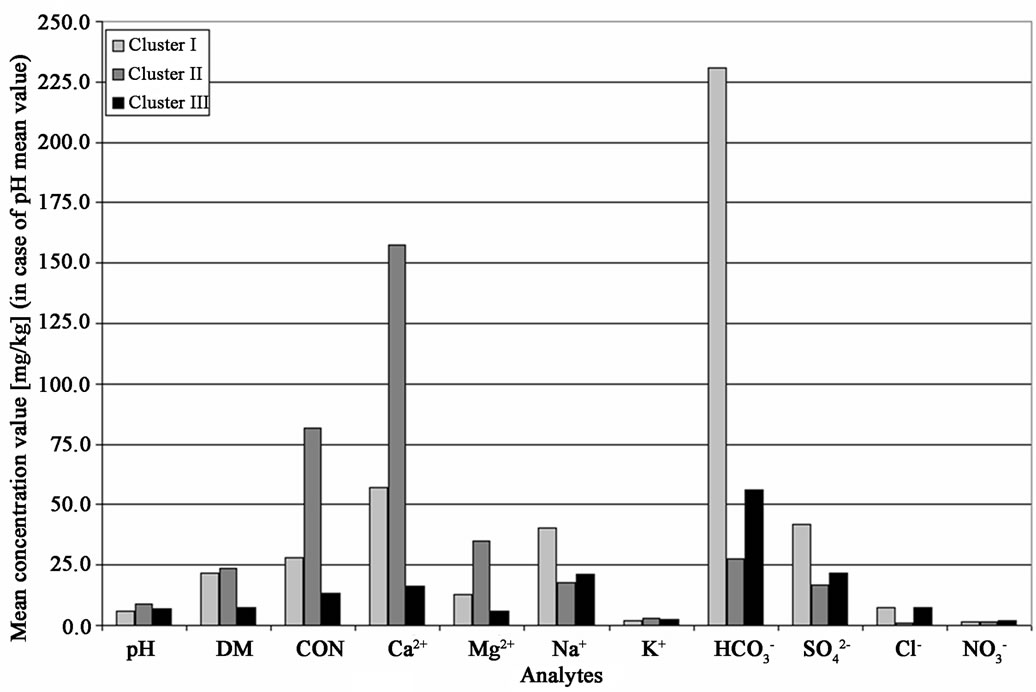
Figure 8. Discrimination diagram for all 6 SOM clusters.
Cluster I includes dominantly lakes from the southern part of Pirin Mountain (the group of Vasilashki lakes, which is located at relatively lower levels a.s.l. as compared to the other lakes). All objects are samples from the summer season (lowest water level) and are characterized by highest concentrations of hydrogen carbonate, sulfate, sodium, and chloride. This is an indication for high salt impact but it should be attributed to natural and not to anthropogenic reasons.
Cluster II comprises a small group of lakes from the Lake Sinanitsa and Sinanitsa River vicinity. They are the outliers discussed by the interpretation of results from CA and PCA of the monitoring data. The discriminating variables in this situation are the parameters of the water hardness – calcium, magnesium, conductivity, and dissolved matter. Obviously, the specific local crustal composition is the natural reason for finding similarity between this group of Pirin lakes.
Cluster III is mixed and very large. This is an indication for the homogeneity of the water quality stated before. The group of more than 60 cases is characterized by lowest levels of the concentrations of all water quality parameters.
In conclusion, it can be stated that the quality of the lake water in the high-mountain lakes in southern Bulgaria is very high and is mostly subject to natural impacts. The different environmetric data interpretations applied prove convincingly this statement.
4. Conclusions
In this study we have tried to prove that the lake water monitoring data assessment could use an extremely useful tool—the methods of chemometrics and environmetrics. If one decides to use the multivariate statistical methods for classification, projection, modeling, and interpretation of lake water monitoring data in order to gain specific (often hidden, non-available from the raw data) information, then the pathway to reach it should follow several major steps: proving the data quality by means of metrological criteria (uncertainty, limits of detection of the monitoring methods, precision, reliability of signal etc.); checking the data distribution (often non-normal) by statistical tests; data normalization in order to avoid problems with non-normal distribution or data dimensionality; classification of the monitoring data by different environmetric approaches like cluster analysis, principal components analysis, neuron net classification (self-organizing maps of Kohonen as an option of classification without training procedures); careful interpretation of the classification results and finding the reasons for the similarity groups; modeling the data in order to identify latent factors responsible for the data structure and the factor contribution to the formation of the total concentration of each of the lake water quality parameters; determination of seasonal patterns in lake water quality; comparison of the models with the real monitoring data.
Following this mode of data interpretation we have reached to the important conclusion that reliable classification for high-mountain lakes in Pirin Mountain is performed, which makes it possible to find patterns of similarity between the lakes and to explain this similarity (or dissimilarity) by discriminating water quality parameters; it could be stated that most of the Pirin high-mountain lakes are clean with background levels of chemicals.
5. Acknowledgements
The authors would like to express their sincere gratitude to the National Science Fund (Project DO-02-352) for the financial support which made this study possible.
REFERENCES
- ЕU Instruction 80/778, “Water Analysis and Control,” Brussels, 1990.
- Council Directive 91/692/EEC, European Union Directive, 1991.
- Bulgarian Drinking Water Analysis Standard (BDWS), “Ministry of Environment and Water,” Sofia, 1991.
- European Commission Directive 2000/60/EC of the European Parliament and of the Council, “Community Action in the Field of Water Policy,” Official Journal of the European Union, Serie L327, 2000.
- V. Simeonov, L. Wolska, A. Kuczynska, J. Gurwin, S. Tsakovski, M. Protasowicki and J. Namiesnik, “Sediment-quality Assessment by Intelligent Data Analysis,” Trends in Analytical Chemistry, Vol. 26, No. 4, April 2007, pp. 323-331.
- US Environmental Protection Agency, “Clarification Regarding Toxicity Reduction and Identification Evaluations in the National Pollution Discharge Elimination System Program,” Washington, D.C., 2001.
- G. Goodfellow, L. Ausley, D. Burton, D. Denton, P. Dorn, D. Grothe, M. Heber, T. Norber-King and J. Rogers, “Major Ion Toxicity in Effluents: A Review with Permitting Recommendations,” Environmental Toxicology and Chemistry, Vol. 19, No. 1, January 2000, pp. 175-182.
- A. Astel, S. Tsakovski, P. Barbieri and V. Simeonov, “Comparison of Self-organizing Maps Classification Approach with Cluster and Principal Components Analysis for Large Environmental Data Sets”, Water Research, Vol. 41, No. 19, November 2007, pp. 4566-4578.
- V. Simeonov, L. Wolska, A. Kuczynska, J. Gurwin, S. Tsakovski and J. Namiesnik, “Chemometric Estimation of Natural Water Samples Using Toxicity Tests and Physicochemical Parameters,” Critical Reviews in Analytical Chemistry, Vol. 37, January 2007, pp. 81-90.
- A. Astel, S. Tsakovski, V. Simeonov, E. Reisenhofer, S. Piselli and P. Barbieri, “Multivariate Classification and Modeling in Surface Water Pollution Estimation,” Analytical Bioanalytical Chemistry, Vol. 390, No. 5, March 2008, pp. 1283-1292.
- P. Simeonova and V. Simeonov, “Chemometrics to Evaluate the Quality of Water Sources for Human Consumption,” Microchimica Acta, Vol. 156, No. 3-4, December 2006, pp. 315-320.
- A. Astel, G. Glosinska, T. Sobczynski, L. Boszke, V. Simeonov and J. Siepak, “Chemometrics in the Assessment in the Sustainable Development Rule Implementation,” Central European Journal of Chemistry, Vol. 4, No. 3, September 2006, pp. 543-564.
- P. Simeonova, “Polluting Sources Apportionment for Atmospheric and Coastal Sediments Environment,” Ecological Chemistry Engineering, Vol. 13, 2006, pp. 1021- 1032.
- P. Simeonova, “Multivariate Statistical Assessment of the Pollution Sources Along The Stream of Kamchia River, Bulgaria,” Ecological Chemistry Engineering, Vol. 14, 2007, pp. 867-874.
- D. L. Massart and L. Kaufman, “Interpretation of Analytical Chemical Data by the Use of Cluster Analysis,” Journal of Wiley, New York, 1983.
- B. Vandeginste, D. L. Massart, L. Buydens, S. De Long, P. Lewi and J. Smeyers-Verbeke, “Handbook of Chemometrics and Qualimetrics”, Elsevier, Amsterdam, 1998.
- J. W. Einax, K. H. Zwanziger and S. Geiss, “Chemometrics in Environmental Analysis,” VCH Weinheim, 1998.
- T. Kohonen, “Self-organizing Maps”, Springer, Berlin, 2001.