Journal of Diabetes Mellitus
Vol.2 No.1(2012), Article ID:17310,7 pages DOI:10.4236/jdm.2012.21009
Impaired glucose tolerance (IGT) to frank diabetes: Dietary manipulations in WNIN/GR-Ob rats*
![]()
National Centre for Laboratory Animal Sciences, National Institute of Nutrition (ICMR), Hyderabad, India; #Corresponding Author: nappanveettil@yahoo.co.in, hsnemani2000@yahoo.com, seshdrieunni@yahoo.co.in, jayakalyan@yahoo.co.in
Received 23 September 2011; revised 29 October 2011; accepted 25 November 2011
Keywords: Purified diets; frank diabetes; hyperphagia; Plasma glucose; hyperinsulinemia
ABSTRACT
Background: Several rodent models are available to study obesity and obesity associated diabetic problems. We developed an obese mutant rat model viz., WNIN/GR-Ob from our existing WNIN (Inbred Wistar) stock of rats, which exhibit hyperglycemia on challenge with oral glucose. Since such impaired glucose tolerance (IGT) is a fore runner to frank diabetes status, we carried out a study to challenge the animals with different purified carbohydrate sources (glucose, sucrose, starch) and see the outcome. Methods: 48 obese rats of both genders and equal number of lean littermates of 35 days of age were taken for the study and were divided in to four groups, A, B, C, and D. A group received purified glucose based diet, B, received purified sucrose, C, received purified starch and the D, served as the control, receiving standard laboratory rat chow developed at our centre, containing roasted bengal gram as the source of carbohydrate. All diets were isocaloric in nature and contained 56% carbohydrate in principle. Animals were fed for 8 weeks and parameters like food intake, body weights, and plasma glucose and insulin levels were measured in experimental and control rats at initial, 4 weeks and 8 weeks. Results: As expected, food intake, body weight and feed efficiency ratio were significantly higher in obese rats of all groups as compared to their lean littermate controls and also higher in stock diet, compared to purified diets. Both lean and obese animals showed higher values of glucose and insulin on purified diets compared to control diet. But amongst lean and obese animals, the latter showed sexual dimorphism in their response, the situation being worse in starch fed (C) group. Amongst the obese animals, the males seem to suffer more, compared to females, in starch fed group, followed by glucose and sucrose fed in that order. Conclusions: WNIN/ GR-Ob rats thus seem to be a useful animal model, vulnerable to diet manipulations, especially to carbohydrates. This has the potential to be used as a diabetic model, more akin to human systems, where diet is the major trigger for precipitating diabetes.
1. BACKGROUND
Obesity has reached epidemic proportions in developed countries, affecting 20% - 30% of men and 30% - 40% women on an average. The scenario is rapidly changing in countries like India too, where in people in affluent environments, are at risk due to increase in the incidence of obesity [1]. It is now widely recognized as a complex and seriously debilitating nutritional disorder, associated with an increased risk of major diseases including cardiovascular [2,3] and cerebrovascular diseases [4], diabetes [5] and osteoarthritis [6]. The association of type II diabetes with obesity is very well known and its prevalence has increased in recent years, which is related to weight and sedentary lifestyle [7]. Around 171 million people are affected globally in 2000 and this number is likely to cross 366 million by 2030 [8]. Diabetes, thus no doubt, is one of the major non-communicable diseases World wide and biomedical research is currently fully focused on delineating the cause and effect of this metabolic disorder. Though research directly on obese human will be ideal to address this problem, there is limitation to such an approach, as it borderlines, ethics. Moreover, to understand the basic nature of the problem suitable animal models mimicking human condition will be more apt.
Animal research on obesity and diabetes revolved around on genetic, traumatic and environmental models, especially the interaction of environmental factors like dietary factors. In modern times, people are constantly exposed to a tremendous variety and quantity of appetizing high caloric food which epidemiologically has been shown to be linked to obesity and diabetes. Several animal models, especially rodents were developed in the West to study this human affliction. Some of these well known mutant animal models are the following: db/db mice, New Zealand Obese (NZO) mice, Kondo-Kondo mice (KK) and Zucker Diabetic Fatty (ZDF), Wistar Diabetic Fatty (WDF) rats. These are genetically obese and show symptoms of diabetes at various stage of their life span, and this was shown to be accelerated by selective feeding of purified diets [9,10].
At our animal facilities, we are maintaining one of the oldest stocks of Wistar strain of rats (95 years approx) in inbred status. From this colony, a mutant line of lean rats showing impaired glucose tolerance (IGT) was earlier identified, which showed hypertriglyceridemia, hypeinsulinema and hypercholeteolemia with a marginal increase in free fatty acids, and were designated as WNIN/ GR rats [11] and was maintained as an inbred colony. Around the same time, another mutant rat line with obesity and euglycemia was isolated and a colony of this was also established, and was designated as WNIN/Ob. These mutant rats show higher BMI, higher body fat and lower lean body mass as compared to lean littermates. They also show hyperphagia, hypercholesterolemia, hypertriglyceridema, hyperinsulinemia and hyperleptinemia [12]. The obesity trait in this strain was found to be due to autosomal incomplete dominant inheritance, and the litter consisted pups of homozygous lean (+/+), heterozygous carrier (+/−) and homozygous obese (−/−), with distinct phenotype in a 1:2:1 Mendelian ratio, respectively. These phenotypes showed distinct genotypes with respect to physical, physiological and biochemical indices of obesity [12]. Combining the traits, obesity as well as IGT, another stock of rats was developed by crossing the WNIN/GR and WNIN/Ob carrier (+/−) rats. The resulting rat strain was called WNIN/GR-Ob as it is obese and exhibit IGT as well [13]. Like the obese parent (WNIN/Ob) the life span of WNIN/GR-Ob obese rats were also found to be reduced to half (1 1/2 year), and as they cross one year, they were found to develop opportunistic infections, cataract and retinal degeneration (10% - 15%) [14], mammary tumors and lipomas (over 50% - 60%), and kidney abnormalities totally [15]. In recent times they started showing hypertension as well [16].
Since these mutant obese rats consume large amount of feed, a study was conducted earlier to minimize the cost by feeding the obese rats on a maintenance stock diet containing 14% protein instead of the normal rat chow containing 20 % protein. It was observed then, that though the maintenance diet could support the lean animals well, it did not fulfill the requirements of obese rats, since its growth and feed efficiency were found to be affected, with increase in plasma triglycerides as well as plasma glucose levels [17]. This preliminary study thus indicated the vulnerability of WNIN/GR-Ob rats to dietary manipulations, especially its, inability to handle glucose. To make the best use of this observation, we decided to alter the source of carbohydrate, and feed the animals with purified diets containing different source of carbohydrates, and see whether the serum glucose will alter to any appreciable level, like in a diabetes status. We felt that, if this attempt becomes successful, it will provide a new animal model, which cane be made to become diabetic by dietary manipulation, rather than resorting to alloxan and streptozotocin injection, which is an unnatural and artificial way of producing diabetes. This study was thus planned with this conviction
2. METHODS
2.1. Animals
Twenty four male and twenty four female WNIN/GROb obese rats of 35 days, and weight matched were taken for the study with an initial body mass index (BMI) of 5.71 ± 0.08. Equal number of lean male and female littermates was taken from the same stock as control, having BMI (Body mass index) of 4.20 ± 0.05.
2.2. Housing
The animals used in the entire study were housed in standard polycarbonate cages (Techniplast, Italy) with top grill having facilities for holding pelleted feed and drinking water in polycarbonate bottles with stainless steel sipper tubes. The bottom of the cage was also steel grilled to facilitate free droppings of feces and urine and also to prevent coprophagy. Readily available autoclaved paddy husk was used as a bedding material in the cages. An ambient temperature of 22˚C ± 2˚C with 14 - 16 air changes per hour, relative humidity of 50% - 60% and light/dark cycles of 12 hours duration were maintained in the animal rooms. The diets were given in powdered form, in stainless steel cups and the rats had free access to water.
2.3. Diets
Both lean and obese littermates were divided randomly in to 4 groups namely A, B, C and D. Group A consisted of 12 animals (6 male + 6 females) and received glucose based diet. B group received sucrose and C group received starch based diets. The D group ani-
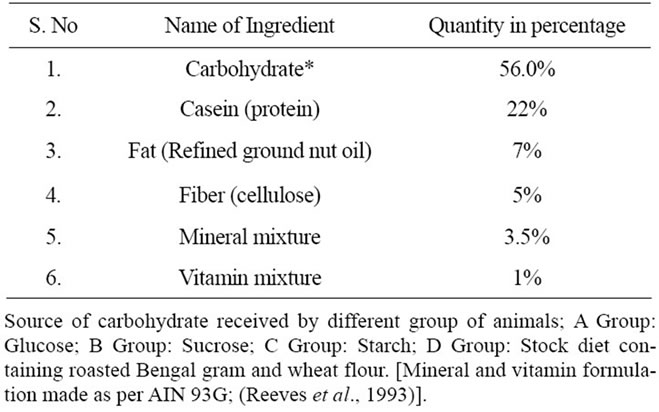
Table 1. Composition of the diet fed to control and experimental rats WNIN/GR-Ob rats (n = 6).
mals received standard rodent chow prepared at our facility (Table 1). All diets were Isocaloric in nature and contained 65% carbohydrate from different sources. Apart from carbohydrate the diet contains 20% protein (Casein), 7% fat (Refined groundnut oil), 5.0% fibre (Cellulose), 3.5% mineral mixture, 1.0% vitamin mixture (as recommended by AIN 93), [18]. The lean control rats were similarly grouped and received similar diets as given to obese rats for a period of 8 weeks.
2.4. Parameters
Physical parameters like body mass index (BMI), weekly body weights, daily food intake, feed efficiency ratio (FER) were measured in animals of all the groups, and also biochemical parameters like glucose and insulin at initial, 4 and at 8 weeks [19]. For estimation of plasma glucose, rats were fasted for 16 hours, after which blood was collected from the supraorbital venous plexus [20] and was directly drawn into vials containing sodium fluoride. Glucose was estimated by the kit provided by Stangen Immunodiagnostics, Hyderabad, India, based on Trinder method [21]. Plasma insulin concentration was measured by the double anti-body method [22] using an insulin radioimmunoassay kit provided by Bhaba Atomic Research Centre, Mumbai, India, using porcine insulin as the standard.
2.5. Statistical Analysis
Multiple ANOVA was carried out with multiple comparisons using Duncan’s multiple range test. To test the difference in the mean values of data at three different time points (Time trend analysis carried out at, Initial, 4 and 8 weeks) by repeated measures of ANOVA was employed. Where ever the data were found to be highly variable, log transformation was carried out and further tested with repeated measures of ANOVA. A p value of 0.05 was considered statistically significant.
3. RESULTS AND DISCUSSION
3.1. Food Intake
The average food intake of obese and lean rats per week from the starting of the experiment (at 35 days of age) to the end of the experiment (at 91 days of the age) is given in Tables 2(a) and 2(b). The food intake and FER values of obese rats were found to be significantly different as compared to lean littermate control. However, the experimental groups (A, B and C) had lower food intake compared to stock diet, though FER did not show any difference.
3.2. Growth
The mean body weights of lean and obese rats from starting to end of the experiment are given in Table 2(a) and 2(b). From the beginning of the experiment the stock diet fed D group obese male animals had higher body weights compared to A, B, and C group obese rats. Second highest body weights were observed in starch fed group, followed by sucrose fed rats. The glucose fed male rats had lower body weights, but these are significantly higher than lean control male rats. There was marked difference in the weights of stock diet fed D group rats from 2nd week of experiment and the weights of B and C group rats around 4th week. Such significant difference between the groups was seen in obese males, and was not evident in females, though a trend was discernable. The lean female rats showed a slow growth rate from the 2nd week of experiment till the end. The obese female rats reached a maximum weight of 400 gm at the end of the experiment which is almost equal or near to the body weight of the obese male rats.
3.3. Glucose
Plasma glucose levels of lean control and obese rats are shown in Table 3. Between lean and obese animals, the fasting plasma glucose levels were significantly higher in the latter at the beginning, as well as at 4 and 8 weeks of experiment. In all groups, the levels increased with increase in age. There was a significant increase in fasting plasma glucose levels of all the purified diet fed groups (A, B, and C) compared to stock control animals (D). There was a sex difference with reference to the response to different carbohydrates. While male rats showed higher values with starch based diets, followed by glucose and sucrose, in females, glucose diet gave high values of glucose followed by sucrose and starch. Even lean animals showed a similar response, but their glucose values were very low compared to obese group at all levels of feeding.
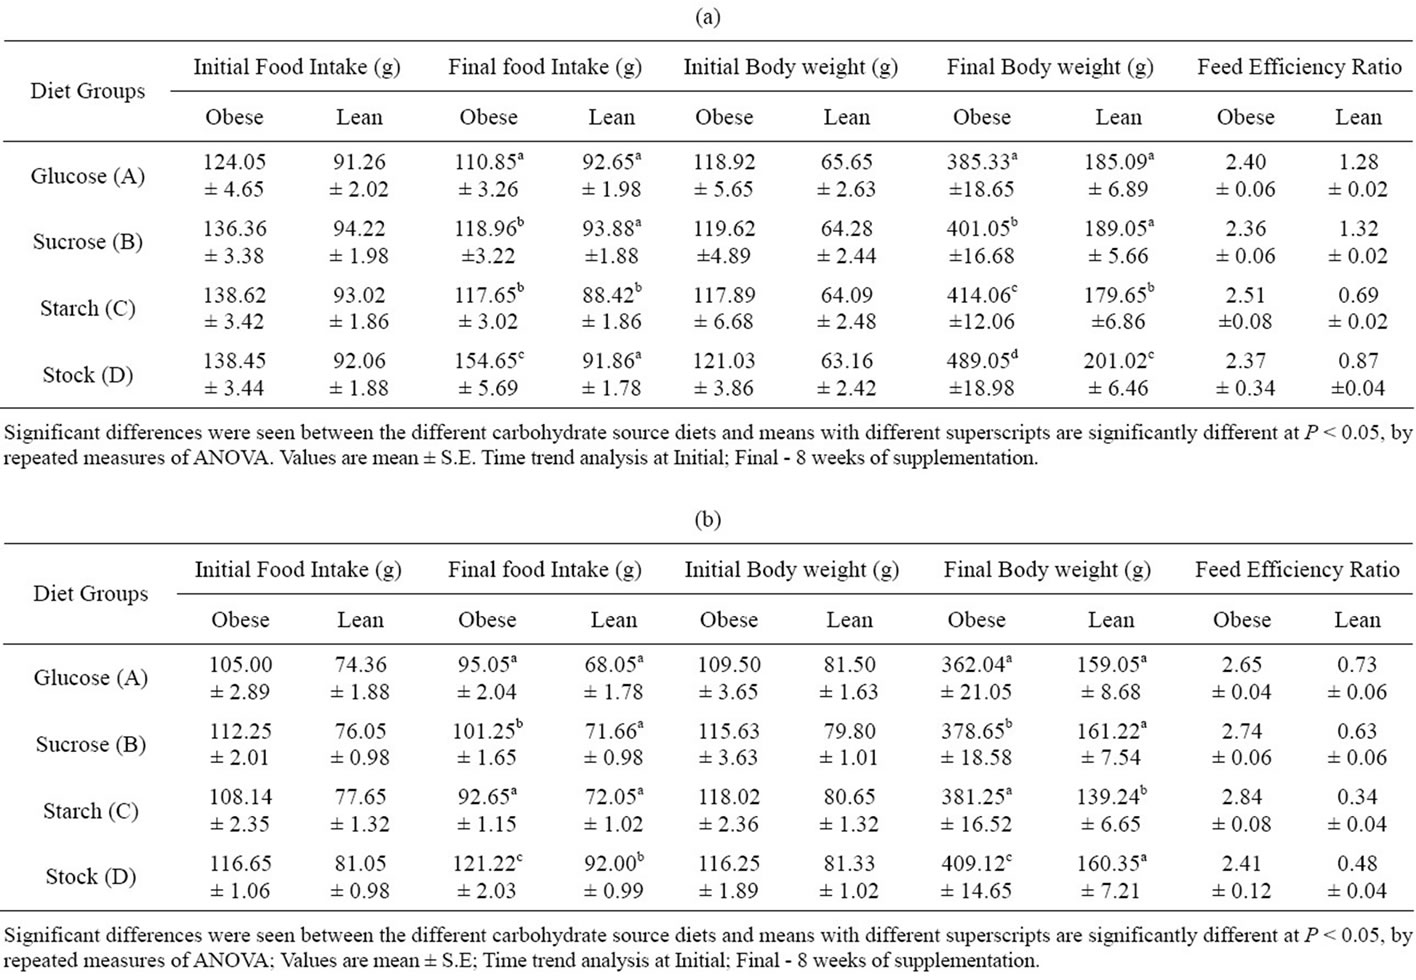
Table 2. (a) Food intake, body weight and feed efficiency ratio of different carbohydrate source diet in male rats – Obese (−/−) (n = 6); and lean (+/+) (n = 6); (b) Food intake, body weight and feed efficiency ratio of different carbohydrate source diet in female rats – Obese (−/−) (n = 6); and lean (+/+) (n = 6).
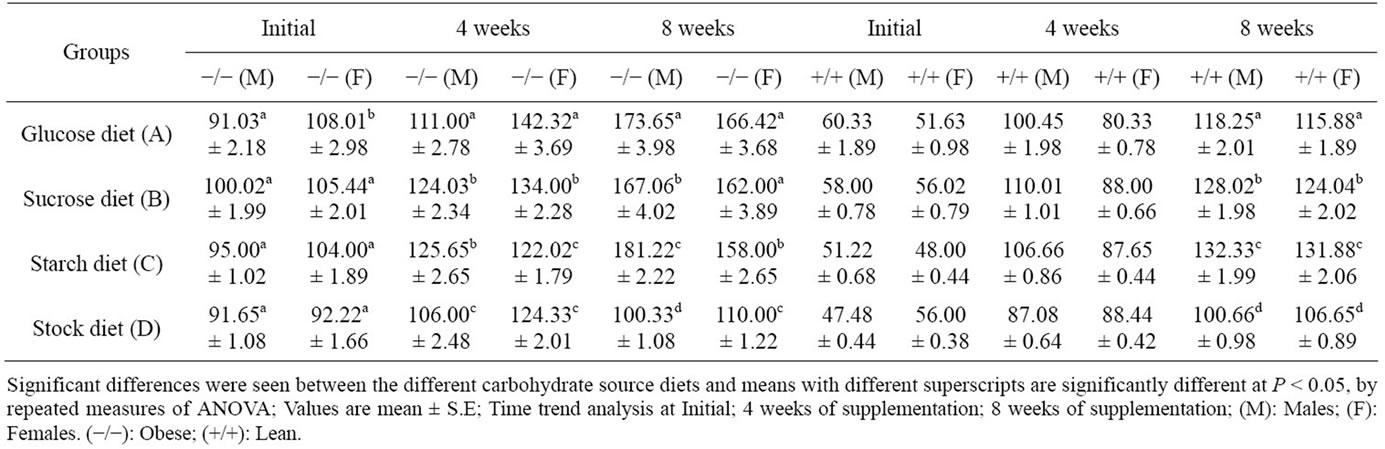
Table 3. Plasma glucose (mg/dl) response to different carbohydrate source in WNIN/GR-Ob rats. rats Obese (−/−) (n = 6); and lean (+/+) (n = 6).
3.4. Insulin
Plasma insulin levels in lean control and obese rats are shown in Table 4. With respect to basal plasma insulin levels, the levels in obese rats were similar to observations made on glucose levels, except for the fact, that both males and females exhibited similar responses to different carbohydrates. The levels were higher in starch group in both males and females, followed by sucrose and glucose diets in that order, at the end of the experimental feeding. Females in general showed higher insulin levels in experimental groups. Lean animals also followed a similar trend.
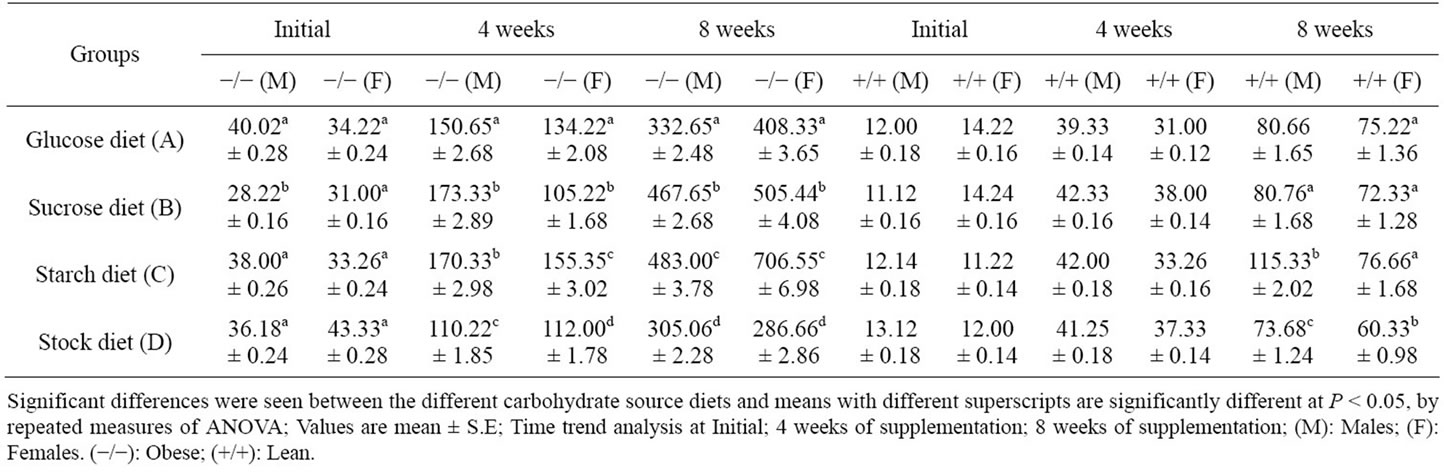
Table 4. Plasma insulin (µU/mol) response to different carbohydrate source in WNIN/GR-Ob rats rats – Obese (−/−) (n = 6); and lean (+/+) (n = 6).
Before genetic models such as db/db mice and ZDF rat strains came to the scene, (which are obese as well as hyperglycemic) experimental models of obesity and diabetes was produced by dietary manipulation [10,11], as well as by injection of alloxan and streptozotocin in normal or carbohydrate sensitive rat strains like Osborne Mendel and Cdb/BHE rats. There are also mutant rat strains like WDF and LA-N Cp which are obese with IGT trait, showing symptoms of frank diabetes, i.e., higher fasting plasma glucose level (above the threshold value) and glycosuria on purified sucrose diets [23]. The mutant rat strain, WNIN/GR-Ob described here is also unique like the WDF and LA-N-Cp as these are also obese and also show IGT on challenge with oral glucose [13].
As mentioned in the introduction, we made an accidental observation that fasting glucose and triglycerides could increase in WNIN/GR-Ob rats, maintained on diet having 14% protein compared to a 20% protein diet. This gave us a clue that these strains could be sensitive to dietary manipulations, and this is what we attempted here by feeding these rats on a purified diet containing glucose, sucrose and starch individually.
As expected purified diets did maintain the basic traits of the model, like hyperphagia and higher body weights, compared to their lean littermates, though maximum weight gain was seen only with stock diet in both males and females. It should be mentioned that stock diet contains 13% dietary fiber, which is more of the soluble type, while the experimental diets have only 5% cellulose, that too mostly insoluble. This might have contributed to the better FER seen in the control rats. Amongst the three experimental groups, starch based diet, produced maximum weight, though feed efficiency ratio did not show any difference. With reference to fasting plasma glucose levels, in all the purified dies, the elevated plasma glucose levels above the threshold levels, was more in starch based group in males, and in glucose and sucrose based groups in females. Such a sexual dimorphism was reported in WDF rats as well, where in females showed high hyperglycemic response to sucrose based diet (basal load of glucose above 140 mg/dl, NIH1970 [24])
With respect to insulin levels, this mutant model also showed hyperinsulinemia at basal levels like ZDF and WDF rats and this is further exacerbated by feeding purified diets, the response being more in females than males. Whether this increase in insulin response is responsible for higher weight gain in females when compared to lean control females need to be further investigated. The obliteration of weight difference between males and females which are observed in lean littemate control rats can also be due to this altered metabolic response.
4. CONCLUSIONS
It is indeed gratifying to see that, WNIN/GR-Ob rat stain is more similar to human situation, where the diet plays a major role in the worsening of IGT and subsequent diabetic status. The experimental models like alloxan and streptozotocin induced are not true models, as they do not reflect the ground realities especially with respect to humans. These substrates totally knock out the β-cells of the pancreas, and thus the animals ability to produce insulin on a whole. Type II diabetes which is fairly common and mostly wide spread is due to insulin resistance, and this is what is seen in mutant models like WNIN/GR-Ob, where feeding of purified diets like starch and sucrose seem to do the trick. In genetic models like WDF and LA-NCp rats, long term feeding of sucrose based diets apart from elevating plasma glucose levels, resulted in glycosuria as well. In WNIN/GR-Ob model, glycosuria was only trace, as in stock diet. This may be due to the duration of the experiment (8 weeks), and it is quite possible that long term feeding (over 24 weeks) could precipitate this as well. In short, the data presented here clearly underlines the potential of this model in studying obesity induced diabetes, a clear alternative to unnatural experimental models based on alloxan and streptozotocin injection.
The study was reviewed and approved by the Institutional Animal Ethical committee (IAEC), and was conducted in accordance with the internationally accepted principles for laboratory animal use and care.
5. AUTHORS CONTRIBUTIONS
N. Harishankar, carried out the measurements of food intake, weekly body weights, plasma glucose and insulin analysis in control and experimental rats. Mr. E. Seshadri, prepared the diets as per the formulation. Mr. S. Kalyanasundaram formulated the different carbohydrate diets for the experiment. N. V. Giridharan contributed equally to this paper in various aspects of this study. N. Harishankar drafted the manuscript along with N. V. Giridharan. All authors read and approved the final manuscript.
6. ACKNOWLEDGEMENTS
We are grateful to Indian Council of Medical Research (ICMR) and Department of Biotechnology (DBT), Govt. of India. New Delhi for the financial support to carryout the studies. We take this opportunity to remember our late colleague Mr. P. Janakiramaiah, who was part of this study and involved with us in the execution of the study. We thank Mr. N. Yadagiri, Laboratory Assistant for his excellent care and cooperation in the maintenance of obese rat colony. We are thankful to Dr. B. Sesikeran, Director, Dr. Kamala Krishnaswamy, former director, National Institute of Nutrition for their keen interest in this work.
![]()
![]()
REFERENCES
- Bjorntorp, P. (1997) Obesity. The Lancet, 350, 423-436. doi:10.1016/S0140-6736(97)04503-0
- Ghosh, A., Bose, K. and Das Chaudhuri, A.B. (2003) Association of food patterns, central obesity measures and metabolic risk factors for coronary heart disease (CHD) in middle aged Bengalee Hindu men, Calcutta India. Asia Pacific Journal of Clinical Nutrition, 12, 166- 171.
- Ghosh, A., Bose, K., Chakravarti, S., et al. (2004) Relationship of waist circumference and waist hip ratio with metabolic risk factors of coronary heart disease among Bengalee Hindu men of Kolkata, India. Journal of the Royal Society of Health, l124, 86-91.
- Bose, K. and Mascie-Taylor, C.G.N. (1998) Conicity index and waist-hip ratio and their relationship with total cholesterol and blood pressure in middle-aged European and migrant Pakistani men. Annals of Human Biology, 25, 11-16. doi:10.1080/03014469800005392
- Bose, K. (1992) Non-insulin-dependent (type-II) diabetes mellitus and obesity in Asian in UK: Scope for future studies. Journal of the Royal Society of Health, 112, 291- 293. doi:10.1177/146642409211200617
- Kawa, R., Peterson, R.G., West, D.B. and Greenwood, M.R.C. (1990) Wistar diabetic fatty rat. ILAR News, 32, 9-13.
- Zimmet, P., Alberti, K.G. and Shaw, J. (2001) Global and social implications of the diabetes epidemic. Nature, 414, 782-787. doi:10.1038/414782a
- Kingh, H., Aubert, R.E. and Herman W.H. (1998) Global burden of diabetes. 1995-2025: Prevalence, numerical estimates, and projections. Diabetes Care, 21, 1414-1431. doi:10.2337/diacare.21.9.1414
- Herberg, L. (1988) Insulin resistance in abdominal and subcutaneous obesity: Comparison of C57BL/6J-Ob/Ob with New Zealand obese mice. In: Shafrir, E. and Renold, A., Eds., Frontiers in Diabetes Research: Lessons from Animal Diabetes II. John Libbey & Company Ltd., London, 367-373.
- Kanarek, R.B. and Marks-Kaufman, R. (1979) Developmental aspects of sucrose-induced obesity in rats. Physiology & Behavior, 23, 881-885. doi:10.1016/0031-9384(79)90195-1
- Giridharan, N.V., Lakshmi, C.N. and Raghuramulu, N. (1997) Identification of impaired glucose tolerant animals from a Wistar inbred rat colony. Libratory Animal Science, 47, 428-431.
- Giridharan, N.V., Harishankar, N. and Satyavani, M. (1996) A new rat model for the study of obesity. Scandinavian Journal of Laboratory Animal Science, 3, 131- 138.
- Harishankar, N., Vajreswari, A. and Giridharan, N.V. (2011) WNIN/GR-Ob—An insulin-resistant obese rat model from inbred WNIN strain for studies on obesity associated with diabetes. Indian Journal of Medical Research, 134, 320-329.
- Reddy, G.B., Vasireddy, V., Mandal, Md. N.A., Tiruvelluru, M., Wang, X.F., Jablonski, M.M., Nappanveettil, G. and Ayyagari, R. (2009) A novel rat model with obesity associated retinal degeneration. Investigative Ophthalmology & Visual Science, 50, 3456-3463. doi:10.1167/iovs.08-2498
- N. Harishankar, Kumar, P.U., Sesikeran, B. and Giridharan, N. (2011) Obesity associated pathophysiological and histological changes in WNIN obese mutant rats. Indian Journal of Medical Research, 134, 330-340.
- Giridharan, N.V., Sailaja, P. and Harishankar, N. (2010) A new obese rat model to study obesity and cardiovascular risks. CMJ Journal, Abstract, 96 Pages.
- Janakiramaih, P., Harishankar, N., Kalyanasundaram, S. and Giridharan, N.V. (1995) Effect of dietary variations on serum lipid profile in WNIN/GR-Ob rats. 64th Annual Meetings of Society of Biological Chemists (INDIA), 6-8 October, Lucknow, Abstract, 105 Pages.
- Reeves, G.P., Rossow, L.K. and Lindlauf, J. (1993) Development and testing of the AIN-93 purified diets for rodents. Journal of Nutrition, 123, 1923-1931.
- Hoover-Plow, J. and Nelson, B. (1985) Oxygen consumption in mice (I strain) after feeding. Journal of Nutrition, 115, 303-310.
- Riley, V. (1960) Adaptation of orbital bleeding technique to rapid serial blood studies. Proceeding of the Society for Experimental Biology and Medicine, 109, 751-754.
- Trinder, P. (1969) Determination of blood glucose using an oxidase-peroxidase system with a non-carcinogenic chromogen. Journal of Clinical Pathology, 22, 158-161. doi:10.1136/jcp.22.2.158
- Morgan, C.R. and Lazarrow, A. (1962) Immunoassay of insulin using a two-antibody system. Proceeding of the Society for Experimental Biology and Medicine, 110, 29- 32.
- Ikeda, H. and Matsuo, T. (1981) A new genetically obesehyperglycemic rat (Wistar fatty). Diabetes, 30, 1045-1050. doi:10.2337/diabetes.30.12.1045
- National Diabetic Group of NIH (1970) Classification and diagnosis of diabetes mellitus and other categories of glucose intolerance. Diabetes, 28, 1039-1057.
NOTES
*Competing interests: The authors declare that they have no competing interests.