Advances in Chemical Engineering and Science
Vol.09 No.02(2019), Article ID:92222,23 pages
10.4236/aces.2019.92018
Electroplating: Applications in the Semiconductor Industry
Jivaan Kishore Jhothiraman, Rajesh Balachandran*
Micron Technology Inc., Boise, USA

Copyright © 2019 by author(s) and Scientific Research Publishing Inc.
This work is licensed under the Creative Commons Attribution International License (CC BY 4.0).
http://creativecommons.org/licenses/by/4.0/


Received: January 29, 2019; Accepted: April 27, 2019; Published: April 30, 2019
ABSTRACT
There is a lot of research that has been done on electroplating of metals depending on the type of application. In this chapter, the importance of this technique to the semiconductor industry is discussed in detail from an experimental as well as a modeling standpoint. In particular, the effect of solution variables i.e. chloride, accelerator, suppressor on copper electrodeposition is discussed. This knowledge is applied to achieve a defect-free, bottom-up metal/copper fill that eventually, is one of the most critical processes in this billion-dollar industry.
Keywords:
Electroplating, Copper, Interconnects, Modeling

1. Introduction
For over five decades, extensive research has been done to identify and characterize different metals for back-end-of-line interconnects in the semiconductor industry. This search gets even more challenging as feature sizes shrink to accommodate for Moore’s Law [1] . Metals are chosen due to their low electrical resistance, increased reliability and lower power consumption [1] . High conductivity, an inherent quality of metals, enables relatively faster transmission of signals that are an integral requirement as more transistors are added to a semiconductor chip [3] . Until late 90s, aluminum was predominantly used for contacts as it was cheap and conductive. As feature sizes shrunk with newer technology nodes, there was an increased need for a metal with lower resistivity. Metals such as copper, tungsten, gold and silver were considered as suitable alternatives to aluminum since they were expected to have lower resistivity as well as exhibit improved reliability performance [2] [4] . Copper emerged as the clear winner since it resulted in a 45% decrease in the overall chain resistance thereby significantly reducing the signal delay. The transition to copper came about in 1997 but along with it came integration challenges. Aluminum lines were formed by sputter deposition followed by reactive-ion etching (RIE) of features and this process scheme could not be applied to copper attributing to the fact that the reaction products have a low vapor pressure [4] [5] . The challenge moving ahead was to come up with an alternate process flow that would not require subtractive metal etching. The potential process would require a suitable dielectric etch followed by metal superfill. Superfill of metals is required in order to achieve a uniform bottom-up fill in the interconnect features [6] [7] . Although there were many schemes investigated to deposit copper, they had significant drawbacks depending upon the method chosen. For instance, physical vapor deposition (PVD) had a poor step coverage leading to void formation which has downstream reliability concerns (Figure 1(a)). On the other hand, researchers also evaluated chemical vapor deposition owing to its superior step coverage property, but was accompanied with a relatively higher operating cost. The aforementioned challenges were successfully overcome with the introduction of electrodeposition to superfill the patterned trenches/vias and also serve as a cheaper alternative to CVD. In the following sections, an effort is made to explain the key parameters involved in conventional electroplating processes both from a modeling as well as an experimental standpoint.
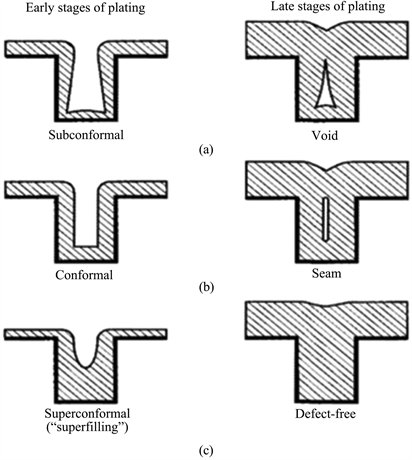
Figure 1. Schematic showing different scenarios in electroplating. (a) faster deposition rate at the top, (b) uniform deposition rate and (c) faster deposition rate at the bottom (superfill). Reprinted from Damascene copper electroplating for chip interconnections.
2. Copper Electroplating
2.1. Understanding Solution Parameters
In order to achieve superfilling of trenches/vias, we first need to understand the effect of solution variables. There has been a lot of research on electroplating in both interconnects as well as through silicon vias (TSV). In the following sections, plating in TSVs is used as a vehicle to understand the effect of each solution parameter. The typical solution consists of copper sulfate, sulfuric acid, chloride, accelerator (or brightener), suppressor (or inhibitor) and leveler. The inorganic component i.e. acidic copper sulfate is the plating source, while sulfuric acid provides conductivity. On the other hand, the organics i.e. accelerator, suppressor and leveler were added to ensure bottom-up fill [2] . Since the scope of the current discussion is to understand defect-free, bottom-up copper fill, more emphasis is put on understanding the role and importance of the organic additives and chloride ions (Cl−). Basic charge transfer reactions for copper ions in solution are shown below,
If these were the only reactions governing copper deposition, then there would only be a top-down fill which would result in voids. This is the reason organic additives are added to enhance bottom-up fill. There is a synergistic effect of each of the organics on the deposition process. As shown in Figure 2(a) below, in the presence of only an accelerator, the fill is conformal, while adding the suppressor (Figure 2(b)) pushed the fill towards slightly bottom-up. Only when the solution had an optimal amount of accelerator, suppressor and leveler (Figure 2(c)), it showed true characteristics of superfill i.e. bottom fills up faster in comparison to the top of the TSV. Arriving at an optimal organic additive concentration is dependent on the geometry of the via. More details on this is given in the modeling section. The following sections emphasize on understanding the role of individual additives to get a better perspective.
 (a) (b) (c)
Figure 2. Fill performance in the presence of (a) accelerator only, (b) accelerator and suppressor and (c) accelerator, suppressor and leveler in 30 μm × 110 μm vias. Reprinted from Through Silicon Via Copper Electrodeposition for 3D Integration.
2.1.1. Effect of Chloride
Extensive research [8] - [13] has been done till date on the effect of chloride on copper electrodeposition. Chloride ions have been mainly added to reduce anodic polarization as well as improve the blocking effect of other additives. Effect of chloride is shown in Figure 3 below. In the absence of any additives, the slope of curve is smaller than in the presence of 50 ppm Cl− [14] . This implies that Cl− addition promotes copper deposition in the absence of accelerator/suppressor. With the addition of 300 ppm of the suppressor the current density was low even at higher overpotential. Preliminary studies of Wei-Ping et al. [8] involved filling of laser drilled via-hole by using solutions with varying concentrations of 3-mercapto-1-propanesulfonate (accelerator) and sodium chloride (Cl−). It was found that by increasing the accelerator concentration in the bath, a higher concentration of chloride was required in enabling bottom-up fill or else the final fill would end up being conformal. The synergistic interaction between the additives dictates the CuCl generation that eventually gets accumulated in the via features and undergoes reduction to elemental copper. In addition to this Min et al.’s [13] work on another accelerator i.e. bis-(3-sodiumsulfopropyl) disulfide (SPS) resulted in similar result as Wei-Pin et al. When only an accelerator was added to the plating solution, there was a saturation in deposition observed, while the addition of small amount of Cl− rapidly increased the deposition rate. This is indicative of the fact that Cl− competes and/or inhibits the excessive adsorption of the accelerator thereby enhancing the copper deposition through adsorption. Similar work was pursued by Shao et al. to understand role of chloride ions [9] and arrive at a reaction mechanism for the process. At low concentrations of Cl− (few mM), copper deposition occurs via adsorption of Cl− and the subsequent reduction of CuCl. In contrast to this, higher concentrations of Cl− drive up the localized interfacial concentration thereby inhibiting copper deposition. All the above studies indicate the importance of Cl− in achieving bottom-up fill. Having understood the role of Cl−, the next sections shed light on the effect of different accelerators and suppressors.

Figure 3. Effect of Chloride ion concentration on applied current. Reprinted from copper deposition in the presence of polyethylene glycol I. Quartz crystal microbalance study.
2.1.2. Effect of Accelerator
In this section, a detailed understanding on the importance of accelerator is given. Accelerators used in the semiconductor industry are organic compounds that are disulfide or thiol-based compounds such as 3-mercapto-1-propanesulfonate (MPS) or bis-(3-sodiumsulfopropyl) disulfide (SPS) [15] . As shown in Figure 4, accelerator molecules are smaller in comparison to suppressor molecules and this property allows for faster diffusion in damascene contacts thereby promoting bottom-up deposition.
There are typically five types of reactions that can occur during copper electrodeposition in the presence of an accelerator namely, 1) copper comproportionation, 2) redox reactions with SPS, 3) adsorption, 4) complexation and 5) exchange reactions as mentioned by Philippe et al. in [16] . Electrodeposition of copper in the presence of an accelerator occurs via formation of Cu-thiolate (adsorbed) species. The role of accelerator is theorized by the reaction pathways below,
As shown in the equations above, either the electrochemical reduction of SPS to MPS and subsequent formation of Cu-thiolate complex or direct reaction with SPS as shown in equation are two possible pathways for elemental copper deposition. Delbos et al. [17] conducted a systematic investigation wherein they found that increasing the concentration of accelerator to about 17 μmol/l increased the fill rate of copper at the bottom of the TSV (150 μm depth × 75 μm dia.) beyond which the rate dropped. This trend was also corroborated by the work of Bioh et al. in [18] . Having understood the effect of accelerator, the next section is focused on the effect of suppressor on superfill.
2.1.3. Effect of Suppressor
As explained in the previous section, suppressor molecules are much larger than accelerator molecules to enable more accumulation at the top of the via. Typically used suppressors are polyethers that have high molecular weights. The most predominantly used suppressor in the semiconductor industry is polyethylene glycol (PEG). Key inhibiting factor for PEG on the deposition rate is its molecular weight. In Figure 5, Boehme et al. show that in the absence of any suppressor, the overpotential or in other words the threshold for copper deposition is low and almost takes place instantaneously. Their unique method for screening also shows that different flavors of PEG (300, 1000, 4000) show increasing resistance to adsorption/deposition thereby providing with a better suppressing effect with molecular weight [19] . This effect is expected to saturate beyond a certain molecular weight as the surface would be already covered completely as shown in [9] [20] .

Figure 4. Kinetics of copper deposition in the presence of accelerator, suppressor and leveler. Reprinted from Through Silicon Via Copper Electrodeposition for 3D Integration.

Figure 5. Effect of type of suppressor on copper fill. Reprinted from Rapid screening of plating additives for bottom-up metallization of nano-scale features.
3. Modeling of Electroplating Process
Process simulation of electroplating has evolved over the past decade in order to meet the challenges introduced by complex geometries to achieve a uniform defect free fill. The requirement for a robust and versatile fast response model with low computational power has been ever growing to realize a high precision and high uniformity electroplating process. Since feature configuration and geometry are the primary determiners of fill profile in the local feature to macro die level, it became pertinent to study its effect on defect creation during electroplating. In an ideal case, comprehensive process physics based models developed for an individual species for a local feature should be able to be extended or provide die or chip level data. In reality, to overcome the need for high computational power and high computation times, characteristic of complex mathematical models with high time, space resolution, simpler models with several assumptions that are case specific are developed. Simpler case specific models allow the incorporation into control systems where quick process feedback is required.
Common assumptions in such models are one or combination of steady state, no flow, single solute, laminar regime, dilute solutions, linear surface reactions, uniform potential field, absence of near surface charge effects and so on. Most models do not consider complete fluid dynamic characterization of the fluid in the system since it adds significantly to the computational complexity. Although, convective transport is negligible in modelling sub-micron features, bulk velocity in the overall system cannot be neglected for reactor design. Potential gradients in such sub-micron features in the solution and electrode are also deemed insignificant. Takahashi et al. [21] have shown that diffusion of trace additives and deposition species (copper) is the primary factor that governs defect and growth profile in small features. Other simpler algorithms such as level set method in [22] , employing quick algorithms such as narrow band, fast marching have been used to buy back computational requirement and response speed. The development of fully comprehensive models for simulating electrochemical processes is complex due to the interaction of mass and momentum transport coupled with potential distribution in the system. Typically, these are solved as a system of partial differential equations with complex boundary conditions on a geometry meshed at high density and use adaptive meshing to simulate profile evolution in small features. Understanding the interactions of the different physical processes in such a system has only been possible through the individual characterization in controlled systems. Several mathematical models describing the core phenomena involved in electrodeposition have been published over the years. Dependence of growth velocity during plating to final metal profile has been well established [23] [24] . Its extension to feature level and the dependence on feature geometry, transport length and time scales, current distribution along electrode and solution, effect of additives have been published [25] [26] [27] [28] [29] .
Classic Models for Current Distribution
Nernst Planck equation is used to describe the current density on the electrode. And since most of the reaction/potential drop occurs in the near surface region of the electrodes, it is characterized using a double layer model developed by Bockris [30] . According to the model, the region is divided into layers where potential and concentration gradient exist, known as Helmholtz double layer and Gouy-Chapman diffuse layer. Here the electron flux is written as the sum of diffusive, convective and migrative flux as in Equation (1), Equation (2)
(1)
(2)
The significance of each term varies as a function of the scale of the system being modelled. Applied potential above the equilibrium potential for the electrolyte-electrode couple, known as overpotential, drives rates of either electrodeposition or dissolution reactions in the system. For an applied overpotential, the competing frequency of successful cation, anion jumps across the double layer is described by the Butler-Volmer equation (Equation (3)). This relation is widely used in models to relate the electrode current, overpotential and thus describe the kinetics of electro-migration at the electrode.
(3)
where i is the net current, i0 is the equilibrium current and is the overpotential, are the anodic and cathodic transfer coefficients.
Laplace equation (Equation (4)) is the most scalable equation in a comprehensive format that can be used to describe charge distribution. It applies well in cases of well mixed solution and where only a small fraction of conductivity of solution is derived from participating ions. However, the equation can be modified to represent surface or bulk charge by choosing appropriate boundary conditions. In a comprehensive case, the electric potential profile across a n-dimensional system can be given as a solution to Poisson’s equation of the form, (Equation (5))
(4)
(5)
The basic species transport in the typical electrochemical system is governed by electrical migration driven by potential gradient, diffusion driven by concentration gradient and convection of bulk driven by a local pressure gradient. However, in order to understand the effect of solution chemistry to the overall deposition rate, or shift in film stoichiometry or V-I relations, steady state models were developed. In such models the primary objective was to study the spatial variation of process parameters, metrics. In simpler models, the variation over one dimension was alone considered and other variables were averaged to assume simpler operating regimes and eliminate large numerical computations. Here, dimensionless numbers were used to describe operating regimes. Since the key driving forces in a system such as mass, charge and momentum transfer are largely dependent on the length scales, which in turn is dependent on the size of the system, electroplating systems of different sizes could be analyzed with different set of dimensionless groups. Table 1 below presents the important parameters influencing feature fill as in [31] .
The current distribution in an electroplating system is of major significance. Distribution of current is classified into four categories based on the scale of region of interest.
Roughness Scale―Microscopic features. Crystallographic planes, asperities
Feature Scale―Sub micron - Micron features, vias, channels
Pattern Scale―unit area of dense surface features

Table 1. Parameters influencing electroplating in feature scale.
Work Piece scale―Full wafer or PCB
Based on the scale of the system considered in the model, and the choice of dimensionless group, most dominating effect on the current distribution is identified in such models.
4. Building Comprehensive Models
Numerical methods are commonly used, powerful mathematical tools used to derive solutions to complex system of differential equations. Most applications, simulation packages are built using numerical methods as basis to solve large data sets in the form of matrices. Spatial profiles are obtained as solution of a well-defined boundary value problem. Transient profiles are generated by time stepping, where the solution to the i-1th iteration is used to create the boundary conditions for the ith iteration. Commonly used stepping methods are finite difference, finite element and boundary element method. In a feature scale the current evolution within every time step is considered constant. The surface evolution of boundaries in Electrochemical systems is two step―solving the steady state boundary conditions at i-1 and advancing the boundary based on its solution and feeding it as a boundary condition to the ith step.
An electroplating process can be characterized by four balance equations―Mass balance in bulk, mass balance on the surface, momentum transfer and charge balance. Nernst Planck equation (Equation (6)) governs the mass balance and can be used to determine the concentration gradient of ionic species in the bulk of the solution. In feature scale simulations, the pressure gradient across structures in the sub-micron level is insignificant. The convective transport out of high aspect ratio structure or in the near surface region is negligible and can be neglected, reducing the equation to Equation (7). However, for simulations targeting die or chip level fill profiles the bulk solution convection become important and the convective term has to be retained. The transport of non-charged species is dominated by diffusion, whereas, for charged species it is dictated by the combined effect of diffusion due to the existence of a concentration gradient and electrical migration in the presence of a potential gradient in a localized electric field in the electrolyte.
(6)
(7)
For any multicomponent system containing n species . Cbi represents the bulk concentration of ionic species in the electrolyte, Di, µi, zi are diffusivity, ionic mobility and valency of the charged species. Ui is the bulk velocity of the electrolyte, F is the Faradays constant, Φ the electric potential. Ri represents any chemical or physical reaction term. In the current application, Ri will be used to describe the surface reactions occurring at the electrode surface. The chemical material balance on the electrode surface can be described through Equation (8). This equation characterizes the transient nature of the competitive adsorptive and desorptive fluxes on the feature surfaces, but not limited to it.
(8)
The surface diffusion, Dsi of metal species and consequent boundary growth is an important aspect that determines the nature of the feature fill (superfill, conformal fill, subconformal fill). The effect of additives (accelerator, inhibitor, leveler) is also governed by diffusion and consequent distribution of these species along the trench surface. Although the term adds to the non-linearity of the system and increases computational complexity, it can be used to describe association, dissociation and other forward, reverse reactions in the near surface bulk and surface region. The reaction terms are hence highly dependent on the species for which it is being written, since bulk chemistry depends on pH, susceptibility to interact with surface etc., Hence a general understanding of the bulk phase chemistry is required before arriving at final rate equations. The mass transaction between the electrolyte and electrode surface of the system is described by the coupling reaction term Ri. The rate constants are usually determined data fitting the simulation results to experimental real time data sets and training the model. Initial guesses for rate constants are determined either for blanket small sample experiments or from literature. Another such parameter is the total number of available active sites expressed in site balance equation (Equation (9)). Rate equations for individual species, can be written as shown below (Equation (10)),
(9)
(10)
Csi represents the surface concentration of species “i” on the electrode. The diffusion coefficient Di is expressed in the Chapman Enskog form (Equation (11)). In a liquid system, where the system pressure, P is comparable to atmospheric pressure, the species diffusivity will be similar to molecular diffusivity, Dm. In system of scales where, the convective flux becomes significant, the distribution of species radially is accounted for in Di expressed as a sum of diffusion and axial dispersion. The dispersion coefficient is expressed as a function of velocity field in the system using the Aris-Taylor model [32] (Equation (12))
(11)
(12)
where, d is the diameter of the channel approximated to a circular system. The expression is applicable in all flow regimes since it is evaluated numerically at each grid as a function of local velocity. The axial dispersion term allows the model to account for net transport of molecules in the radial and axial direction. Modeling flow systems such as ones using rotating electrodes will benefit from it.
The transport of ions through electrical migration in the bulk as well as near surface regions is governed by the local electrical potential gradients generated in the system. The electrical potential in the system can be expressed as a function of space charge through Poissons equation (Equation (13))
(13)
In systems, where flow profile of electrolyte becomes important, governing equation for momentum balance needs to be incorporated to the system of equations. For simple laminar flow profile approximations, Hagen Poiseuille (Equation (14)) can be used to derive the average velocity, Uavg of the medium in a system of length L. For systems where significant pressure differences exist, a non-compressible version of Navier stokes expression (Equation (15)) is used.
(14)
(15)
where, u is the local velocity vector, ν is the kinematic viscosity of the fluid. For an incompressible flow assumption, the conservation of mass is also written as continuity equation as (Equation (17))
(16)
(17)
In order to solve the system of equations, appropriate boundary and initial conditions are required based on transience and number of dimensions in the equation. In feature scale systems, the walls are defined a non-permeable to electrolyte and bulk velocity is nil as a consequence. Steady state flux balances equations of the form (Equation (18)) are used at trench surfaces and at the mouth of the trench. Surface charge density, σs based on the dominant adsorbed species is written in the form (Equation (19)). The potential of the electrolyte bulk is mostly assumed as negligible considering a dilute solution.
(18)
(19)
where n is the unit normal to electrode surface and ε0, εr are the permittivity of free space and relative permittivity respectively. To determine the initial conditions for a simulation, assuming the system is perturbed from an equilibrium idle state is most ideal. This allows the clear definition of surface charge, concentration and bulk concentration based on values derived from equilibrium kinetics. If the rate of change of variable post perturbation is very high, the model can be run as two part. A steady state solution for equilibrium condition can be obtained and the solution matrices fed to as initial solution to the transient part. Meshing density and adaptation is changed per requirement to visualize fill process. Simultaneously solving the coupled system of PDE over a 2D or 3D system for a feature length scale system is very tedious and requires high computational power and is associated with long times. To bypass the computational requirement, systems are modelled using reasonable assumptions that may compromise on the resolution, versatility and accuracy of the solution but, derive faster solutions. Few examples are discussed.
5. Examples of Existing Work
Numerical simulation of shape evolution of fill in lithographic scale features was presented [27] . The focus of the work was to understand the fill profile across a feature as a function of its geometry owing to the distribution of precursor and additive species due to the non-uniform nature of diffusion and potential distribution. The theory behind the study being, the growth on a given area of a feature is dictated by the local current density governed by the potential gradient, and the concentration of additive and metal species governed by relative diffusive fluxes. The primary driver considered is species diffusion and current distribution along the electrode is modelled using potential theory. Hence, the system reduces to a set of homogeneous second order differential equations. These are then solved using no flux/symmetry boundary conditions at resist surfaces, bulk solution concentration at outer edge of boundary layer. At the deposition surface, the steady state boundary condition equates the diffusive flux to charge flux due to potential gradient.
(20)
(21)
The system of Laplace equations is then converted to a dimensionless form, so the final trends can be characterized in terms of dimensionless factors such as Sherwood number, Wagner number and dimensionless constant in the inhibitor model as shown below,
(22)
(23)
(24)
where CA is the concentration of the additive;, CM is the concentration of metal ion; is the average initial current density; w is the width of the feature; k is the electrolyte conductivity; klev is a constant in the inhibitor model. The solution is obtained through iteratively solving the set of Laplace type equations and using string method as the moving boundary scheme. Figure 6 shows model’s predictability compared to real fill scenarios.
In a conventional copper electroplating process for Through Silicon Vias (TSVs), the concentration of ions and growth velocity is higher on the top of the feature rather than in the bottom, leaving air gaps, voids or defects in the lower region. In order to obtain a uniform fill, several studies have been carried out to optimize the deposition parameters usually leading to introduction of new deposition parameters and techniques. The effect of organic additives on the electroplating bath at optimized amounts was found to greatly improve fill smoothness, compactness and achieve conformal fills as shown by [33] . The utilization of pulse current to deposit uniformly on submicron features was investigated [34] . The effects of frequency in pulse current deposition and reverse current density in features filled by pulse reversal current were presented as in [35] [36] .

Figure 6. Comparison of 1 mm wide plated-Cu profiles obtained experimentally with model prediction. Reprinted from Damascene copper electroplating for chip interconnections.
Chen et al., have developed a comprehensive finite element model using COMSOL Multiphysics package to study the effect of flow of electrolyte on TSVs [37] . The work deals with copper electroplating of micron scale features used in interconnects. To capture the effect of electrolyte flow on the trench, an incompressible Newtonian fluid was assumed under laminar flow regime. The fluid module comprises of Naiver Stokes and continuity equation as in Equations (15) (17). The boundary conditions for the system are of conventional design. Walls assume no slip condition ( ) and no normal velocity ( ), no tangential velocity ( ) is assumed on the fluid bulk and outlet respectively. Inlet and outlet velocities are given by Equations (25) (26)
(25)
(26)
The material balance in the system including transport through diffusion, convection and electrical migration, is expressed by Equation (27)
(27)
where Ni is the flux of various species in the electrolyte given by Nernst Planck type expression, Equation (28)
(28)
where flow rate and Φ the potential of electrolyte. The walls are defined as growth boundaries where flux is defined in terms of current i, which is represented by Butler-Volmer equation. Electrical neutrality is assumed in the solution bulk. Schematic shown in Figure 7 describes boundary conditions for mass transport equation.
Plating profile irregularities on features with different aspect ratios and taper profile, as a consequence of distribution of copper ions in solution were studied using a moving mesh boundary, where the local boundary velocity is given by,

Figure 7. Mass transport Boundary conditions for the system. Reprinted from Simulation of copper electroplating fill process of through silicon via.
(29)
Growth profiles using pulsed current technique were also generated for different incoming current waveforms. Figure 8 shows the axial copper ion distribution in the TSV trench using different pulsing frequencies and the tunable uniformizing effect it has on high aspect features.
The phenomenon of necking where the copper concentration and current are highest at the top of the trench is observed to be much severe in straight TSVs than tapered features. The model predicts the effect of fluid flow is highest on the top of the trench and has diminishing effect towards deep end of the feature.
Christoffer P. Nielsen and Henrik Bruus have developed a sharp interface model which includes the important effects of extended space-charge regions and nonlinear electrode reactions [38] . The model is validated by comparing its behavior in the initial stage with the predictions of a linear stability analysis. The work acknowledges the problem of morphological instabilities in a layer deposited during electrodeposition which subsequently leads to ramified growth of the electrode surface. Several studies and models have been built to understand this ramified growth regime [39] - [46] . Big contributions to our understanding of the growth process have come from diffusion-limited aggregation (DLA) models [47] [48] and, more recently, phase-field models similar to those which have successfully been applied to solidification problems.
Non-equilibrium extended space-charge region developed at near cathode regions at high voltages affects species transport and consequently deposition characteristics. DLA and phase charge models do not account for non-zero space charge densities reducing their applicability to the linear growth phases occurring at low voltages. Growth kinetics at electrolyte-electrode interface, characterized using Butler Volmer expression is also not considered in DLA and phase field methods. The model presented here has used an alternate approach to deal with non-zero space charge densities. The sharp interface model considers the growth interface to move at discrete steps based on comprehensive growth velocity instead of a continuously varying function. This allows the model to incorporate realistic boundary conditions for reaction interfaces. The model however is 2D and assumes an inherent quasi steady state approach and neglects fluid dynamic modelling, hence cannot be applied to flow systems.
Multiple electrode reaction model for electrodeposition of alloys on a rotating disk electrode was studied in [49] . Dilute solution theory is applied to assume no interaction between solute species and define the diffusion coefficient. Transport parameters are assumed spatially constant and uniform current density along the electrode is instituted removing the dependence on 2D spatial variation. The problem is thus reduced to a steady state, 1D mass transport equation dependent on concentration, potential and pressure gradient. Model is effective in dealing with dilute multicomponent systems processed in the laminar regime and can be used to predict the V-I relation, steady state concentration profile of each species in solution.

Figure 8. Copper Deposition profile along length of TSV trench at different frequency pulse currents. Reprinted from Simulation of copper electroplating fill process of through silicon via.
Degree of super filling or conformal filling of interconnect features determines the quality of fill or absence of defects/voids. The capability to super fill is highly dependent of the distribution and relative concentration of additive molecules present in the electrolyte bath. The effect of organic additives in achieving a defect/void free fill has been studied for several years. Apart from conventional plating factors such as feature aspect ratio, via entry diameter, electrolyte concentration, potential difference and surface kinetic factors, the effect of neutral organic additive species also needs to be characterized. Diffusion-Adsorption mechanism has been used to describe the leveling theory in several studies [25] [50] - [57] .
[58] discusses the significance of additive mobility and distribution in commercially relevant features in controlling void sizes and maintaining conformal fill process. The 2D quasi steady state model is built primarily using the material balance between the deposition and levelling components in the solution bulk and feature surface.
In sub-micron features the effect of fluid flow is negligible, hence convective transport is neglected. The variation of electric field in such features is also insignificant and hence the deposition kinetics is assumed to be dictated by the distribution of additive and deposition species in the feature. The plating tool design and line density of the wafer usually determine the current density and species concentration at the mouth of the trench. Wafer scale studies as demonstrated in [28] [59] [60] will be required in order to get realistic predictions of wafer level variations of parameters. In the scope of this work, these variations are assumed non-existent and uniform values are assumed at the bulk, where current density at mouth of trench is predicted by average plating current in the bulk.
The governing equations are hence reduced to Laplace 2D form. The individual steady state mass balance for plating and leveling agents is given by,
(30)
(31)
where is the half width of the trench or the via, i is the local current density given by assuming first order kinetics in C1 (copper ion concentration) and the fractional available surface sites θ is expressed by Langmuir type expression (Equation (32)).
(32)
where ip is the average plating current and ho the height of the trench. The consumption rate of leveling agent is given by rcons
(33)
where kc is the rate coefficient. The rate of growth or deposition rate is given as a function of local current density
(34)
here the analysis is carried out using dimensionless numbers that represent the penetration of copper and leveling agent into the feature.
(35)
(36)
On applying appropriate boundary conditions at the top and bottom of trench and combining equations, generalized solutions in terms of the dimensionless parameters are established. When c is low, the penetration depth is higher and vice versa. For a given aspect ratio, where inhibitor is available in excess in solution, the penetration of the inhibitor has an optimal where conformal void free fill can be achieved. When the penetration is too high it is shown that the void formation can be seen and is due to i increasing locally and driving high Cu ion concentration. This case is worse than situation where inhibitor is completely absent. Figure 9 depicts the influence of metal and leveling agent on fill characterized by dimensionless groups in the model.
For similar conditions, the relative penetration of the species, RLA:RCu is shown to have an optimal value beyond which statistically smaller number of features are defect free. For low RLA:RCu, probability of pinch off is very high. When smaller features are being filled the model predicts that the variation in local current density within the trench can be high enough to cause variations in local deposition rates causing void formation. Such variations may arise from inherent imperfections such as surface roughness, seed layer uniformity, feature shape etc., Hence, for a given system with a combination of feature sizes, the nature of leveling agent may need to be engineered to achieve a uniform fill and better process control.
Higher probability of defects is shown to be likely under higher average plating rates. General guidelines for leveling agent concentrations can be derived to optimize deposition rate vs void formation. The model is also extended to application of electroplating in vias and generates similar trends for achieving robust, defect free fills.
The effect of organic additives in achieving a defect/void free fill has been studied for several years. Over the years, a mix of organic cocktails containing species that can be generically classified as accelerator, leveler and suppressor have been introduced. Under the influence of these additives, the deposition is driven towards the superfill regime where the bottom of the trench is filled faster than the top, avoiding pinch off or “dogboning”. Conventional diffusion-adsorption theories do not account for the surface dynamics during the plating process. [61] [62] [63] and [64] have published models to understand the formation of bumps under conditions where one of the additive is absent. The model assumes that the deposition at the bottom of the trench transitions from a inhibitive to a non-inhibitive state temporarily, due to change in availability of active surface sites for adsorption of additive species. A numerical model is developed based on transient equations for competitive surface coverage of additives PEG and SPS,
(37)

Figure 9. Influence of copper distribution and leveling agent on fill performance. Reprinted from Theory of Filling of High-Aspect Ratio Trenches and Vias in Presence of Additives.

Figure 10. Model prediction showing growth profile in trenches of different sizes. Reprinted from A superfilling model that predicts bump formation.
where A is the local surface area, t is the time, k1 is the rate constant, θSPS, θSPS,eq is the surface coverage of additive accelerator species at time t and at equilibrium respectively. The local current density is affected by the presence of inhibitor surface coverage θPEG. The current density and PEG coverage can expressed as,
(38)
(39)
where K is a fitting constant obtained by matching experimental data, ino is the current achieved under no PEG conditions. Initial equilibrium condition is given by solving Langmuir type steady state expression.
(40)
The model results in [64] show that in the absence of a levelling agent, the active sites at the bottom of the trench decrease as surface shape evolves. The inability of inhibitor to adsorb on the bottom allows the growth to accelerate temporarily and create bumps. Although the model is able to predict bump formation a detailed parameter analysis is required to refine it. Simulated profiles are shown in Figure 10.
Conflicts of Interest
The authors declare no conflicts of interest regarding the publication of this paper.
Cite this paper
Jhothiraman, J.K. and Balachandran, R. (2019) Electroplating: Applications in the Semiconductor Industry. Advances in Chemical Engineering and Science, 9, 239-261. https://doi.org/10.4236/aces.2019.92018
References
- 1. Moore, G.E. (1965) Cramming More Components onto Integrated Circuits. Electronics, 38, 114-117.
- 2. Torres, J. (1995) Advanced Copper Interconnections for Silicon CMOS Technologies. Applied Surface Science, 90, 112-123. https://doi.org/10.1016/0169-4332(95)00105-0
- 3. Gupta, T. (2009) Copper Interconnect Technology. Springer-Verlag Publication, Berlin, 423 p.
- 4. Andricacos, P.C. (1997) Copper On-Chip Interconnections: A Breakthrough in Electrodeposition to Make Better Chips. The Electrochemical Society Interface, 8, 32-37.
- 5. Baklanov, M.R., Adelmann, C., Zhao, L. and De Gendt, S. (2015) Advanced Interconnects: Materials, Processing and Reliability. ECS Journal of Solid State Science and Technology, 4, Y1-Y4. https://doi.org/10.1149/2.0271501jss
- 6. Liske, R., Krause, R., Uhlig, B., Gerlich, L., Bott, S., Wislicenus, M. and Preusse, A. (2016) The Influence of Adsorption Kinetics on Copper Superfilling for Dual Damascene. Journal of the Electrochemical Society, 163, D213-D220. https://doi.org/10.1149/2.0261606jes
- 7. Moffat, T.P., Bonevich, J.E., Huber, W.H., Stanishevsky, A., Kelly, D.R., Stafford, G.R. and Josell, D. (2000) Superconformal Electrodeposition of Copper in 500-90 nm Features. Journal of the Electrochemical Society, 147, 4524-4535. https://doi.org/10.1149/1.1394096
- 8. Dow, W.-P., Huang, H.-S. and Lin, Z. (2003) Interactions between Brightener and Chloride Ions on Copper Electroplating for Laser-Drilled Via-Hole Filling. Electrochemical and Solid-State Letters, 6, C134-C136. https://doi.org/10.1149/1.1595311
- 9. Shao, W., Pattanaik, G. and Zangari, G. (2007) Influence of Chloride Anions on the Mechanism of Copper Electrodeposition from Acidic Sulfate Electrolytes. Journal of Electrochemical Society, 154, D201-D207. https://doi.org/10.1149/1.2434682
- 10. Yokoi, M. (2013) Suppression Effect and Additive Chemistry. In: Kazuo, K., Rohan, N.A., Dale, P.B. and Masayuki, Y., Eds., Copper Electrodeposition for Nanofabrication of Electronics Devices, Springer, New York, 27-43.
- 11. Dow, W.-P. and Huang, H.-S. (2005) Roles of Chloride in Microvia Filling by Copper Electrodeposition I. Studies Using SEM and Optical Microscope. Journal of the Electrochemical Society, 152, C67-C76. https://doi.org/10.1149/1.1849934
- 12. Dow, W.-P., Huang, H.-S., et al. (2005) Roles of Chloride in Microvia Filling by Copper Electrodeposition II. Studies Using EPR and Galvanostatic Measurements. Journal of the Electrochemical Society, 152, C77-C88.
- 13. Min, T., Clint, G., Dean, R.W. and John, N.H. (2007) The Role of SPS, MPSA, and Chloride in Additive Systems for Copper Electrodeposition. Journal of the Electrochemical Society, 154, D78-D81. https://doi.org/10.1149/1.2401057
- 14. Kelly, J.J. and West, A.C. (1998) Copper Deposition in the Presence of Polyethylene Glycol I. Quartz Crystal Microbalance Study. Journal of Electrochemical Society, 145, 3472-3476. https://doi.org/10.1149/1.1838829
- 15. Gabrielli, C., Mocoteguy, P., Perrot, H., Nieto-Sanz, D. and Zdunek, A. (2006) A Model for Copper Deposition in the Damascene Process. Electrochimica Acta, 51, 1462-1472. https://doi.org/10.1016/j.electacta.2005.02.127
- 16. Vereecken, P.M., Binstead, R.A., Deligianni, H. and Andricacos, P.C. (2005) The Chemistry of Additives in Damascene Copper Plating. IBM Journal of Research and Development, 49, 3-18. https://doi.org/10.1147/rd.491.0003
- 17. Delbos, E., Omnes, L. and Etcheberry, A. (2010) Copper Electrodeposition Parameters Optimization for Through-Silicon Vias Filling. ECS Transactions, 25, 109-118.
- 18. Bioh, K., Charles, S., Tom, R. and Dan, S. (2006) Factors Affecting Copper Filling Process within High Aspect Ratio Deep vias for 3D Chip Stacking. IEEE Electronic Components and Technology Conference, San Diego, 838-843.
- 19. Lindsay, B. and Uziel, L. (2015) Rapid Screening of Plating Additives for Bottom-Up Metallization of Nano-Scale Features. Journal of Applied Electrochemistry, 46, 39-46.
- 20. Song, S.J., et al. (2016) Effect of Molecular Weight of Polyethylene Glycol on Copper Electrodeposition in the Presence of Bis-3-sulfopropyl-disulfide. International Journal of Electrochemical Science, 11, 10067-10079.
- 21. Takahashi, K.M. and Gross, M.E. (1999) Transport Phenomena That Control Electroplated Copper Filling of Submicron vias and Trenches. Journal of the Electrochemical Society, 146, 4499-4503. https://doi.org/10.1149/1.1392664
- 22. Sethian, J.A. (1999) Level Set Methods and Fast Marching Methods: Evolving Interfaces in Computational Geometry, Fluid Mechanics, Computer Vision, and Materials Science. Cambridge University Press, Cambridge.
- 23. Defay, R. and Bellemans, A. (1966) Surface Tension and Adsorption. Longman, London.
- 24. Mullins, W.W. (1957) Theory of Thermal Grooving. Journal of Applied Physics, 28, 333. https://doi.org/10.1063/1.1722742
- 25. Dukovic, J.O. and Tobias, C.W. (1990) Simulation of Leveling in Electrodeposition. Journal of the Electrochemical Society, 137, 3748-3755. https://doi.org/10.1149/1.2086296
- 26. Mehdizadeh, S., Dukovic, J., Andricacos, P.C., Romankiw, L.T. and Cheh, H.Y. (1993) The Influence of Lithographic Patterning on Current Distribution in Electrodeposition: Experimental Study and Mass-Transfer Effects. Journal of the Electrochemical Society, 140, 3497-3505. https://doi.org/10.1149/1.2221118
- 27. Dukovic, J.O. (1993) Feature-Scale Simulation of Resist-Patterned Electrodeposition. IBM Journal of Research and Development, 37, 125-142. https://doi.org/10.1147/rd.372.0125
- 28. DeBecker, B. and West, A.C. (1996) Workpiece, Pattern, and Feature Scale Current Distributions. Journal of the Electrochemical Society, 143, 486-492. https://doi.org/10.1149/1.1836469
- 29. Pillay, B. and Newman, J. (1993) Modeling Diffusion and Migration in Dilute Electrochemical Systems Using the Quasi-Potential Transformation. Journal of the Electrochemical Society, 140, 414-420. https://doi.org/10.1149/1.2221060
- 30. White, R.E. (1980) Comprehensive Treatise of Electrochemistry. 143.
- 31. Varadarajan, D., Lee, C.Y., Krishnamoorthy, A., Duquette, D.J. and Gill, W.N. (2000) A Tertiary Current Distribution Model for the Pulse Plating of Copper into High Aspect Ratio Sub-0.25 μm Trenches. Journal of the Electrochemical Society, 147, 3382-3392. https://doi.org/10.1149/1.1393910
- 32. Bird, R.B., Stewart, W.E. and Lightfoot, E.N. (1960) Transport Phenomena. 2.
- 33. Andricacos, P.C., Uzoh, C., Dukovic, J.O., Horkans, J. and Deligianni, H. (1998) Damascene Copper Electroplating for Chip Interconnections. IBM Journal of Research and Development, 42, 567-574.
- 34. Chen, M.N., Zeng, L., Wang, L.K., Zhang, W., Xu, S.S. and Zhang, L.F. (2007) Effect of Organic Additives on Pulsed Electroplating of Cu Interconnect. Semiconductor Technology, 32, 387-390.
- 35. Lin, J.Y., Wan, C.C., Wang, Y.Y. and Feng, H.P. (2007) Void Defect Reduction after Chemical Mechanical Planarization of Trenches Filled by Direct/Pulse Plating. Journal of the Electrochemical Society, 154, D139-D144. https://doi.org/10.1149/1.2409869
- 36. Yang, X., Ling, H., Ding, D., Li, M., Yu, X. and Mao, D. (2009) Through-Silicon via Filling Process Using Pulse Reversal Plating. International Conference on Electronic Packaging Technology & High Density Packaging, 10 August 2009, 91-95. https://doi.org/10.1109/ICEPT.2009.5270788
- 37. Chen, Z. and Liu, S. (2010) Simulation of Copper Electroplating Fill Process of through Silicon via. 11th International Conference on Electronic Packaging Technology & High Density Packaging, 16 August 2010, 433-437.
- 38. Nielsen, C.P. and Bruus, H. (2015) Sharp-Interface Model of Electrodeposition and Ramified Growth. Physical Review E, 92, Article ID: 042302. https://doi.org/10.1103/PhysRevE.92.042302
- 39. Chazalviel, J.N. (1990) Electrochemical Aspects of the Generation of Ramified Metallic Electrodeposits. Physical Review A, 42, 7355. https://doi.org/10.1103/PhysRevA.42.7355
- 40. Bazant, M.Z. (1995) Regulation of Ramified Electrochemical Growth by a Diffusive Wave. Physical Review E, 52, 1903. https://doi.org/10.1103/PhysRevE.52.1903
- 41. Sundström, L.G. and Bark, F.H. (1995) On Morphological Instability during Electrodeposition with a Stagnant Binary Electrolyte. Electrochimica Acta, 40, 599-614. https://doi.org/10.1016/0013-4686(94)00379-F
- 42. Gonzalez, G., Rosso, M. and Chassaing, E. (2008) Transition between Two Dendritic Growth Mechanisms in Electrodeposition. Physical Review E, 78, Article ID: 011601.
- 43. Nishikawa, K., Chassaing, E. and Rosso, M. (2013) Evolution of the Morphology of Electrodeposited Copper at the Early Stage of Dendritic Growth. Journal of the Electrochemical Society, 160, D183-D187. https://doi.org/10.1149/2.087304jes
- 44. Trigueros, P.P., Claret, J., Mas, F. and Sagués, F. (1991) Pattern Morphologies in Zinc Electrodeposition. Journal of Electroanalytical Chemistry and Interfacial Electrochemistry, 312, 219-235. https://doi.org/10.1016/0022-0728(91)85155-I
- 45. Kahanda, G.L. and Tomkiewicz, M. (1989) Morphological Evolution in Zinc Electrodeposition. Journal of the Electrochemical Society, 136, 1497-1502. https://doi.org/10.1149/1.2096949
- 46. Nikolić, N.D., Popov, K.I., Pavlović, L.J. and Pavlović, M.G. (2006) Morphologies of Copper Deposits Obtained by the Electrodeposition at High Overpotentials. Surface and Coatings Technology, 201, 560-566. https://doi.org/10.1016/j.surfcoat.2005.12.004
- 47. Lambert, C., Lauque, P., Seguin, J.L., Albinet, G., Bendahan, M., Debierre, J.M. and Knauth, P. (2002) Solid-State Electrolysis in CuBr Thin Films: Observation and Modelling of Fractal Growth. ChemPhysChem, 3, 107-110. https://doi.org/10.1002/1439-7641(20020118)3:1<107::AID-CPHC107>3.0.CO;2-2
- 48. Witten, T.A. and Sander, L.M. (1983) Diffusion-Limited Aggregation. Physical Review B, 27, 5686. https://doi.org/10.1103/PhysRevB.27.5686
- 49. Chen, S., Yin, K.M. and White, R.E. (1988) A Mathematical Model for the Electrodeposition of Alloys on a Rotating Disk Electrode. Journal of the Electrochemical Society, 135, 2193-2200. https://doi.org/10.1149/1.2096238
- 50. Deligianni, H., Dukovic, J.O., Andricacos, P.C. and Walton, E.G. (1999) Electrochemical Processing in ULSI Fabrication and Semiconductor/Metal Deposition II. In: Andricacos, P.C., Searson, P.C., Reidsema-Simposon, C., Allongue, P., Stickney, J.L. and Oleszek, G.M., Eds., ULSI Fabrication and Semiconductor/Metal Deposition II, PV 99-9, The Electrochemical Society Proceedings Series, Pennington, NJ, 52.
- 51. Kruglikov, S.S., Kudryavtsev, N.T. and Sinyakov, U.I. (1966) Co-Deposition of Sulphur from Acid Copper Solution Containing Thiourea. Transactions of the IMF, 44, 152-160. https://doi.org/10.1080/00202967.1966.11870001
- 52. Roha, D. and Landau, U. (1990) Mass Transport of Leveling Agents in Plating: Steady-State Model for Blocking Additives. Journal of the Electrochemical Society, 137, 824-834. https://doi.org/10.1149/1.2086563
- 53. Jordan, K.G. and Tobias, C.W. (1991) The Effect of Inhibitor Transport on Leveling in Electrodeposition. Journal of the Electrochemical Society, 138, 1251-1259. https://doi.org/10.1149/1.2085768
- 54. Cheng, C.C. and West, A.C. (1998) Flow Modulation as a Means of Studying Leveling Agents. Journal of the Electrochemical Society, 145, 560-564. https://doi.org/10.1149/1.1838303
- 55. Cheng, C.C. and West, A.C. (1997) Nickel Deposition in the Presence of Coumarin an Electrochemical Impedance Spectroscopy Study. Journal of the Electrochemical Society, 144, 3050-3056. https://doi.org/10.1149/1.1837957
- 56. Madore, C., Matlosz, M. and Landolt, D. (1996) Blocking Inhibitors in Cathodic Leveling I. Theoretical Analysis. Journal of the Electrochemical Society, 143, 3927-3936. https://doi.org/10.1149/1.1837318
- 57. Madore, C. and Landolt, D. (1996) Blocking Inhibitors in Cathodic Leveling II. Experimental Investigation. Journal of the Electrochemical Society, 143, 3936-3943. https://doi.org/10.1149/1.1837319
- 58. West, A.C. (2000) Theory of Filling of High-Aspect Ratio Trenches and Vias in Presence of Additives. Journal of the Electrochemical Society, 147, 227-232. https://doi.org/10.1149/1.1393179
- 59. Dukovic, J.O. (1990) Computation of Current Distribution in Electrodeposition, a Review. IBM Journal of research and Development, 34, 693-705. https://doi.org/10.1147/rd.345.0693
- 60. Kessler, T. and Alkire, R. (1976) Copper Plating of Multilayer Printed Wiring Boards. Plating and Surface Finishing, 63, 22-27.
- 61. Taephaisitphongse, P., Cao, Y. and West, A.C. (2001) Electrochemical and Fill Studies of a Multicomponent Additive Package for Copper Deposition. Journal of the Electrochemical Society, 148, C492-C497. https://doi.org/10.1149/1.1376636
- 62. Cao, Y., Taephaisitphongse, P., Chalupa, R. and West, A.C. (2001) Three-Additive Model of Superfilling of Copper. Journal of the Electrochemical Society, 148, C466-C472. https://doi.org/10.1149/1.1377898
- 63. Moffat, T.P., Wheeler, D., Huber, W.H. and Josell, D. (2001) Superconformal Electrodeposition of Copper. Electrochemical and Solid-State Letters, 4, C26-C29. https://doi.org/10.1149/1.1354496
- 64. West, A.C., Mayer, S. and Reid, J. (2001) A Superfilling Model That Predicts Bump Formation. Electrochemical and Solid-State Letters, 4, C50-C53. https://doi.org/10.1149/1.1375856