Journal of Biomaterials and Nanobiotechnology
Vol.3 No.1(2012), Article ID:17003,9 pages DOI:10.4236/jbnb.2012.31009
Commensal E. coli Strains Uniquely Alter the ECM Topography Independent of Colonic Epithelial Cells
![]()
1Department of Medicine, University of Florida, Gainesville, USA; 2Department of Biomedical Engineering, University of Florida, Gainesville, USA; 3Department of Bioengineering, University of Illinois at Chicago, Chicago, USA.
Email: sarah.glover@medicine.ulf.edu
Received October 16th, 2011; revised November 18th, 2011; accepted December 20th, 2011
Keywords: Topography; Extra Cellular Matrix; Commensal Bacteria; Western Blot; Collagen Fiber
ABSTRACT
The relationship between commensal bacteria and the epithelial cells lining the colon is normally symbiotic. However, in the setting of diseases which lead to a loss of the protective mucosal layer such as inflammatory bowel disease or colon cancer, commensal bacteria gain the ability to alter both the behavior of epithelial cells as well as their surrounding extra cellular matrix (ECM). While much work has been done to understand the effects of bacteria on diseased epithelial cells in the colon, very little has been done to understand their impact on the ECM. In our previous work, we have shown that topographical changes in the ECM on the luminal side of the colon have a profound influence on the behavior of colonic epithelial cells. However, we do not understand all of the mechanisms that lead to changes in the ECM topography. This study aimed to understand the role that commensal E. coli strains play in altering the ECM topography of type-1 collagen scaffolds. To do this, 1.2 mg/ml type 1 collagen scaffolds were infected with various commensal bacterial strains. At 24 hours post-infection collagen fiber dimensions and substrate topography were determined using standard molecular biology techniques and advanced imaging. Intriguingly, all of the commensal E. coli strains showed some form of substrate degradation. Especially in the case of commensal E. coli strain HS4, maximum nano-scaled protrusions were observed. This data suggests, for the first time, that studying the effects of bacteria alone on the ECM may be critical to improving our understanding of how the cellular microenvironment changes in both health and disease.
1. Introduction
Colonic bacteria have both a positive and negative role in maintaining gut physiology. Bacteria, through the process of fermentation, produce several different compounds that affect the stability of colon. For example, colonic bacteria produce short-chain fatty acids from the metabolism of complex carbohydrates and proteins [1-3]. Colonic bacteria, especially the pathogenic E. coli has been known to cause diarrhea and several other digestive tract disorders [3].
The effect of bacterial strains on the onset of colon cancer is not clearly known. Several studies indicate that the presence of bacteria within the gut may influence cellular behavior and activate certain pathways that trigger carcinogenesis [3]. Moreover, while much work has been done to understand the effects of bacteria on diseased epithelial cells in the colon, very little has been done to understand how they can impact the ECM.
Similarly, colon tissue in-vivo has distinct topographical features that influence the cellular function. Structural features of bacteria act not only to respond through surface receptors, focal adhesions and either direct or indirect mechano-transduction pathways to the nanotopography but to also change the nanotopography of their surrounding environment. Since basement membranes of various tissues including the colon are composed of complex mixtures of nanoscale topography (5 - 200 nm) such as pits, pores, protrusions, striations, particulates, and fibers, nanotopography may be more significant in affecting cell behavior than the larger scale micro-to-pography of underlining tissues [4].
In general, cell interaction with a nanotopographical surface is very much the same as interaction at any other scale; however, on a nanometer scale discrete attachment sites between the surface and the cell exist [5]. Although several different biological molecules are responsible for these discrete cell-to-surface attachments, the most common are integrins. Once the integrins attach to a surface, integrin receptors cluster together and recruit cytoplasmic proteins to form focal adhesions. The specific type of integrins recruited delegates on the structure and function of each focal adhesion and is dependent on the environment outside the cell as well as the motifs programmed into the protein structure, the most common being the RGD motif. Although the majority of focal adhesions appear to be at a micrometer scale ranging from 1 µm to 5 µm, integrins themselves are nanometer building blocks, about 8 - 12 nm each, that arrange and rearrange together to form the overall structures affected by surface nanotopography [6]. In addition, surface chemistry on a nanometer scale plays a role in deciding which type of integrins are recruited and in turn also affecting the function of the focal adhesion. Because integrins and focal adhesions are linked to the nucleus directly through cytoskeletal structures or indirectly through signal transduction pathways, they can influence gene expression and cell behavior. Not only then is nanotopography likely to have a significant influence on the organization and type of focal adhesions formed, but it also affects cell fate.
Thus far, few studies have concentrated on the interaction between bacteria and nano-topographical surface features. Although one study has shown evidence that nanotopography plays a role in altering bacterial behavior through similar though far less known mechanisms as in eukaryotic cells, i.e. focal adhesions, mechano-receptors, and surface features such as flagella [6], less is known about how bacteria itself alters the nanotopography of the surface and by which mechanism it does so.
Understanding the behavior of bacteria on nano-structured surfaces is essential for the design of surfaces that enhance or inhibit bacterial colonization. However, it is just as important to study how bacteria alter the surface topography of the substrate at a nano-scale. Since colonic tissue is constantly exposed to several different commensal bacteria, it is essential to determine the effect these commensal bacteria have on the surrounding colonic tissue. The goal of this study was to understand how commensal bacteria alter the ECM topography in an in-vitro model of colon.
2. Materials and Methods
2.1. Reagents and Supplies
Experiments were performed in dishware from BD Falcon (Lincoln Park, NJ). Type I rat tail collagen was purchased from BD Bioscience (Bedford, MA). Antibodies recognizing collagen I as well as HRP conjugated secondary antibodies were from Santa Cruz Biotechnology (Camarillo, CA). Hexamethyldislazane (HMDS) was purchased form Electron Microscopy Sciences (Hatfield, PA). Western blot analysis was performed using the ECL Plus detection system from GE Healthcare (Piscataway, NJ) and PVDF transfer membranes from Millipore (Billerica, MA). Drying was performed using anhydrous calcium sulfate (Drierite) manufactured by W.A. Hammond Drierite Company (Xenia, Ohio). All other supplies were molecular biology grade and were from Fisher Scientific (Pittsburg, PA).
2.2. Creation of 3-D Scaffolds
To create Type I collagen scaffold, collagen was placed into a solution of 0.1 M sodium hydroxide combined with 10× Hanks buffered salt solution (HBSS). DMEM/ F12 media supplemented with 10% Fetal Bovine Serum (FBS) was added to this mixture and then was neutralized using 0.1 M acetic acid to create a gel of 1.2 mg/ml. 800 ml of the collagen gel mixture was placed into each well of a 12-well plate and incubated for one hour prior to seeding.
2.3. Infection of Scaffolds
Scaffolds were infected with either commensal E. coli strains. Bacteria were grown overnight in LB Broth on a bacterial shaker at 37˚C. 1 ml of bacterial culture was added to 5 ml of serum-free media and placed on a shaker at 37˚C for two hours.
Bacterial concentration was determined by measuring the optical density (OD) at 600 nm. Bacteria were added to the scaffolds at an MOI = 40 per cell in FBS-free DMEM/F-12 media. Bacteria infected collagen samples were then incubated at 37˚C for two hours. Bacteria containing media was then removed and the scaffolds were treated with gentamicin at a concentration of 50 mg/ml for two hours. Following removal of antibiotic containing media, scaffolds were incubated overnight in fresh serum-free media containing 10 mg/ml gentamicin.
2.4. Multi-Photon Micrscopy
Multi-photon imaging holds inherent advantages for imaging living tissues by improving depth penetration and reducing photo-damage [7]. Two-photon or multi-photon imaging allows the mapping of fluorophore or Second Harmonic Generation (SHG) distribution inside tissue down to a depth of over 500 µm providing sub-cellular level tissue morphological information. Approximate height of the bacterial infected collagen scaffold was 5 mm.
Collagen I scaffolds were infected according to the protocol mentioned earlier. Scaffolds were then washed with phosphate buffered saline (PBS), fixed overnight with 10% neutral buffered formalin.
Collagen fibers were imaged by a laser scanning multiphoton confocal microscope with 60× oil objective (NA = 1.40). SHG was generated using a titanium sapphire laser (MaiTai, Spectra-Physics Inc., CA) providing ~ 100 fs pulses at 80 MHz at 700 - 1000 nm wavelengths. This was coupled with visible laser (Bio-Rad, UK) into an inverted laser scanning confocal microscope (Nikon TE200- U, Japan).
2.5. Scanning Electron Microscopy
Collagen scaffolds were fixed with Trump’s fixative (80 mM sodium monobasic phosphate, 67.5 mM sodium hydroxide, 3.75% formaldehyde, and 1% gluteraldehyde in water) for 24 hours. Samples were then washed with distilled water and prepared for SEM by alcohol dehydration. They were submerged in a series of ethanol washes varying in percent of ethanol (70%, 85%, 95%, and 100%) and then dried by placing them in HMDS for 5 - 15 minutes. Collagen samples were not coated with sputtered metallic layer before SEM observation. These uncoated specimens were mounted onto metal stubs with carbon-coated tabs and dried further using Anhydrous Calcium Sulfate. SEM images were obtained using a Hitachi S-3000N scanning electron microscope in variable pressure mode (Hitachi, Tokyo, Japan).
2.6. Collagen Fiber Analysis
Confocal and Multi-photon images were utilized to quantify collagen fiber dimensions. Collagen fiber length was determined by measuring the distance between each cross-linked fiber. Fibrillar collagen, such as collagen type I, is known to form cross links and it is assumed that shorter distance between the cross-links corresponds to the increased stability of collagen scaffold [8]. A similar approach was used in this paper to determine the length of collagen fiber. 2 different sets of images were compared. The individual sets were taken at different times. Each set contained 3 samples for each bacterial condition.
Collagen fiber diameter was calculated using the values generated for the total area of the collagen fiber. The total area of collagen fiber and the pore area were generated using LaserSharp 2000, a commercially available software, which was used in conjunction with multiphoton images. A student t-test was performed to test for significance.
2.7. Roughness Analysis
There are many different ways to characterize surfaces and to compare them to each other, visual comparison being the most common. In addition, roughness parameters that have previously been identified as important to regulating cell motility, adhesion, and morphology were quantified for each tissue type [9-13]. These roughness parameters were directly calculated using the MeX software and were derived from surface profiles extracted from the reconstructed 3-D models. Briefly, stereopair images were obtained at 0˚ and +7˚ from the horizontal and input into the MeX image analysis software program (Alicona Imaging, Graz, Austria). The tilt angle along with the working distance and the size of image pixels were also input for proper calibration. Reconstruction was then performed in two steps. First, corresponding points were extracted from the stereoscopic images. Secondly, metrically correct 3D points were calculated using the geometric relationships from the SEM identified in the first step. While the data presented in this paper were generated from stereopairs, MeX has an extended method called the triCreator that utilizes three input images with different tilt angles. This method provided even more accurate height measurements since it permitted estimation of true tilt angles.
The extraction of roughness parameters from surface profiles [14-16] is based on the decomposition of a primary profile or primary curve into a roughness profile that contains the high frequency information and a waviness profile that contains the low frequency information. The surface being analyzed can be broken up into specific surface texture components, such as hills, valleys, or bumps. The surface bumps correspond to finer irregularities of the surface texture, which represent roughness. The hills and valleys represent irregularities that are more spaced out and correspond to waviness. All these components put together make up what is known as the primary profile curve [17]. Each of the parameters used to form a primary curve are listed in Table 1.

Table 1. Roughness parameters.
2.8. Statistics
Data was analyzed using Student’s t-distribution using average values and the associated standard deviation. A comparative P-value of less than 0.05 was considered significant.
3. Results
3.1. Collagen Fiber Length Is Altered by Some Commensal E. coli Strains
Substrates infected with commensal E. coli strains were imaged using confocal microscopy as described in methods section. Collagen fiber dimensions, specifically fiber diameter, fiber length and pore size were measured using image analysis techniques as described in methods section.
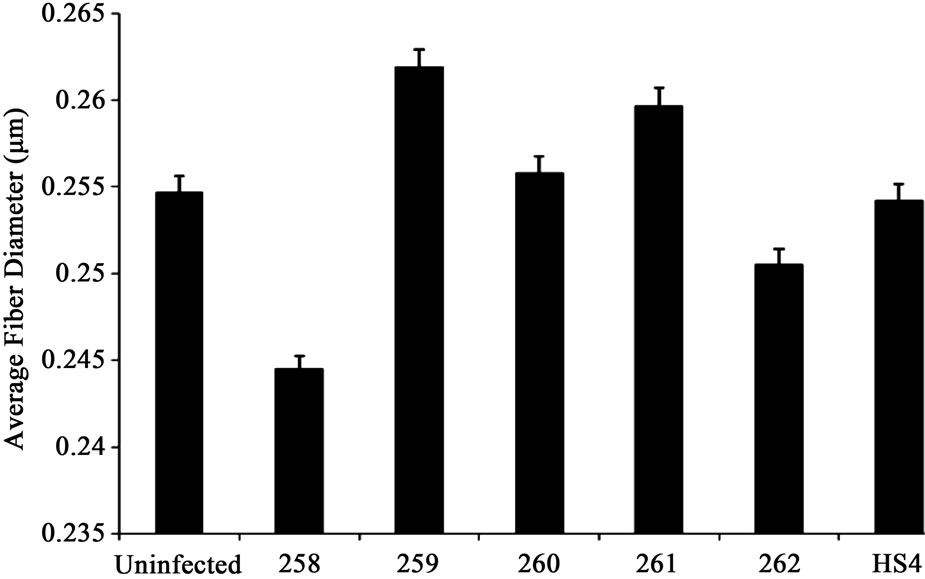
Commensal bacterial strains 259 and 261 slightly increased collagen fiber diameter whereas a decrease in fiber diameter was observed in samples treated with commensal bacterial strains 258 and 262 (Figure 1(a)). This was not significant.
Collagen fiber length decreased in scaffolds infected with commensal bacterial strains 258 and 262. Especially when infected with 258, a 2-fold decrease compared to control was observed. Collagen fiber length increased 1.5-fold in scaffolds infected with commensal bacterial strains 259 and 261. Treatment with HS4 did not affect collagen fiber length significantly (Figure 1(b)).
Average pore area decreased when samples were infected with commensal bacterial strain 258 and 262. However, an increase in pore area was observed when samples were treated with commensal bacterial strains 259, 260 and 261(Figure 2). Especially in samples infected with commensal bacterial strain 260, a 3-fold increase in average pore area was observed (Figure 1(c)).
 (a)
(a)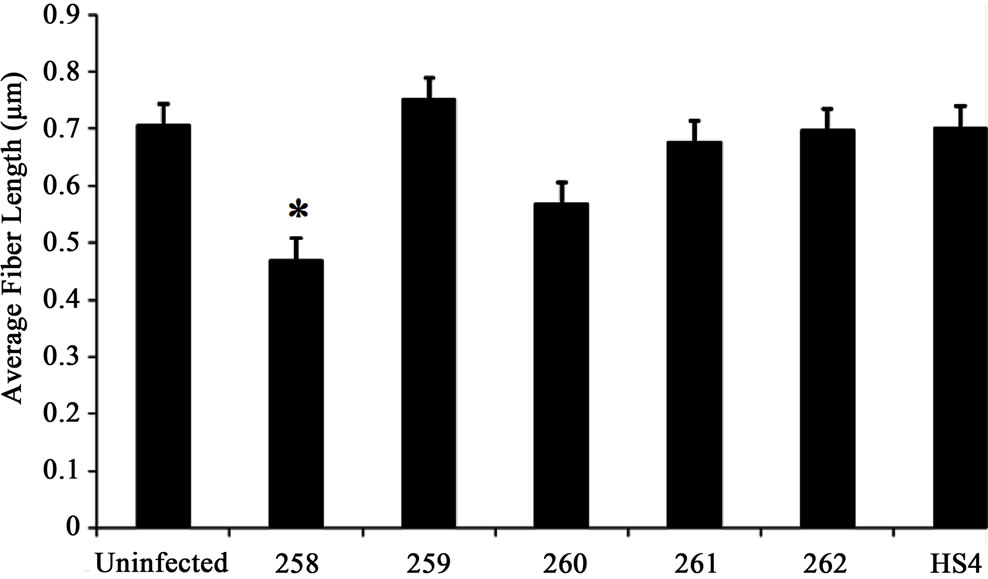 (b)
(b)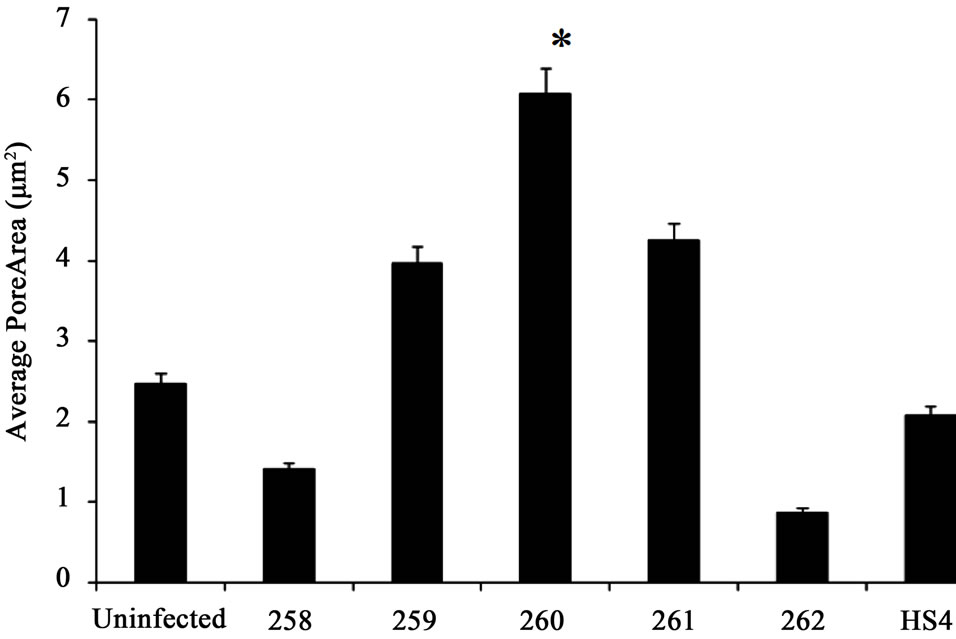 (c)
(c)
Figure 1. (a) Collagen fiber diameter did not significantly differ in samples treated with different commensal bacterial strains. However, commensal bacterial strains 259 and 261 slightly increased collagen fiber diameter whereas a decrease in fiber diameter was noted in samples treated with commensal bacterial strains 258 and 262; (b) Collagen fiber length decreased in scaffolds infected with commensal bacterial strains 258 and 260. Especially when infected with 258, a two-fold decrease was observed. Collagen fiber length increased 1.5-fold in scaffolds infected with commensal bacterial strains 259 and 261. Treatment with HS4 did not affect collagen fiber length significantly; (c) Average pore area decreased when samples were infected with commensal bacterial strain 258 and 262. An increase in pore area was observed when samples were treated with commensal bacterial strains 259, 260 and 261. A three-fold increase in pore area was noted in samples infected with commensal bacterial strain 260. Student t-test was performed and statistical significance is indicated by symbol (*).
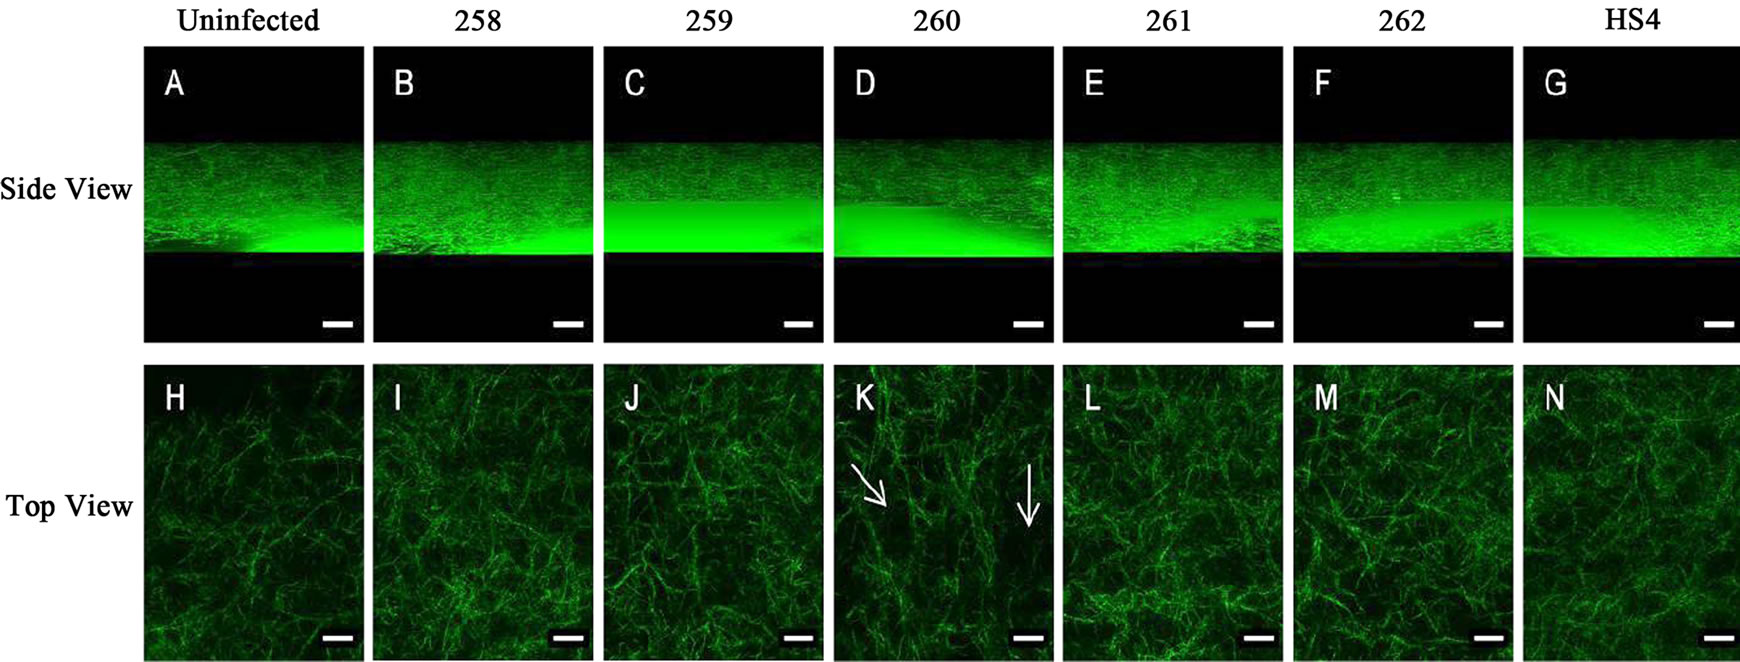
Figure 2. Samples infected with commensal E. coli strains affected collagen I substrate integrity by altering collagen fiber. The side view corresponds to substrate visualized in the Z-direction. No significant change was observed in collagen fiber integrity when treated with different commensal E. coli strains. Samples visualized from the top showed an increase in pore area especially in samples treated with commensal E. coli strain, 260 (indicated by arrow). Pore area decreased in samples treated with commensal E. coli strains 258 and 262.
3.2. HS4 Bacterial Strain Significantly Alters Substrate Topography
SEM images of collagen I scaffolds infected with various commensal E. coli strains were analyzed for substrate topography as described in the methods section. The surface topography of collagen I scaffold was disrupted by all commensal E. coli strains. However, maximum disruption of substrate topography was observed in scaffolds infected with HS4 bacterial strain (Figure 3(f)).
The SEM images were further analyzed by transforming these into 3D images as described in the methods section. Degradation of collagen I substrate was observed in all the cases including the uninfected control. This was expected since collagen I substrate is known to degrade over time independent of bacterial condition [18]. Scaffolds infected with commensal E. coli strains 259 and 260 (Figure 4(b) and (c)) showed negligible degradation and scaffolds infected with commensal bacterial strain 258 did not show any degradation (data not shown). Commenal E. coli strains 261 and 262 (Figure 4(d) and (e)) showed a higher rate of degradation than 259 and 260, although this was not significant. Infection with commensal E. coli strain HS4 significantly increased collagen degradation (Figure 4(f)). The amount of degradation was determined by the number of “peaks” and “valleys” formed on collagen substrates. As seen in Figure 4, maximum irregularities were found on substrates infected with commensal bacterial strain HS4.
3.3. Roughness Profile
Roughness profile was determined to further analyze and quantify the irregularities in collagen I substrate as mentioned in methods section. Overall roughness profile indicates that collagen I substrate infected with commensal E. coli strain HS4 showed maximum irregularity and surface roughness. The maximum height of profile (Rz) which is the difference between maximum peak height and valley depth (Rp-Rv), increased 3-fold when infected
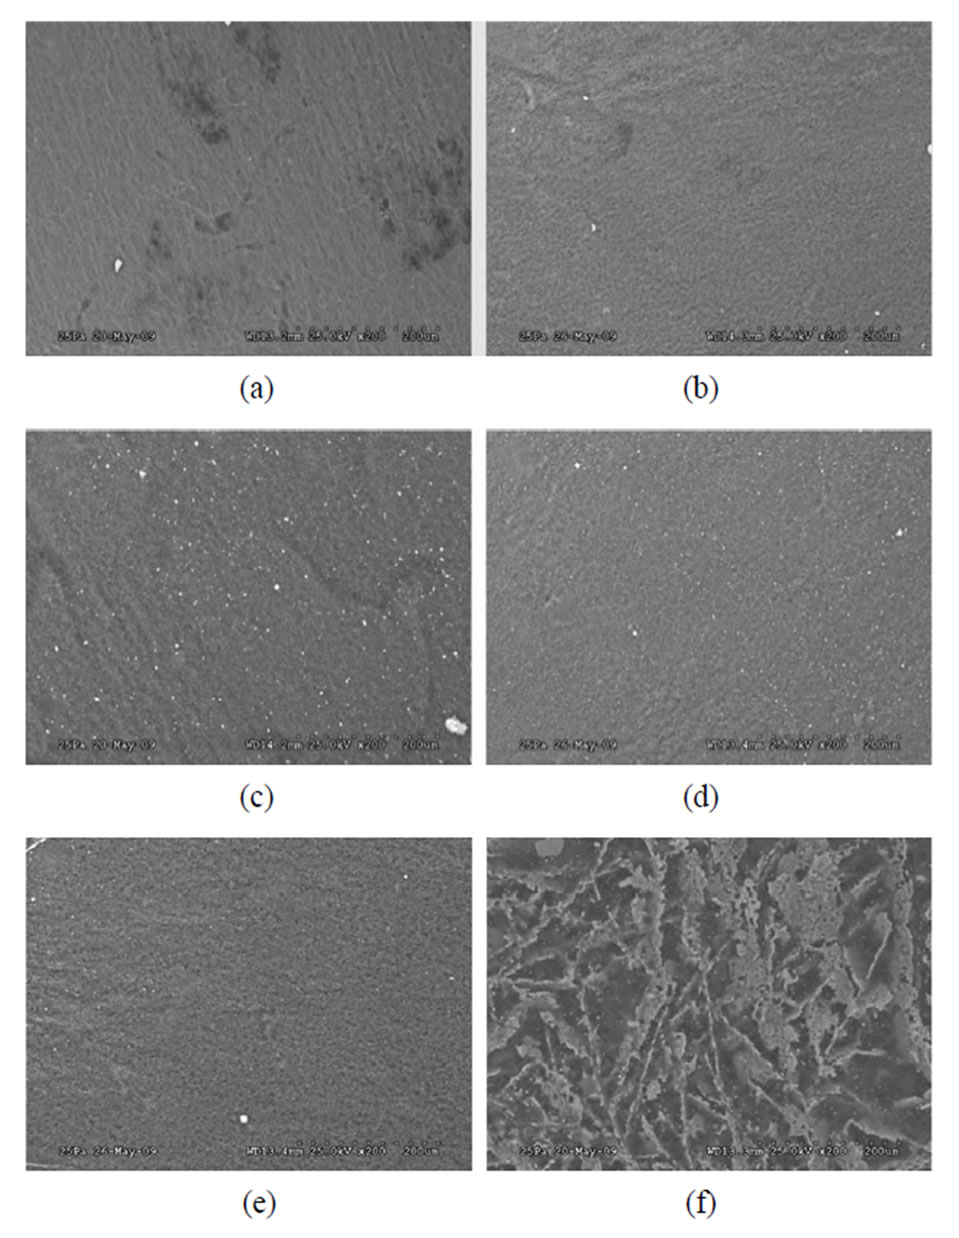
Figure 3. Control (a), 259(b), 260(c), 261(d), 262(e), and HS4 (f) were examined. All bacterial strains disrupted the collagen matrix. However, maximum roughness was seen in scaffolds infected with commensal bacterial strain HS4. Bar length is 200 mm.
with commenal E. coli strain HS4 (Figure 5). Infection with commensal E. coli strains did not significantly affect other parameters such as average roughness and RMS roughness.
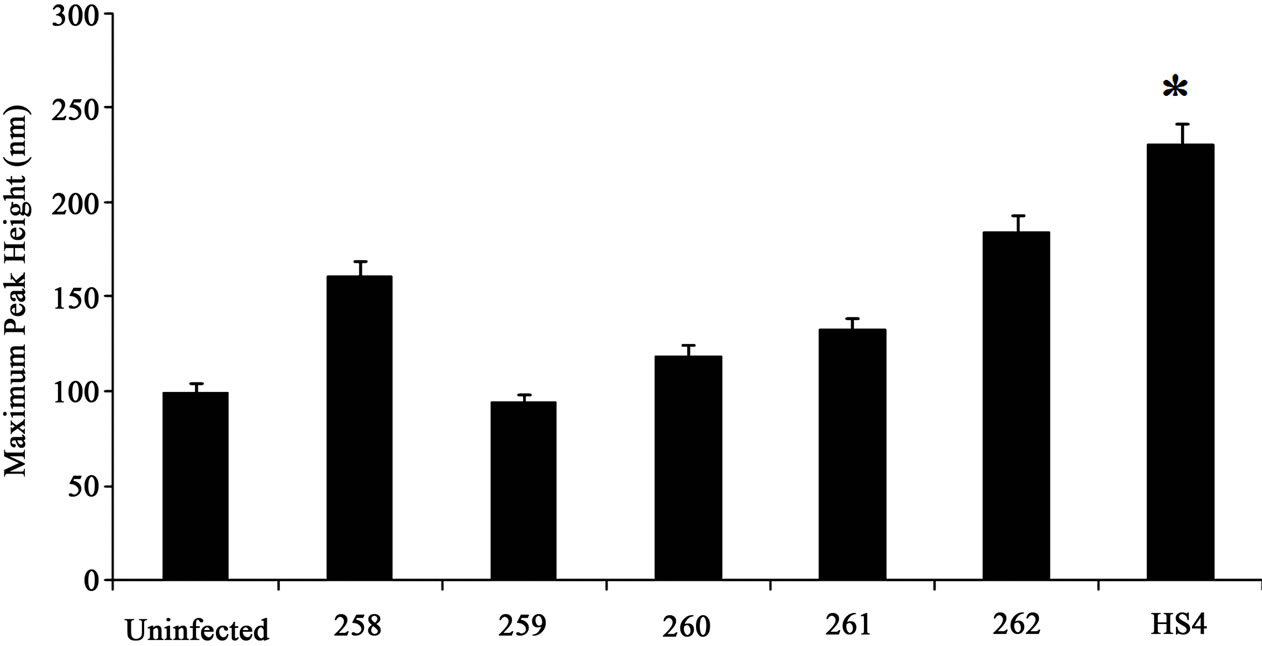
Both maximum peak (Rp) as well as valley depth increased (Rv) increased in substrates infected with commensal bacterial strain HS4, 262 and 258. A 2.5 fold increase was observed in both Rp and Rv when infected with HS4. A 1.5-fold increase in Rp and Rv was observed in substrates infected with bacterial strains 258
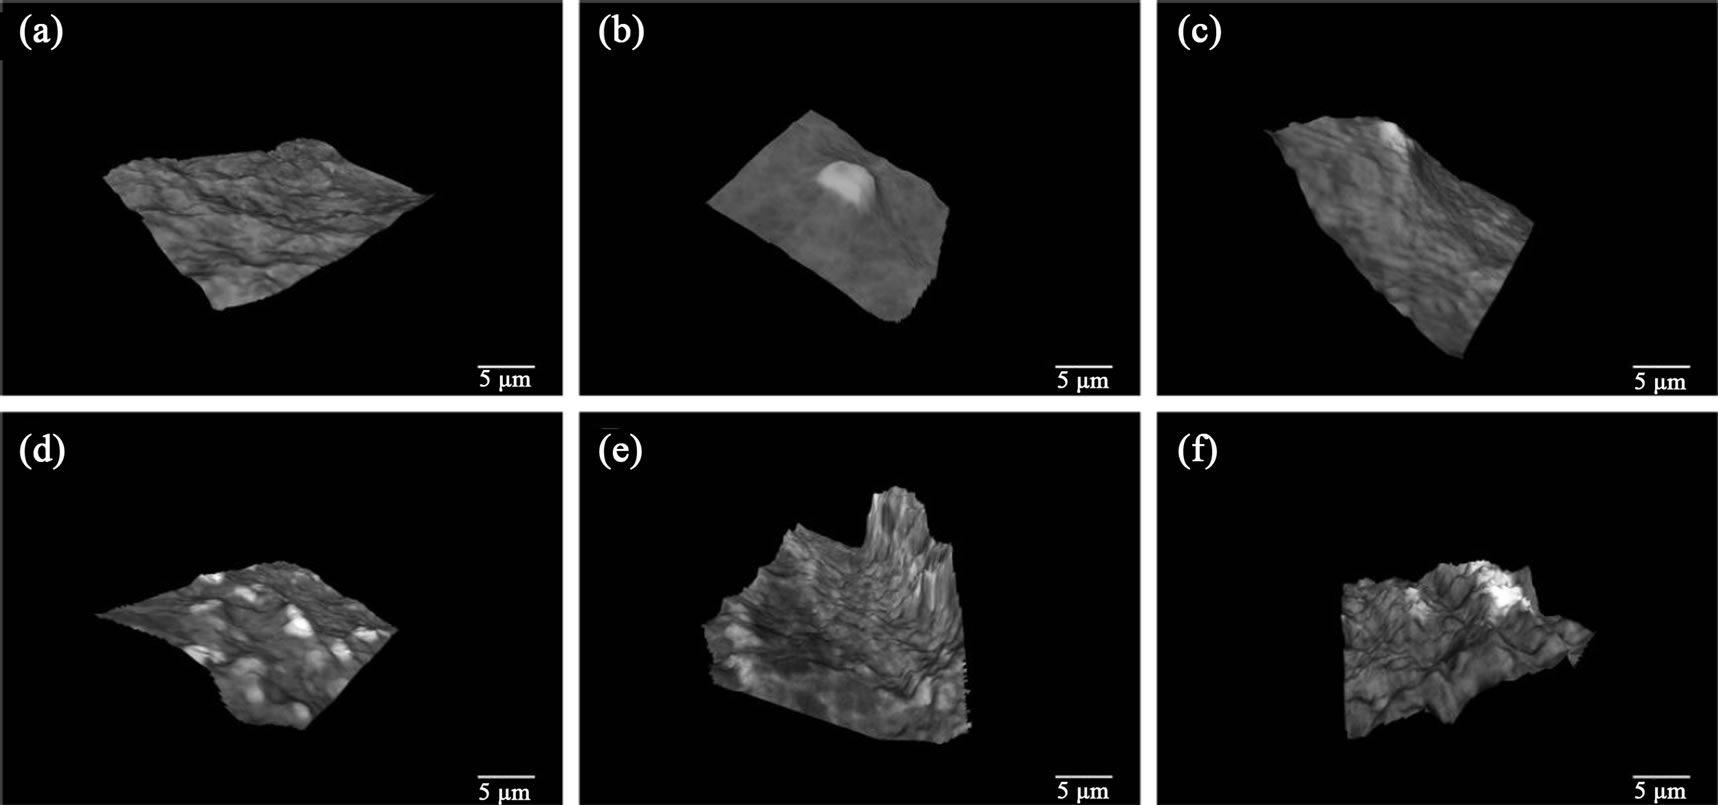
Figure 4. 3D Scaffold integrity stayed intact for the uninfected sample (a). It is clear that the uninfected samples along with strains 259 (b) and 260 (c) have negligible collagen degradation while strain 261 (d) and 262 (e) have minimal degradation. Strain 161 or HS4 (f) exhibits significant collagen degradation. Bar length is 5 mm.
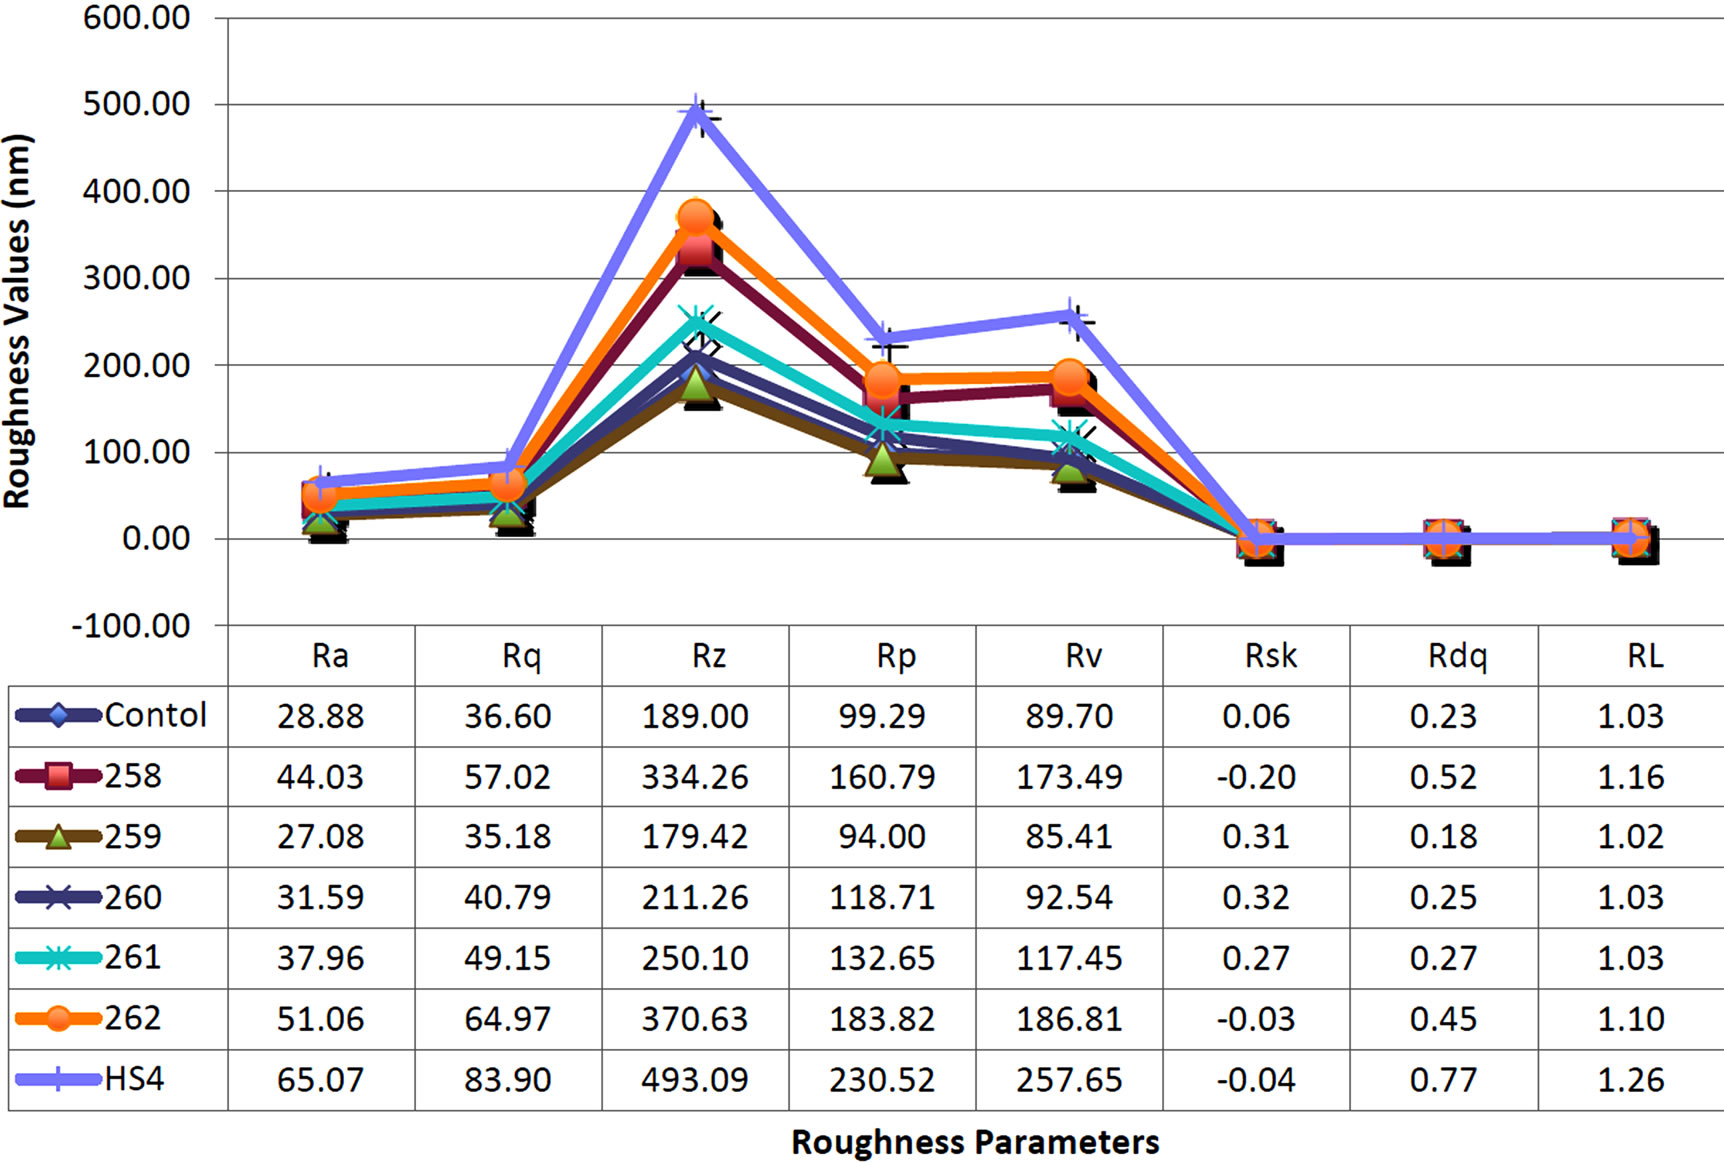
Figure 5. SW620 cells were seeded at densities of 50 × 103 and 250 × 103 cells/cm2 onto 1.5 mg/ml collagen I gels. Scaffolds were treated with Y-27632 to study the impact of ROCK-1 inhibition on cell proliferation in a low and high density environment. Treatment with Y-27632 resulted in a modest increase in cell proliferation for cells seeded at 50 × 103 cells/cm2 and no significant change for those seeded at 250 × 103 cells/cm2. Furthermore, increasing cell density increased cell proliferation 2.5-fold for the untreated condition and 1.5-fold for those treated with Y-27632.
and 262. Other commensal bacterial strains, 259, 260 and 261 respectively, did not affect the peak or the valley depth significantly (Figures 6(a) and (b)).
The mean spacing of irregularities was determined by
 (a)
(a)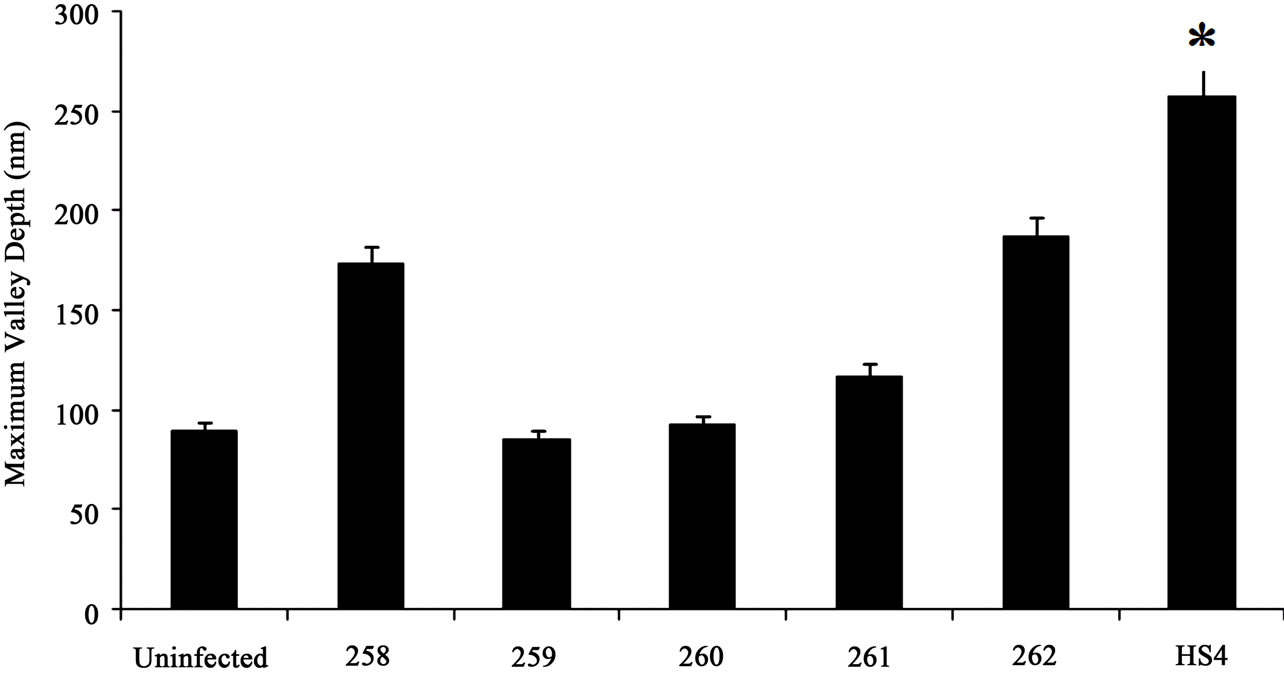 (b)
(b)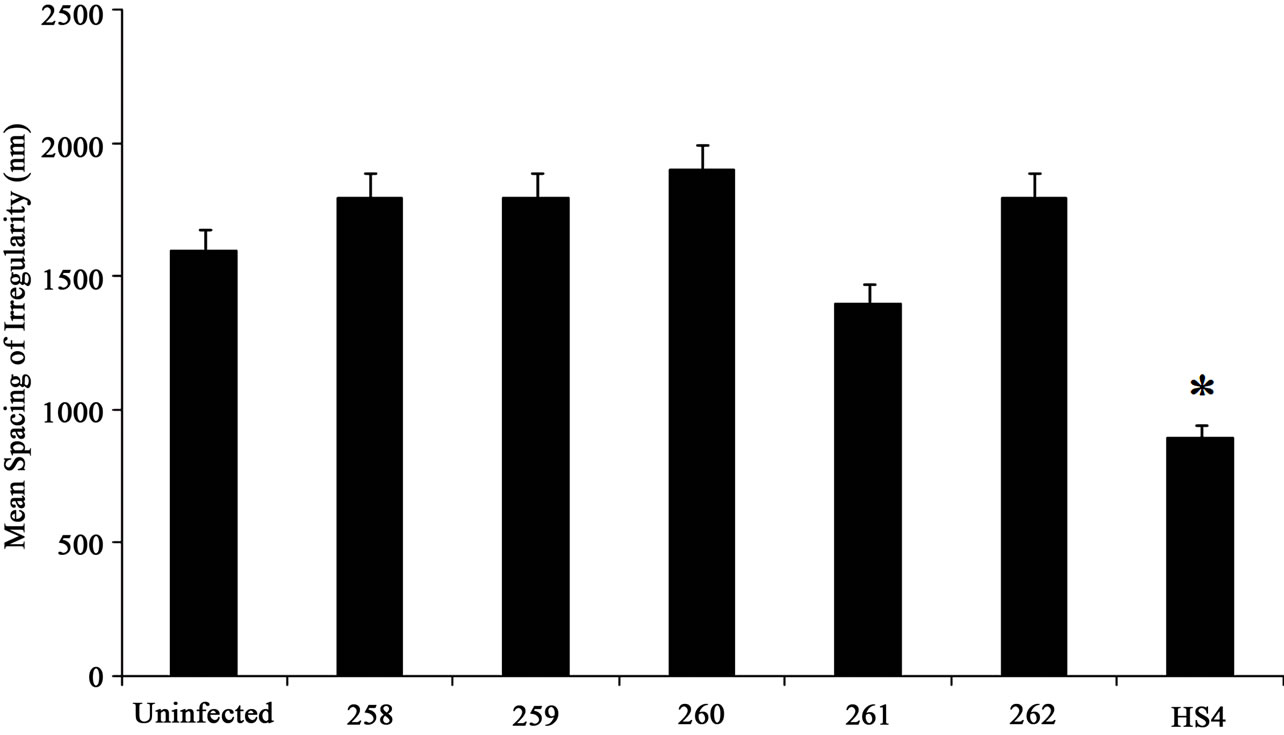 (c)
(c)
Figure 6. Quantitative analysis of roughness profile. (a) The maximum peak height was analyzed using MeX software. The peak height did not significantly change with different bacterial conditions; (b) The maximum valley depth was measure using MeX software and the SEM images. The maximum valley depth of approximately 260 nm was noted in samples infected with HS4 bacterial strain; (c) The mean spacing was in nano-meter scale. Collagen scaffold treated with HS4 showed irregularities at a much lower spacing of approximately 900 nm, indicating the increased “roughness” of the scaffold. Student t-test was performed and statistical significance is indicated by symbol (*).
measuring the distance between the peaks as described in methods section. The average spacing between the irregularities was significantly lower in substrates infected with commensal bacterial strain HS4. Both HS4 and 261 had lower mean spacing values, although a 2-fold decrease in spacing was observed in mean spacing in samples infected with HS4. Other commensal bacterial strains showed a slight increase in mean spacing. However, this increase was not significant (Figure 6(c)).
4. Discussion
It is clear from the results that certain strains of endogenous E.-coli degrade large amounts of collagen in a relatively short period of time. The scaffold micro-topograhy is clearly altered by the presence of these bacteria. Much has already been shown in literature about the role microtopographical features play in cell differentiation [19-21] and motility [22-24].
We have shown in this paper that each commensal bacterial strain affects the surface topography of collagen substrates differently, although all commensal bacterial strains tested in this paper disrupted the collagen surface topography. Our data indicate that commensal E. coli strain HS4 induces maximum collagenase activity and promotes substrate surface roughness, although, other commensal strains, especially 260, also play a role in decreasing the integrity of collagen substrate in vitro.
Collagen scaffolds were disrupted independent of bacterial condition. The uninfected sample also showed signs of degradation. This was expected since collagen fibers are known to degrade over time. However, samples infected with commensal E. coli strains 259, 260 and 261 did not show any extra degradation. The roughness profile, especially the maximum peak height and valley depth, were comparable to the uninfected case. However, in substrates infected with commensal bacterial strains 258, 262 and HS4 an increase in overall roughness profile height was observed. This shows that a few commensal bacterial strains, especially HS4, disrupt collagen matrix at a nano-scale. Nano-scaled protrusions within the matrix have been shown to cause cellular apoptosis, differentiation and motility of cancerous cells in in-vitro models [25-27]. Also, epithelial cell morphology and cytokine production has been shown to be dependent on the underlying nano-topographical features in vitro [28]. It is also shown in literature that in the event of inflammation, infection and malignant conditions of colon, the surrounding extra-cellular matrix is disrupted [29,30]. Thus, using probiotics in the event of Gastro-Intestinal (GI) disorders may have a negative impact. Although, probiotics have been known to have beneficial effect on the host organism by aiding in digestion and overall health of the colon [31], in the event of colon cancer or other GI disorders, these may, in fact, disrupt the collagen matrix further and worsen an already existing condition. Further studies, especially in-vivo models, are required to confirm the bacteria-host relationship and its effect on GI disorders.
In summary, our data suggests that the topographical features induced by bacterial infection are random, i.e., a definite pattern of nano-scaled peaks and valleys does not exist. Random remodeling of collagen substrate using bacteria may prove to be an essential technique in tissue engineering. Although other lithographic techniques exist to create nano-scaled features, bacterial degradation of collagen may provide us with a more natural and cost effective way of producing nano-scaled topographical substrates. Most tissue constructs are engineered to mimic in-vivo environment, which is mostly random, to govern cell fate. Since, in this paper we show that bacterial infections create nano-scaled random topographical features in an in-vitro model, this approach may be utilized to engineer implantable tissue constructs for several medical applications.
REFERENCES
- J. H. Cummings, “Dietary carbohydrates and the colonic microflora,” Current opinion in clinical nutrition and metabolic care, Vol. 1, No. 5, 1998, pp. 409-414. doi:10.1097/00075197-199809000-00007
- J. H. Cummings and G. T. Macfarlane, “The control and consequences of bacterial fermentation in the human colon,” The Journal of Applied Bacteriology, Vol. 70, No. 6, 1991, pp. 443-459. doi:10.1111/j.1365-2672.1991.tb02739.x
- N. M. de Roos and M. B. Katan, “Effects of probiotic bacteria on diarrhea, lipid metabolism, and carcinogenesis: a review of papers published between 1988 and 1998,” The American journal of Clinical Nutrition, Vol. 71, No. 2, 2000, pp. 405-411.
- J. Y. Lim and H. J. Donahue, “Cell sensing and response to microand nanostructured surfaces produced by chemical and topographic patterning,” Tissue Engineering, Vol. 13, No. 8, 2007, pp. 1879-1891. doi:10.1089/ten.2006.0154
- K. Anselme, “Osteoblast adhesion on biomaterials,” Biomaterials, Vol. 21, No. 7, 2000, pp. 667-681. doi:10.1016/S0142-9612(99)00242-2
- K. Anselme, P. Davidson, A. M. Popa, M. Giazzon, M. Liley and L. Ploux, “The interaction of cells and bacteria with surfaces structured at the nanometre scale,” Acta Biomaterialia, Vol. 6, No. 10, 2010, pp. 3824-3846. doi:10.1016/j.actbio.2010.04.001
- J. J. Mancuso, A. M. Larson, T. G. Wensel and P. Saggau, “Multiphoton adaptation of a commercial low-cost confocal microscope for live tissue imaging,” Journal of Biomedical Optics, Vol. 14, No. 3, 2009, p. 034048. doi:10.1117/1.3139850
- D. R. Eyre, M. A. Weis and J. J. Wu, “Advances in Collagen Cross-Link Analysis,” Methods, Vol. 45, No. 1, 2008, pp. 65-74. doi:10.1016/j.ymeth.2008.01.002
- C. S. Ranucci and P. V. Moghe, “Substrate microtopography can enhance cell adhesive and migratory responsiveness to matrix ligand density,” Journal of Biomedical Materials Research, Vol. 54, No. 2, 2001, pp. 149-161. doi:10.1002/1097-4636(200102)54:2<149::AID-JBM1>3.0.CO;2-O
- M. Lampin, C. Warocquier, C. Legris, M. Degrange and M. F. Sigot-Luizard, “Correlation between substratum roughness and wettability, cell adhesion, and cell migration,” Journal of Biomedical Materials Research, Vol. 36, No. 1, 1997, pp. 99-108. doi:10.1002/(SICI)1097-4636(199707)36:1<99::AID-JBM12>3.0.CO;2-E
- T. W. Chung, D. Z. Liu, S. Y. Wang and S. S. Wang, “Enhancement of the growth of human endothelial cells by surface roughness at nanometer scale,” Biomaterials, Vol. 24, No. 25, 2003, pp. 4655-4661. doi:10.1016/S0142-9612(03)00361-2
- Y. W. Fan, F. Z. Cui, S. P. Hou, Q. Y. Xu, L. N. Chen and I. S. Lee, “Culture of neural cells on silicon wafers with nano-scale surface topograph,” Journal of Neuroscience Methods, Vol. 120, No. 1, 2002, pp. 17-23. doi:10.1016/S0165-0270(02)00181-4
- A. Thapa, D. C. Miller, T. J. Webster and K. M. Haberstroh, “Nano-Structured Polymers Enhance Bladder Smooth Muscle Cell Function,” Biomaterials, Vol. 24, No. 17, 2003, pp. 2915-2926. doi:10.1016/S0142-9612(03)00123-6
- “ISO 4287 I: Geometrical Product Specifications (GPS) —Surface Texture: Profile method—Terms, definitions and surface texture parameters,” 1997.
- “ISO 4288 I: Geometrical Product Specifications (GPS) —Surface Texture: Profile method—Rules and procedures for the assessment of surface texture,” 1996.
- M. Krystek, “Die Digitale Implementierung des Profilfilters Nach DIN EN ISO 11562,” 2004.
- C. Instruments, “Spacial Filering of Surface Profile Data,” 2004.
- M. Chen, D. Q. Le, A. Baatrup, J. V. Nygaard, S. Hein, L. Bjerre, M. Kassem, X. Zou and C. Bunger, “Self-assembled composite matrix in a hierarchical 3-D scaffold for bone tissue engineering,” Acta Biomaterialia, Vol. 7, No. 5, 2011, pp. 2244-2255. doi:10.1016/j.actbio.2010.12.031
- G. Wang, X. Liu, H. Zreiqat and C. Ding, “Enhanced effects of nano-scale topography on the bioactivity and osteoblast behaviors of micron rough ZrO2 coatings,” Colloids and Surfaces B: Biointerfaces, Vol. 86, No. 2, 2011, pp. 267-274. doi:10.1016/j.colsurfb.2011.04.006
- H. Zhu, B. Cao, Z. Zhen, A. A. Laxmi, D. Li, S. Liu and C. Mao, “Controlled growth and differentiation of MSCs on grooved films assembled from monodisperse biological nanofibers with genetically tunable surface chemistries,” Biomaterials, Vol. 32, No. 21, 2011, pp. 4744- 4752. doi:10.1016/j.biomaterials.2011.03.030
- T. K. Teh, S. L. Toh and J. C. Goh, “Aligned Hybrid Silk Scaffold for Enhanced Differentiation of Mesenchymal Stem Cells into Ligament Fibroblasts,” Tissue Engineering Part C, Methods, Vol. 17, No. 6, 2011, pp. 517-526.
- V. J. Mukhatyar, M. Salmeron-Sanchez, S. Rudra, S. Mukhopadaya, T. H. Barker, A. J. Garcia and R. V. Bellamkonda, “Role of fibronectin in topographical guidance of neurite extension on electrospun fibers,” Biomaterials, Vol. 32, No. 16, 2011, pp. 3958-3968. doi:10.1016/j.biomaterials.2011.02.015
- N. Yang, R. Mosher, S. Seo, D. Beebe and A. Friedl, “Syndecan-1 in breast cancer stroma fibroblasts regulates extracellular matrix fiber organization and carcinoma cell motility,” The American journal of pathology, Vol. 178, No. 1, 2011, pp. 325-335. doi:10.1016/j.ajpath.2010.11.039
- M. J. Poellmann, P. A. Harrell, W. P. King, A. J. W. Johnson, “Geometric microenvironment directs cell morphology on topographically patterned hydrogel substrates,” Acta Biomaterialia, Vol. 6, No. 9, 2010, pp. 3514-3523. doi:10.1016/j.actbio.2010.03.041
- C. J. Bettinger, R. Langer and J. T. Borenstein, “Engineering substrate topography at the microand nanoscale to control cell function,” Angewandte Chemie, Vol. 48, No. 30, 2009, pp. 5406-5415. doi:10.1002/anie.200805179
- M. J .Biggs, R. G. Richards, N. Gadegaard, R. J. McMurray, S. Affrossman, C. D. Wilkinson, R. O. Oreffo and M. J. Dalby, “Interactions with nanoscale topography: adhesion quantification and signal transduction in cells of osteogenic and multipotent lineage,” Journal of Biomedical Materials Research Part A, Vol. 91, No. 1, 2009, pp. 195-208.
- K. Hotary, X. Y. Li, E. Allen, S. L. Stevens and S. J. Weiss, “A cancer cell metalloprotease triad regulates the basement membrane transmigration program,” Genes & Development, Vol. 20, No. 19, 2006, pp. 2673-2686. doi:10.1101/gad.1451806
- A. S. Andersson, F. Backhed, A. von Euler, A. RichterDahlfors, D. Sutherland and B. Kasemo, “Nanoscale features influence epithelial cell morphology and cytokine production,” Biomaterials, Vol. 24, No. 20, 2003, pp. 3427-3436. doi:10.1016/S0142-9612(03)00208-4
- I. Vlodavsky and Y. Friedmann, “Molecular properties and involvement of heparanase in cancer metastasis and angiogenesis,” The Journal of Clinical Investigation, Vol. 108, No. 3, 2001, pp. 341-347.
- E. H. Lo, X. Wang and M. L. Cuzner, “Extracellular proteolysis in brain injury and inflammation: role for plasminogen activators and matrix metalloproteinases,” Journal of Neuroscience Research, Vol. 69, No. 1, 2002, pp. 1-9. doi:10.1002/jnr.10270
- R. Fuller, “Probiotics in Human Medicine,” Gut, Vol. 32, 1991, pp. 439-442. doi:10.1136/gut.32.4.439