Agricultural Sciences
Vol.08 No.08(2017), Article ID:78737,20 pages
10.4236/as.2017.88062
Analysis of Impervious Surface Area, and the Impacts on Soil-Based Agriculture and the Hydrologic Cycle: A Case Study in the Agricultural Land Reserve in Metro Vancouver, British Columbia, Canada
Ashley Rose, Julie E. Wilson, Les M. Lavkulich
Master of Land and Water Systems, Faculty of Land and Food Systems, The University of British Columbia, Vancouver, Canada

Copyright © 2017 by authors and Scientific Research Publishing Inc.
This work is licensed under the Creative Commons Attribution International License (CC BY 4.0).
http://creativecommons.org/licenses/by/4.0/


Received: July 14, 2017; Accepted: August 25, 2017; Published: August 28, 2017
ABSTRACT
The province of British Columbia, Canada, has established an Agricultural Land Reserve (ALR) to protect the most suitable soil landscapes for agriculture. Increases in population and urbanization have resulted in development challenges on ALR lands. The Metro Vancouver area is the most productive agricultural area in British Columbia as well as the most rapidly growing urban region. The increase in impervious areas has decreased the amount of arable land for soil-based agriculture and altered the hydrological cycle. Analysis using a combination of aerial imagery and GIS found that impervious areas comprise about 10 percent of the ALR within Metro Vancouver. Farm residences and greenhouses have the largest effect on reducing the soil surface for water infiltration. This decrease in area has negatively influenced the ecosystem heath of the region, as well as, decreasing the amount of agricultural land for soil based agriculture and both surface and groundwater dynamics.
Keywords:
Agricultural Land Reserve, Impervious Surfaces, Watershed Health, Stormwater Runoff, Hydrology

1. Introduction
Prime agricultural land is commonly located adjacent to urban centers, as historic human settlement and urbanization was associated with local land and water resources that could provide requisites of food and shelter. Urbanization poses an ongoing threat to farmland; every year an estimated 65,000 km2 of cropland is lost worldwide to urban expansion for uses such as housing, industry and infrastructure [1] . Between 2001 and 2011 nearly one million hectares (ha) of dependable agricultural land was taken out of cultivation in Canada and subsumed, mostly by urban development [2] . In addition to the physical loss of agricultural land, large-scale agriculture has resulted in an increase in farm building infrastructure and impervious areas [3] . At a time when there is growing pressure for local food security, prime agricultural lands in the peri-urban environment are becoming “sealed” from food production by the impervious surfaces. Global estimations indicate 0.43% of the world’s land area is covered with impervious surfaces [4] .
Arable agricultural land is a scarce resource in Canada, as only 5% of it is suitable for crop production and free from limitations such as climate, topography, water availability and soil quality [5] . According to the 1972 Canada Land Inventory (CLI), which classifies soils based on their capability for agriculture from Class 1 to Class 7, arable agricultural land is defined as Class 1 - 3 [6] . Class1 has the highest capability agricultural soil with no significant limitations for a range of climatically suitable crops, while Class 7 is the lowest and non- arable [7] . In British Columbia (BC) soils are assessed for capability and limitations through the “Land Capability Classification for Agriculture in British Columbia” and Class 1 - 4 is considered suitable for a range of crops [8] .
In the late 1960s and early 1970s it was recognized that BC was losing an estimated 6000 ha of prime farmland to urban development and other uses each year [9] . In order to preserve this valuable farmland the provincial government introduced BC’s Agricultural Land Commission Act (the ALC Act) on April 18, 1973. The ALC Act identified 4.7 million ha or 5% of BC’s land base for agriculture based upon the CLI and placed these lands into an Agricultural Land Reserve (ALR) [9] . Of the province’s ~945,000 km2 land base, approximately 1.1% is considered prime agricultural land (CLI Class 1 - 3) and is primarily located in the Fraser River Valley near Metro Vancouver [10] .
Metro Vancouver’s ALR contains 1.5% of the agricultural land in BC and is some of the best agricultural land in Canada with its combination of soil, climate and available water [11] . However, there is increasing concern about covering fertile soils with impervious surfaces such as greenhouses, farm structures, poultry and dairy barns, and residential developments in a process also known as “soil sealing”. Permanently covering fertile soils with impervious surfaces diminishes the capacity of the region to produce food and feed the growing population, forecasted to grow by 30% from 2001 to 2025 [12] . Changes in impervious surface cover may also alter the hydrology, stream morphology, water and sediment quality, stream temperature and aquatic habitat, and biodiversity of the region [13] .
The purpose of this study is to investigate the extent of “soil sealing” on prime agricultural land located in Metro Vancouver’s ALR with impervious surfaces. The results are discussed in the context of two primary concerns: the loss of soil infiltration capacity and the loss of land available for food production. The permitted land uses in the ALR that contribute to imperviousness are discussed in relation to food production and farming opportunities and their impact on the hydrologic cycle. Recommendations to minimize the impact of impervious surfaces and to protect the long-term sustainability of soil-based agriculture are suggested.
1.1. Impervious Surfaces
Impervious area is a useful indicator of watershed conditions, as it relates to the health of aquatic ecosystems [13] . Increased impervious area has been linked with changes in stream biotic assemblages, including increases in algae biomass and decreases in benthic macroinvertebrate and fish abundance [14] [15] . Numerous studies have shown that stream quality starts to degrade when a watershed is more than 10% impervious [16] . For example, Stepenuck et al. [17] observed a threshold of 8 to 12 percent imperviousness across 43 southeastern Wisconsin streams, where stream quality is degraded and macroinvertebrate richness declines. In BC, Coho salmon are rarely found in watersheds exceeding 10% - 15% imperviousness, as their headwaters and spawning grounds become affected [13] . However damage thresholds may vary across different ecosystems and the ten-percent rule is a generalization [18] .
Impervious surfaces impact the quality and quantity of runoff discharged into receiving streams, often directly through sewer systems [19] . This disrupts habitat, water flow, food systems and biotic and chemical interactions [3] [13] . Stormwater carries with it pollutants that accumulate on hard surfaces, including pathogens, nutrients, pesticides, oil and grease, metals, and sediments that degrade water quality [14] [20] . This can lead to what is known as the “first flush phenomenon”, where pollutants that accumulate during dry periods, are transported after a major rainfall event into the drainage system, typically containing higher concentrations of toxins such as heavy metals, polychlorinated biphenyls (PCBs) and polycyclic aromatic hydrocarbons [20] [21] .
Impervious surfaces reduce the capacity of soils to store water and peak surface runoff rates increase with increasing precipitation [22] . This intensifies channel and bank erosion and increases vulnerability to flooding and sediment transport, which may decrease water clarity, benthic diversity, and spawning survival, as well as clogging the gills of fish [13] . Groundwater recharge and base flow is also reduced, as less precipitation infiltrates the soil and runs off hard surfaces [16] . Thus impervious surfaces indicate a disruption in the hydrological cycle and increased contamination through runoff.
Climate change projections for the Metro Vancouver region may exacerbate these effects, as they predict more frequent and extreme weather events [23] . The projections also suggest that peak stream flows will occur earlier in the spring, as more precipitation falls as rain and less as snow in the winter [23] . Flows would also decrease in the summer, as snowpack is reduced in the winter [23] . Increased impervious surface area compounds these effects, as stormwater drainage systems collect and convey runoff, giving it less of an opportunity to infiltrate into the soil and contribute to groundwater recharge and base flow of streams [22] .
1.1.1. Total versus Effective Impervious Area
Two categories are commonly used to quantify impervious cover: 1) Total Impervious Area (TIA) and 2) Effective Impervious Area (EIA). TIA is the measurement of all the impervious surfaces in a catchment area that do not allow water to infiltrate the soil including streets, sidewalks, driveways, and rooftops [14] . From a hydrological perspective TIA is limited because it ignores areas that may be vegetated but are too highly compacted to allow water to infiltrate [24] . Secondly, it includes paved areas that may not be directly connected to a waterbody via the storm drain network. For example, if runoff is diverted from a rooftop onto a green space such as a rain garden or a grassed swale then it is not contributing to the surface runoff of the residential area, and is helping to reduce peak runoff downstream. EIA measures the impervious surfaces that are directly connected to downstream drainage and is the portion of runoff that will impact both hydrology and water quality [24] [25] .
1.1.2. Watershed Health and Agricultural Land Use
A watershed is considered healthy when it can functionally support terrestrial, riparian, aquatic and wetland habitats and sustain diverse native populations of aquatic and riparian species. The Watershed Health Tracking System (WHTS) (2005) is a proposed means of measuring current and predicted watershed health in Metro Vancouver, wherein total impervious area (TIA) and riparian integrity are used as key indicators of watershed health [26] . TIA is ranked relative to stream health as follows: 1) stressed 1% - 10%, 2) impacted 11% - 25% and 3) degraded 26% - 100% [26] . Riparian integrity is measured using a 30- meter (m) setback or buffer zone on both sides of the watercourse over its entire length. If the 30 m riparian area is in pristine condition it is ranked 100% and if half of it is reduced to 15 m, the riparian integrity is closer to 25% [26] .
The WHTS does not factor in agricultural land use, which may compound the environmental impacts of impervious areas. For example, clearing of forested lands in the Metro Vancouver region for agriculture has increased peak flows from less than 5 to as much as 50% [27] . Agriculture also extracts large amounts of surface and groundwater, particularly in the hotter and drier months of July and August, which can account for 60% of irrigation water and result in minimum low flows [27] . Water quality may be impacted by nutrient inputs from fertilizers and manure, agricultural chemicals and increases in sediment loading from erosion. Wang et al. [19] measured watershed health using the fish community as an indicator and defined a threshold of 50% agricultural land use when agricultural watersheds move from “excellent” to “good” health [27] .
Integrating agricultural land use into the WHTS was not deemed to be scientifically defensible, based on the assertion that the effects of agriculture relative to urban land use on watershed health have not been adequately examined or studied [27] . This is in part because the term agriculture encompasses a wide range of activities, which have varying degrees of impact that make establishing an empirical relationship between the extent of agricultural land use and watershed health difficult [27] . It is also challenging to define the extent of stream networks in Metro Vancouver’s agricultural areas, as there is a large number of drainage ditches. Measuring the riparian areas adjacent to these ditches would also be somewhat unpractical, as it is a time consuming process [27] .
The objectives of this study are to estimate the extent of impervious surfaces within the Metro Vancouver ALR and to provide an analysis of the potential effects on the hydrological cycle and loss of land for soil-based agriculture. Residential developments and greenhouses will be discussed in depth due to the extent of arable agricultural soil they cover in the ALR study area. Two methods are used to calculate the extent of TIA: first is a preliminary assessment conducted in the absence of detailed land cover data using satellite imagery, and the second is using detailed land cover data from Agricultural Land Use Inventories (ALUIs) prepared by the BC Ministry of Agriculture [28] .
2. Methods
2.1. Study Area: Metro Vancouver Agricultural Land Reserve
Metro Vancouver is located in the southwest corner of British Columbia in the Fraser River watershed (49˚04'59.7"N, 122˚58'19.5"W). It covers a total area of 278,700 ha and is comprised of 22 municipalities, one electoral area, and one First Nation [28] . The Agricultural Land Reserve within Metro Vancouver is 60,890 ha or 22% of the land base [28] . The study area for this project includes six municipalities: Langley (Township), Surrey, Maple Ridge, Richmond, Delta and Pitt Meadows (Table 1), which support 94% of Metro Vancouver’s 2821 farms [29] . The study focused on 90% of the land in Metro Vancouver’s ALR (approximately 54,570 ha) [28] . Ten percent of the ALR was excluded from the study area due to sparse distribution and site limitations that prevented it from being surveyed in the Metro Vancouver ALUI.
2.1.1. Physiography
The study area is located within the Fraser River Lowland physiographic region (Figure 1). The Fraser Lowland was created 10,000 years ago from glacial and alluvial deposits along the Fraser River [30] . The Fraser River drains into the Strait of Georgia, separating the municipalities of Delta, Surrey, and Langley on the south side, Richmond in the middle, and Pitt Meadows and Maple Ridge on the north side. The south side of the Fraser Lowlands (including Richmond) is comprised of wide valley bottoms with gently rolling or flat-topped uplands and elevations typically lower than 15 m above sea level [27] . The north side has a

Table 1. Percentage and area of the agricultural land reserve in six municipalities.

Figure 1. Location of the Metro Vancouver agricultural land reserve study area.
similar topography but is up to 200 m elevation with upland surfaces ranging from flat-topped outwash or deltas to hummocky till and glaciomarine sediments [27] .
The parent material of the Fraser River Lowland ranges from deposits of alluvium near the mouth of the Fraser River to glacial till at higher elevations [27] . The ALR study area is largely composed of fine silts and clay, which have resulted in soils characterized by impeded drainage, but high agricultural productivity [31] .
2.1.2. Climate
Metro Vancouver has a modified maritime climate, characterized by wet, cool winters (October to March) and a pronounced dry period in the summer (July to August). The temperature rarely drops below zero degrees Celsius and the region has one of the longest frost-free periods in Canada [27] .
The average rainfall varies and is divided into three distinct hydrological zones that increase in precipitation from the south to north towards the Cascade Mountains [32] :
1) Low rainfall zone (<1350 mm annual): Lowlands of Richmond, Delta and south Surrey;
2) Medium rainfall zone (1350 mm to 1850 mm annual): Township of Langley and north Surrey; and
3) High rainfall zone (>1850 mm annual): Maple Ridge and Pitt Meadows.
2.2. Analysis
2.2.1. Imagery Analysis of Impervious Surfaces
An initial assessment of impervious surface area was conducted in the study area using Google Earth Pro [33] , as a means of estimating Total Impervious Area (%) in the absence of detailed land cover data. The boundaries of the ALR were derived from Keyhole Markup Language (KML) files from the Provincial Agriculture Land Commission [34] .
Four 65 ha plots were analyzed in each municipality in the study area. To choose the plots, four place marks were randomly pinned within the ALR boundary at each location in Google Earth at a 1:20,000 scale. The boundaries of the plots were digitized following the gridlines of the agricultural fields visible through satellite imagery [33] . The land covers identified as impervious were digitized into Google Earth polygons for each plot including:
・ Built objects such as residential, commercial, industrial, recreational and institutional structures;
・ Human created bare sites such as aggregate extraction sites, compacted soil or gravel parking lots and storage areas; and
・ Paved areas including roads, driveways and parking lots.
Earth Point [35] was used to calculate the area of the impervious land cover in hectares for each plot. The impervious land covers for each individual plot were summed to determine the percentage of the plot that is impervious, or the TIA.
2.2.2. Analysis of Agricultural Land Use Inventory Data
1) Land Cover
To determine the relationship between impervious surfaces and watershed health, watershed boundaries are usually delineated based on topography and the storm sewer drainage system [24] . However, due to the complex nature of the agricultural drainage systems including pumping and retention systems in Metro Vancouver’s ALR, specific watersheds were not delineated in this study. Imperviousness was calculated as a percentage of land cover within the ALR boundaries of the study area.
A detailed analysis of land cover data from the Agriculture Land Use Inventories (ALUIs) prepared by the BC Ministry of Agriculture was conducted to provide a more accurate assessment of TIA in the Metro Vancouver ALR study area, as compared to the imagery analysis. Data were collected for the ALUIs with AgFocusin the summer of 2010 and 2011, which employs a “windshield” survey method and Geographic Information Systems (GIS) to identify land use and land cover on legal parcels [28] .
2) Imperviousness Factors
Land cover types identified as impervious were assigned an imperviousness factors (IF) (Table 2), derived from the Sensitive Habitat Inventory Mapping
Table 2. Impervious factors derived from the BC Sensitive Habitat Inventory Mapping Manual.
(SHIM) manual, a standard for fish and aquatic mapping for watersheds in BC [24] . Total Impervious Area was calculated by multiplying the percentage of land cover in the ALR in each category by the corresponding impervious factor using a spreadsheet.
The IF for residential footprint in the study area was established independently, as imperviousness can vary depending on housing type and density, design of road networks, and structures on the parcel such as recreational and storage facilities [24] . The IF for residential footprint was determined by developing test sites in three randomly chosen locations in the study area: Richmond, Delta and Pitt Meadows. Ten residential footprints in each of the three locations were mapped in detail using Google Earth Pro satellite imagery. The residential footprint, according to the BC Ministry of Agriculture definition, includes: the main residence, yard, driveway, parking, and any auxiliary buildings or structures. The IF was calculated by dividing the TIA by the total residential footprint to get an overall average for the test areas of 29%, which was extrapolated across the entire study area.
2.2.3. GIS Analysis
This study used ArcGIS 10 [36] to calculate the extent of impervious surface area covering Class 1 to Class 4 lands in the ALR. Data sources included:
・ Spatial land cover polygons and tabular land cover survey data from the Metro Vancouver (ALUI) [28] ;
・ 1:125,000 maps of the Soil Capability for Agriculture classification (Canada Land Inventory) [6] ;
・ Boundaries for the ALR based on shape files from the Provincial Agricultural Land Commission [34] .
The following land cover types were identified as impervious: crop barn, farm infrastructure, greenhouse, non-built or bare, residential footprint, settlement (structures and their associated yards, roads and parking), transportation, and utilities. The extent of impervious surface area for each land cover was calculated for each land capability class including: Classes 1 - 4 representing arable agricultural land; Classes 5 & 6 indicating severe limitations only suitable for few crop types or requires special conservation practices; Class 7, with no capacity for arable culture; and Class 0, organic soil, which is not included in capability classes [7] .
ArcGIS 10 [36] was used to map the land cover types in the Metro Vancouver ALR, to present the varying levels of imperviousness according to the corresponding IFs.
3. Results
3.1. Imagery Analysis
The initial imagery analysis estimated an average total impervious area of 9.7% in Metro Vancouver’s ALR (Table 3). The municipality of Delta had the highest
Table 3. Averaged total impervious area (%) estimated for six municipalities in the Agricultural Land Reserve using Google earth (2016) imagery analysis.
TIA, followed by Pitt Meadows. Two of the plots surveyed in Delta had large greenhouses, which covered approximately 20% and 54% of the area (Figure 2). Three out of the four plots in Pitt Meadows also contained large greenhouses. The remaining plots included a variety of land covers, with no single activity covering the majority of the area. Depending on the random selection of the plots, different land covers where captured, while others were not included in this approximation. The average TIA could appear extremely high or low if, for example, the plot included a greenhouse versus a cultivated field.
3.2. Agricultural Land Use Inventory Analysis
Detailed spatial assessment of land cover data in Metro Vancouver ALUIs showed that approximately 6420 hectares, or 11% of the ALR contains a range of impervious farming, residential, commercial and industrial structures, and extraction or disposal sites that are partially impervious (Table 4). The highest percentage of impervious land cover types are residential footprint (1650 ha) and farm infrastructure (1580 ha), collectively making up 6% of the ALR study area.
The calculation for TIA included all land cover types from the Metro Vancouver ALUIs. The average TIA in the study area was calculated to be 7.2% (Figure 3). The highest TIA was again found in Delta at 8.1%, followed by Surrey at 7.6%. The TIA results are lower than those of the imagery analysis in 3.1, and are a more accurate representation, as they account for all of the impervious land covers in the ALR.
Farm infrastructure (2.4%) and transportation (0.9%) land cover types contributed the most to the overall percentage of TIA, but are considered necessary for the development of soil-based agriculture. Residential footprint (0.9%) and greenhouses (0.6%) were the next largest contributors to TIA in the ALR, and impede soil-based production.
3.3. GIS Analysis of Soil Capability for Agriculture
Approximately 5260 ha of Class 2 - 4 lands, considered prime agricultural soils are covered by impervious surfaces in the study area. Transportation and residential footprints cover the largest area of prime soils (1686 ha and 961 ha,
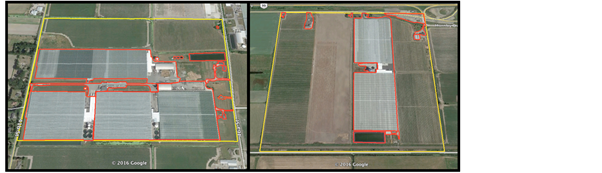
Figure 2. Impervious surface area in Delta, BC Agricultural Land Reserve study area (Google Earth Pro, 2014).

Figure 3. Average total impervious area (%) in the Metro Vancouver Agricultural Land Reserve study area, derived from GIS-based Agricultural Land Use Inventories from 2010 & 2011 (Ministry of Agriculture, 2014).
respectively) (Table 5). The majority of impervious surfaces are on Class 4 soil (3394 ha), representing 50% of the ALR in the study area (Figure 4). Organic soils have the second largest impervious area (1669 ha), however these are not rated for agricultural capability in the Canada Land Inventory (1972). There are no Class 1 soils in the study area for analysis. These reported values are smaller than reported in the ALUIs for Metro Vancouver, as not all the soil was surveyed in areas potentially covered by a range of land covers such as settlements, transportation and utilities.
4. Discussion
Approximately 11% of the ALR study area was determined to be impervious land covers to some degree. However, after applying the impervious factors, the
Table 4. Total impervious area in the Metro Vancouver ALR study area derived from 2010 & 2011 (Ministry of Agriculture, 2014).
Table 5. Areas of impervious land covers on soil Classes 2 to 7 in the Metro Vancouver Agricultural Land Reserve study area (No Class 1 soil in the study area).
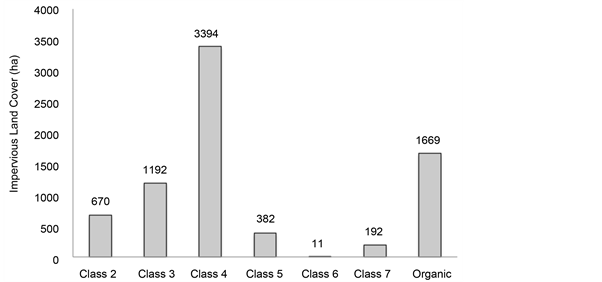
Figure 4. Total impervious land cover (ha) per land capability class in the Metro Vancouver Agricultural Land Reserve study area (No Class 1 soils in the study area).
Metro Vancouver ALR study area was determined to have a total impervious area of 7.2% (Figure 3). This may provide an assessment of the amount of precipitation that is no longer intercepted by vegetation or infiltrated into the soil and contributes to runoff. In forested catchments, runoff is reported to double with increases of 10% - 20% impervious surface cover (ISC), triple at 35% - 55%, and increase more than five times at 75% - 100% (ISC) [37] . As the study area is 7.2% impervious, the volume of runoff generated from impervious surfaces would also almost double. This is substantial as Metro Vancouver annually receives <1350 mm in low rainfall zones and >1850 mm in high rainfall zones [32] .
In the Metro Vancouver ALR, drainage is one of the limiting factors for crop production, as the soils are composed of fine silts and clay, characterized by low infiltration rates [38] . To manage high water tables, agricultural producers install surface and subsurface drainage and construct ditches [38] . Excess runoff from impervious surfaces largely drains into these ditches, which are often connected to natural and channelized streams that drain into larger rivers and the ocean [38] . Increased impervious surface area reduces the capacity of soils to store water, and as the soil becomes saturated peak surface runoff rates increase [22] . Runoff from agricultural fields may carry with it several non-point sources of pollution including pesticides, sediments, fertilizers and manure, which degrades water quality and aquatic health [3] .
Future climate change scenarios project increases in total precipitation and more frequent and extreme weather events in Metro Vancouver, which will further magnify drainage and flooding issues in the ALR [39] . Projections suggest that peak flows will occur earlier in the spring, as more precipitation falls as rain in the winter. They also indicate that flows will decrease in the summer, as snowpack is reduced in the winter. This would result in reduced groundwater recharge rates and base flow at times of low flow in the late summer [23] . In dry years, base flow helps to sustain stream flow and many streams would not exist without it [22] . Increased impervious surface area would exacerbate these effects, as drainage systems spatially concentrate distributed runoff and diminish opportunities for precipitation to infiltrate into the ground [22] . This compounds the impacts of impervious surfaces and reduces the amount of precipitation that contributes to groundwater recharge and replenishes the base flow of streams.
The TIA values for the Metro Vancouver ALR study area are below the 10% imperviousness threshold, where it is generally accepted that aquatic health becomes degraded, as a guideline for urban watersheds [18] . Applying this threshold to the ALR does not provide a complete picture from a watershed perspective. The boundaries of the ALR are not compatible with watershed boundaries, as they were established based on agricultural capability and suitability, and not on the basis of topography and how water drains from ridges into rivers or creeks at lower elevations [8] . Moreover, the majority of watersheds in Metro Vancouver are associated with urban land uses, which often have impervious factors ranging from 80% to 90% [24] .
The ALR contains a variety of different land covers such as cultivated field crops, natural and semi-natural vegetation, residential developments, utilities and transportation. There are several sites in the ALR study area that are largely impervious, with land covers that range from 25% to 100% impervious (Figure 5). Concentrated areas of ISC that receive high amounts of rainfall can become hot spots for the transportation of agricultural non-point sources (NPS) of pollution, especially when located next to water bodies. In agricultural areas water quality has been shown to decline when agricultural land use exceeds 50% of the watershed area [27] . Considering the ALR study area is 50% farmed, the IBI scores would be expected to show a decline in water quality regardless of the TIA. Metro Vancouver has already experienced issues associated with the management of nutrients including: nitrate contamination of groundwater, eutrophication, pathogens and ammonia in surface water and excessive amounts of potassium in the soil [39] . The Serpentine and Nicomekl Rivers for example, which flow through the Surrey ALR into the Strait of Georgia are at risk of contamination from both urban and agricultural land uses and often fail to meet fecal contamination, turbidity and dissolved oxygen objectives [40] . Increasing impervious surface area in the ALR will only exacerbate potential water quality issues associated with agricultural NPS pollution, and push thresholds towards ecosystem degradation.
4.1. Soil Sealing
There is an estimated 60,940 hectares of land in the Metro Vancouver ALR, 80% of which is considered prime soil for agriculture (Class 2 - 4) [11] . In the study area, approximately 5256 ha or 10% of Class 2 - 4 soils (Figure 4) are covered by impervious surfaces associated with agricultural, residential, commercial and

Figure 5. Impervious factors of land cover types in six municipalities in the Metro Vancouver Agricultural Land Reserve study area.
industrial development. These soils are now permanently sealed and lost to soil-based agriculture.
While farm infrastructure and transportation comprise a large TIA, these are considered essential for agricultural enterprise. Residential development and greenhouses are another significant area of TIA and are arguably less essential and of concern from the perspective of soil-based agriculture. Therefore, these are the focus of further discussion.
4.1.1. Residential Footprint
One of the concerns in the ALR with regards to residential footprint (RF) is the increased number of estate-sized homes (>465 m2 or 5000 ft2) encroaching into farmland. Test areas determined that residential imperviousness was 29%. This exceeds estimates for rural residential land uses, which range from 8% - 12% impervious [13] [24] . Test-plots in this study included estates with tennis courts, swimming pools, auxiliary buildings and long driveways, not typically expected in rural agricultural areas.
Residential footprint covers approximately 1650 hectares of land, or 3% of the Metro Vancouver ALR study area, of which 58% (960 ha) is on Class 2 - 4 soils. While residential housing is a necessary accessory to agriculture, it can also hinder the viability of agriculture. This occurs when the primary motivation for purchasing farmland is for residential use and not for agriculture [28] . Currently, only 4780 or 41% of the parcels in the Metro Vancouver ALR are used for farming [28] . When residences are built without the purpose of farming there is often little consideration for agriculture, and homes are built to both maximize views and privacy and are setback from the road [41] . This can increasingly fragment the land, compromising future agricultural use [41] .
4.1.2. Greenhouses
Imagery analysis of impervious surfaces in Metro Vancouver’s ALR found an average TIA of 9.7% (Table 2). Delta had the highest TIA at 20%, as it was sampled to have a higher occurrence of greenhouses. Two of the plots (160 acres each) in Delta had greenhouses on them, including one that was 53.6% impervious. Pitt Meadows had the second highest TIA (10.3%), which was also largely attributed to greenhouses. This preliminary analysis shows how drastically areas with concentrated greenhouses can increase imperviousness in localized agricultural areas.
Glass greenhouses occupy 441 ha (not including poly or unmaintained green- houses) of land or less than 1% of Metro Vancouver’s ALR [28] . This represents a large portion of the greenhouses in BC, as 90% of the greenhouses in BC are located in the Lower Mainland [42] . The highest concentration is in Delta, which accounts for 52% of the production in the province [42] . Greenhouses in Delta cover approximately 2% of the ALR (162 ha) and are the most impervious land cover type.
The GIS analysis showed that approximately 240 ha or 70% of all greenhouses in the study area are on Class 2 - 4 soil (Table 5). In areas such as Delta this can account for a large portion of land, as almost all the soils when drained are highly productive and climatically suited for the crops in the area [42] . Covering these soils with greenhouses arguably defeats the purpose of protecting productive agricultural soil in the ALR for food production.
5. Conclusions
Large areas of fertile soil are lost each year to impervious surfaces, as agricultural land is converted to urban, commercial and industrial uses, decreasing the viability of soil based-agriculture. Impervious surfaces also disrupt the hydrologic cycle, reducing the infiltration of water into the ground and accelerating runoff and the transport of contaminants into waterways. The Agricultural Land Reserve in British Columbia was originally created to protect arable soil from being lost to urban and other development. However, there is a wide array of permitted activities in the ALR that “seal” the soil with impervious surfaces, such as the construction of greenhouses, crop and dairy barns, estate-sized houses, roads, and commercial facilities.
After applying impervious factors to account for variances in permeability the total impervious area of the Metro Vancouver ALR is approximately 7.2%, which is below the 10% threshold that correlates with changes in ecosystem health. However, this calculation was based on ALR boundaries, not watershed boundaries, so they are not comparable. If watersheds were to be considered, they would contain a higher TIA value by incorporating neighboring urban developments. Moreover, the impacts of agricultural land use in terms of water quality and quantity would be expected to compound the effects of TIA on watershed health. Runoff generated from impervious surfaces in the ALR largely drains into ditches that are often connected to fish bearing streams or waterways that eventually drain into the ocean.
Approximately 5260 hectares or 10% of the arable agricultural soil (Class 1 - 4) has been covered with impervious surfaces in the Metro Vancouver ALR, with the highest percentage of that being for transportation (1690 ha) and residential development (960 ha). Residential development and greenhouses are considered to be of the most concern, as they inhibit the viability of soil-based agriculture. Approximately 70% of greenhouses (240 ha) and 58% of residential developments are on Class 2 - 4 soil in the ALR, permanently eliminating soil-based production on these prime lands.
The fertile soils found in the ALR are part of the region’s natural capital, providing nutrients and water for food to grow, and regulating floods and droughts and the movement of contaminants into waterways. Long-term action and planning is suggested between governments, communities, landowners, the Agricultural Land Commission, developers, environmental stewardship and other stake- holder groups for the protection of arable agricultural land from being covered with impervious surfaces and to achieve the goal of the long-term sustainability and viability of British Columbia’s agricultural land base. This could include limiting the construction of impervious structures to areas that are less productive (Class 5 - 7 soil), and restricting the size of residential footprints and regulating the siting of residential uses. Specific targets to limit total impervious area in watersheds to less than 10% would further help protect stream health and conserve valuable soil resources.
Acknowledgements
The authors would like to thank the British Columbia Ministry of Agriculture for providing the land cover data results from the summer 2010-2011 Agriculture Land Use Inventory and Agricultural Water Demand Projects in BC. We would also like to thank HaojingXie for her assistance in producing the GIS maps.
Cite this paper
Rose, A., Wilson, J.E. and Lavkulich, L.M. (2017) Analysis of Impervious Surface Area, and the Impacts on Soil-Based Agriculture and the Hydrologic Cycle: A Case Study in the Agricultural Land Reserve in Metro Vancouver, British Columbia, Canada. Agricultural Sciences, 8, 837-856. https://doi.org/10.4236/as.2017.88062
References
- 1. DÖÖs, B.R. (2002) Population Growth and Loss of Arable Land. Global Environmental Change, 12, 303-311.
- 2. Lin, J. (2014) Human Activity and the Environment: Agriculture in Canada. Catalogue No. 16-201-X, Statistics Canada. http://www.statcan.gc.ca/pub/16-201-x/16-201-x2014000-eng.pdf
- 3. Allan, J.D. (2004) Landscapes and Riverscapes: The Influence of Land Use on Stream Ecosystems. Annual Review of Ecology, Evolution, and Systematics, 35, 257-284. https://doi.org/10.1146/annurev.ecolsys.35.120202.110122
- 4. European Commission (2012) In-Depth Report: Soil Sealing. Science for Environmental Policy. http://ec.europa.eu/environment/archives/soil/pdf/sealing/Soil%20Sealing%20In-depth%20Report%20March%20version_final.pdf
- 5. Hofmann, N., Filoso, G. and Schofield, M. (2005) The Loss of Dependable Agricultural Land in Canada. Rural and Small Town Canada Analysis Bulletin, 6, Catalogue No. 21-006-XIE. http://publications.gc.ca/collections/Collection/Statcan/21-006-X/21-006-XIE2005001.pdf
- 6. Canada Land Inventory (1972) Soil Capability Classification. Department of the Environment, Ottawa.
- 7. Agriculture and Agri-Food Canada (2013) Overview of Classification Methodology for Determining Land Capability for Agriculture. http://sis.agr.gc.ca/cansis/nsdb/cli/classdesc.html
- 8. Agricultural Land Commission (ALC) (2013) Agricultural Capability Classification in BC. Province of British Columbia. http://www.alc.gov.bc.ca/assets/alc/assets/library/agricultural-capability/agriculture_capability_classification_in_bc_2013.pdf
- 9. Agricultural Land Commission (ALC) (2014a) Agricultural Land Reserve History. Province of British Columbia. http://www.alc.gov.bc.ca/alc/content/alr-maps/alr-history
- 10. Smith, B.E. (2012) A Work in Progress: The British Columbia Farmland Preservation Program. BC Government and Agricultural Land Commission eBook Collection. http://www.alc.gov.bc.ca/assets/alc/assets/library/archived-publications/alr-history/a_work_in_progress_-_farmland_preservation_b_smith_2012.pdf
- 11. Metro Vancouver (2011) Metro Vancouver’s Regional Food System Strategy. Sustainable Region Initiative, Metro Vancouver, Feb. 2011. https://www.metrovancouver.org/services/regional-planning/PlanningPublications/RegionalFoodSystemStrategy.pdf
- 12. BC Ministry of Agriculture and Lands (BCMARR) (2006) B.C.’s Food Self-Reliance. Province of British Columbia, 820105-1. http://www.plancanada.com/BCfood.pdf
- 13. Guthrie, R. and Deniseger, J. (2001) Impervious Surfaces in French Creek. BC Ministry of Water, Land and Air Protection, Victoria. http://www.env.gov.bc.ca/van-island/es/pdf/Impervious%20Surfaces%20technical%20document.pdf
- 14. US Environmental Protection Agency (2016) CADDIS Volume 2: Sources, Stressors and Responses. https://www3.epa.gov/caddis/ssr_urb_is3.html
- 15. Walsh, C., Roy, A., Feminella, J., Cottingham, P., Groffman, P. and Morgan, R. (2005) The Urban Stream Syndrome: Current Knowledge and the Search for a Cure. The North American Benthological Society, 24, 706-723.
- 16. Chithra, S.V., Nair, M.V.H., Amarnath, A. and Anjana, N.S. (2015) Impact of Impervious Surfaces on the Environment. International Journal of Engineering Science Invention, 4, 27-31.
- 17. Stepenuck, K.F., Crunkilton, R.L. and Wang, L. (2002) Impacts of Urban Land Use on Macroinvertebrate Communities in Southeastern Wisconsin Streams. Journal of the American Water Resources Association, 38, 1041-1051. https://doi.org/10.1111/j.1752-1688.2002.tb05544.x
- 18. Beach, D. (2002) Coastal Sprawl the Effects of Urban Design on Aquatic Ecosystems in the United States. South Carolina Coastal Conservation League: Pew Oceans Commission. http://www.pewtrusts.org/en/research-and-analysis/reports/2002/04/08/coastal-sprawl-the-effects-of-urban-design-on-aquatic-ecosystems-in-the-united-states
- 19. Wang, L., Lyons, J. and Kanehl, P. (2001) Impacts of Urbanization on Stream Habitat and Fish across Multiple Spatial Scales. Environmental Management, 28, 255-266.
- 20. Jartun, M., Ottesen, R.T., Steinnes, E. and Volden, T. (2008) Runoff of Particle Bound Pollutants from Urban Impervious Surfaces Studied by Analysis of Sediments from Stormwater Traps. Science of the Total Environment, 396, 147-163.
- 21. Soller, J., Stephenson, J., Olivieri, K., Downing, J. and Olivieri, A.W. (2005) Evaluation of Seasonal Scale First Flush Pollutant Loading and Implications for Urban Runoff Management. Journal of Environmental Management, 76, 309-318.
- 22. Shuster, W., Bonta, J., Thurston, H., Warnemuende, E. and Smith, D. (2005) Impacts of Impervious Surface on Watershed Hydrology: A Review. Urban Water Journal, 2, 263-275. https://doi.org/10.1080/15730620500386529
- 23. Crawford, E. and MacNair, E. (2012) BC Agriculture Climate Change Adaptation Risk + Opportunity Assessment: Provincial Report. BC Agriculture and Food Climate Action Initiative. http://pics.uvic.ca/sites/default/files/uploads/BC%20Agriculture_full%20report.pdf
- 24. Mason, B. and Knight, R. (2001) Sensitive Habitat Inventory and Mapping. Community Mapping Network, Vancouver, 315 p. http://cmnmaps.ca/cmn/files/methods/shim_manual/shim_10jun02.pdf
- 25. Beyerlein, D. (1996) Effective Impervious Area: The Real Enemy. Proceedings of the Impervious Surface Reduction Research Symposium, Olympia.
- 26. Kerr Wood Leidal Consulting Engineers (KWL) (2005) Template for Integrated Stormwater Management Planning 2005. Report for Greater Vancouver Regional District, Kerr Wood Leidal Associates Ltd., Burnaby. http://www.waterbucket.ca/rm/sites/wbcrm/documents/media/18.pdf
- 27. Page, N., Rood, K., Holz, T., Zandbergen, P., Horner, R. and McPhee, M. (1999) Proposed Watershed Classification System for Stormwater Management in the Greater Vancouver Sewerage and Drainage District Area. Greater Vancouver Sewerage and Drainage District, Burnaby. http://www.raincoastappliedecology.ca/wp-content/uploads/2012/05/Proposed-Watershed-Classification-System-for-the-GVSDD-Area.pdf
- 28. BC Ministry of Agriculture (2014) The Metro Vancouver Regional Report (Summer 2010 & 2011) Agriculture Land Use Inventory. Ref No. 800.510-29.2014. http://www2.gov.bc.ca/assets/gov/farming-natural-resources-and-industry/agriculture-and-seafood/agricultural-land-and-environment/strengthening-farming/land-use-inventories/metrovanregional2010_11_aluireport.pdf
- 29. Metro Vancouver (2017) About Agriculture in the Region. http://www.metrovancouver.org/services/regional-planning/agriculture/about/Pages/default.aspx
- 30. Robinson, J.L. (2015) Fraser River Lowland. The Canadian Encyclopedia. http://www.thecanadianencyclopedia.ca/en/article/fraser-river-lowland
- 31. Luttmerding, H.A. (1981) Soils of the Langley—Vancouver Map Area. RAB Bulletin 18, BC Ministry of Environment, Map 6.
- 32. Kerr Wood Leidal Consulting Engineers (KWL) (2015) Options for a Region-Wide Baseline for On-Site Rainwater Management. Prepared for Metro Vancouver, Liquid Waste Services Department, Kerr Wood Leidal Associates Ltd., Burnaby.
- 33. Google Earth Pro (2014) Delta Agricultural Land Reserve, BC, Canada (49°04’03.45"N, 123°06’06.68"W, Eye alt. 1.2 km).
- 34. Agricultural Land Commission (ALC) (2014b) Agricultural Land Reserve Maps and GIS. http://www.alc.gov.bc.ca/alc/content/alr-maps/maps-and-gis
- 35. Earth Point (2016) KML Shapes—Polygon Area, Linestring Length, Placemark Point. http://www.earthpoint.us/Shapes.aspx
- 36. Environmental Systems Research Institute (ESRI) (2014) ArcGIS Desktop Version 10.2.
- 37. Paul, M.J. and Meyer, J.L. (2001) Streams in the Urban Landscape. Annual Review of Ecology and Systematics, 32, 333-365.
- 38. Dobb, A. (2013) BC Farm Practices & Climate Change Adaptation: Drainage. British Columbia Agriculture & Food Climate Action Initiative. http://www.bcagclimateaction.ca/wp/wp-content/media/FarmPractices-Drainage.pdf
- 39. Fraser Basin Council (2001) Nutrient Management Planning Strategies for the Fraser Valley. BC Ministry of Environment Lands & Parks. http://www.fraserbasin.bc.ca/_Library/FVR/report_fvr_nutrient_mgt_2001.pdf
- 40. Bull, J. and Freyman, L. (2013) Status of Water Quality Objectives Attainment in the Little Campbell River, Serpentine River and Nicomekl River, 1971-2009. BC Ministry of Environment.
- 41. BC Ministry of Agriculture (2011) Bylaw Standard for Residential Uses in the Agricultural Land Reserve. http://www2.gov.bc.ca/gov/content/industry/agriculture-seafood/agricultural-land-and-environment/strengthening-farming/local-government-bylaw-standards-and-farm-bylaws/residential-uses-in-the-alr
- 42. Zbeetnoff Agro-Environmental Consulting and Quadra Planning Consultants (2011) Delta Agricultural Plan, Phase 1: Delta Agriculture Profile. The Corporation of Delta. http://www.delta.ca/docs/default-source/community-planning-and-development/agricultural-plan/delta-agricultural-profile.pdf?sfvrsn=0