Agricultural Sciences
Vol.3 No.3(2012), Article ID:19038,7 pages DOI:10.4236/as.2012.33045
Identifying the dependency pattern of daily rainfall of Dhaka station in Bangladesh using Markov chain and logistic regression model
![]()
1Department of Agricultural Statistics, Faculty of Agribusiness Management, Sher-e-Bangla Agricultural University, Dhaka, Bangladesh; *Corresponding Author: mahbubfhisrt@gmail.com
2Department of Business Administration, Faculty of Business and Economics, Daffodil International University, Dhaka, Bangladesh
Received 15 January 2012; revised 22 February 2012; accepted 7 March 2012
Keywords: Characteristics of Rainfall in Bangladesh; Stochastic Models; Markov Chain Mode; Logistic Regression Model; Akaike’s Information Criterion (AIC)
ABSTRACT
Bangladesh is a subtropical monsoon climate characterized by wide seasonal variations in rainfall, moderately warm temperatures, and high humidity. Rainfall is the main source of irrigation water everywhere in the Bangladesh where the inhabitants derive their income primarily from farming. Stochastic rainfall models were concerned with the occurrence of wet day and depth of rainfall for different regions to model the daily occurrence of rainfall and achieved satisfactory results around the world. In connection to the Markov chain of different order, logistic regression is conducted to visualize the dependence of current rainfall upon the rainfall of previous two-time period. It had been shown that wet day of the previous two time period compared to the dry day of previous two time period influences positively the wet day of current time period, that is the dependency of dry-wet spell for the occurrence of rain in the rainy season from April to September in the study area. Daily data are collected from meteorological department of about 26 years on rainfall of Dhaka station during the period January 1985-August 2011 to conduct the study. The test result shows that the occurrence of rainfall follows a second order Markov chain and logistic regression also tells that dry followed by dry and wet followed by wet is more likely for the rainfall of Dhaka station and also the model could perform adequately for many applications of rainfall data satisfactorily.
1. INTRODUCTION
Bangladesh is an agriculture-based country where about 80% of its about 160 million people are directly or indirectly engaged in a wide range of agricultural activities. Rainfall is the most important natural factor that determines the agricultural production in Bangladesh. The variability of rainfall and the pattern of extreme high or low precipitation are very important for the agriculture as well as the economy of the country. It is well established that the rainfall is changing on both the global and the regional scales due to global warming [1-3]. The implications of these changes are particularly significant for Bangladesh where hydrological disasters of one kind or another is a common phenomenon [4,5]. Information on rainfall probabilities is vital for the design of water supply and supplemental irrigation schemes and the evaluation of alternative cropping and of soil water management plans. Such information can also be beneficial in determining the best adapted plant species and the optimum time of seeding to reestablish vegetation on deteriorated rangelands. Although rather long rainfall records are frequently available in many countries, little use is made of this information because of the unwieldly nature of the records.
Markov chain is generally recognized as a simple and effective description of the rainfall occurrence. The amount and pattern of rainfall are among the most important weather characteristics and they affect agriculture profoundly. In addition to their direct effects on water balance in soil, they are strongly related to other weather variables such as solar radiation, temperature, and humidity, which are also important factors affecting the growth and development of crops, pests, diseases and weeds. However, rainfall data form an essential input into many climatologic studies for agriculture, wherein considerable research focused on rainfall analysis and modeling [6]. “Persistence” means that tomorrow’s weather will be the same as today’s. Based on this assumption the test of dependence of today’s state of rain on the yesterday’s or the day before yesterday’s state of rain grew to high importance. A number of comprehensive and thorough research works have so far been conducted on rainfall but people are still scrutinizing ins and outs of meteorological data (specially rainfall) from different vantage points.
The sequence of wet and dry spells for Rthamsted experimental station, Harpendeen were studied for two five years periods 1938 to 1942 and 1943 to 1947, where it is shown that the frequency distributions of dry spells follow nearly a logarithmic series [7]. The sequences in daily rainfall occurrences at Tel Aviv for 27 mid-winter (December-February) from 1929-1949 were studied and were found that the Markov chain of first order is well enough to describe the dependency of data. They also found that the wet spell and dry spell follow geometric distribution [8,9]. The determination of the order of an ergodic Markov chain with a finite number of states using the method of Akaike’s Information Criterion (AIC) were discussed and applied the method to sequences of wet and dry days observed at Manchester and Liverpool, England [10].
The daily rainfall data at Samara, Nigeria during 1928 to 1978 was analyzed and the result shows that the first order Markov chain and gamma models provide a good fit to the precipitation data [11,12]. The start of the rains in West Africa for period 1943 to 1965 was examined and the start of the rain was defined as the first occurrence of a specified amount of rain within two successive days [13]. The probability distribution of seasonal rainfall data at Pabna station for the period 1902-1952 was analyzed and the result shown that the seasonal and monthly totals for the rainy season follow a normal distribution [14]. The daily, monthly, seasonal rainfall data of rainy season for five selected stations of Bangladesh for the period between 1966 and 1986 was studied to identify the impact of rainfall on agriculture [15]. The pattern of rainfall for-rainy season of Sylhet area, Bangladesh for the period between 1974 to 1984 was also studied to examine the overall distribution of rainfall in the study area [16].
The trends of regional variations and periodicities of annual rainfall in Bangladesh for 32 years between 1947 and 1979 at 30 meteorological stations were studied and the results shown that the yearly rainfall amounts for most of the stations follow a normal distribution [17]. The pattern of rainfall for selected areas of Bangladesh on the basis of first order Markov chain for the period between 1966 and 1986 were also examined and found that the daily rainfall occurrences during rainy season follow [8,9] models [18]. Impacts of the patterns of rainfall on agriculture for Bangladesh employing the daily rainfall occurrences of rainy season for the period 1966 to 1986 were identified. It was found that the first planting dates of Aus paddy follow Pearson type-1 model and Gaussian model for some areas [19]. The pattern of rainfall for separate transition probabilities of Markov chain, cases of stationary and non-stationary rainfall, covariate dependent transition probabilities of Markov model for rainfall occurrences for five meteorological stations of Bangladesh for the period 1964 to 1990 was also studied [20]. Also a case study on the probability distribution of both dry and wet spell for all seasons in Bangladesh in six divisional stations on the basis of 50 years of rainfall data were fitted [21].
Meanwhile, a case study reported that the first order of the Markov chain model found to fit the observed data in Italy successfully. The model based on the assumption that there is a dependency of the daily rainfall occurrence to that of the previous day [22]. Rainfall is the principal phenomenon driving many hydrological extremes such as floods, droughts, landslides, debris and mud-flows; its analysis and modeling are typical problems in applied hydrometeorology. Rainfall exhibits a strong variability in time and space. Hence its stochastic modeling is not an easy task [23]. The development of a rainfall occurrence model is increasingly in demand, not only for data-generation purposes, but also to provide some useful information in various applications, including water resource management, hydrological, and agricultural sectors. Identifying the appropriate model of daily rainfall occurrence, particularly on the distribution of dry (wet) spells, is very important as almost all of the climate variables are dependent on the rainfall events [24].
The information on weather’s wet and dry behaviour has vital importance to all allied fields like insurance, agriculture, industry etc. Once the rainfall process is adequately and appropriately modelled, the model can then be used in agricultural planning, may be able to aid in draught, soil erosion and flood predictions, impact of climate change studies, crop growth studies and other important fields. The analysis of extreme yearly rainfall shows that Markov Chain approach provides one alternative of modelling future variation in rainfall. The study shows only with the rainfall occurrence processes, and, more specifically, with modelling daily rainfall occurrences (a day is wet or dry) and the amount of rainfall for wet days. Hydrological and crop models usually require daily precipitation time series as input. To evaluate the sensitivity of these models to long-term changes in the precipitation regime an ensemble of input data sets are needed. The observed sequences provide only one realization of the weather process.
To evaluate the range of results that may be obtained with other statistically equivalent series it is desirable to generate synthetic sequences of precipitation data based on the stochastic structure of the meteorological process. The climate of Bangladesh is characterized by uneven distribution of rainfall over seasons and also over regions. Time series analysis of rainfall, has significant importance not only on cultivation but also on the crop calendar adjustment. An in-depth knowledge about the time series and logistic regression modeling on meteorological events (rainfall, humidity, minimum temperature and sea level pressure) has notable policy impact for agriculturists to develop effective cultivation system that will maximize the yield of crops. This study has concerned with the test of second order Markov chain at best. An attempt has been made to fit the logistic regression considering rainfall of current day as a dependent dichotomous variable on the independent dichotomous variables of yesterday and the day before yesterday’s rain.
2. SOURCE OF THE DATA
The secondary time series data on daily rainfall for Dhaka station about 26 years over the period January 1985-August 2011 are directly collected from the meteorological department of Bangladesh, which is situated in Agargoan Sher-e-Bangla Nagor, Dhaka [25]. Meteorological department usually preserves information about rainfall on six divisions of Bangladesh. Moreover they have available data on rainfall for other parts of Bangladesh on the basis of the occurrence of rainfall and so on. The preservation of the data is done using computer software. For the comprehension of the study, the data were sorted so that we can get a single column. Then the daily data from the period January 1985-August 2011 were arranged on a single column. This study is conducted on the rainfall of Dhaka station taking 26 past years on account. Fitting Markov model and search for logit dependence of dry wet cycle using logistic regression is done on the basis of daily rainfall.
During the study time, mean annual rainfall is 1598 mm with range 2273 mm to 1002 mm. It can be seen that November to January has the less average monthly rainfall (7.45 mm) and July has the highest of 375.41 mm.
3. METHODOLOGY OF THE STUDY
3.1. Markov Chain Model
Markov chain [26,27] probability model is based on the assumption that the state of any day depends only on the state of the preceding day. The dependence relationship is commonly assumed as first order dependence in which the outcome of one trial is dependent only on the outcome of the previous trial such that these transition probabilities are constants. Thus the appropriate mathematical model for studying the effect of dependence on this conventional procedure is a two state discrete time Markov Chain. In recent years there have been made a few attempts to model such dependence by higher order discrete state Markov Chains.
Markov Chain Model of Order M
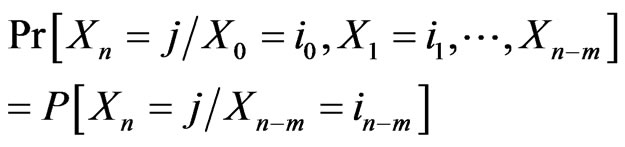
A Markov Chain is a Markov process where the state and parameter spaces are considered to be discrete and the dependence of the state is called Markovian dependence. A Markov chain of order m is a sequence of trails of the outcome if each trail depends on the outcome of the directly preceding trails and depends only on that. According to the sequence of a random variables {Xn} forms a Markov chain of order m, if given a fixed m, for all possible values of the variables Xn (n = 0, l, 2∙∙∙) it is true that
3.2. Logistic Regression Model
On the other hand, Regression methods [28] are an integral component of any data analysis concerned with describing the relationship between a (dependent variable) response variable and one or more explanatory variables. Logistic regression model has become the standard method for regression analysis of dichotomous data in many fields, especially in the health science. This study is confined to presence absence of rainfall of today either respect to the presence or absence of rainfall of yesterday and day before yesterday. Here the dependent variable will be rainfall of today, which can easily be made dichotomous. The presence of rainfall will take 1 with probability p (say) and the absence of rainfall will take 0 with probability 1 – p (say) in this logistic regression model and the selected independent variables are also categorical that takes the value 0 and 1 only.
Multiple Logistic Regression Model
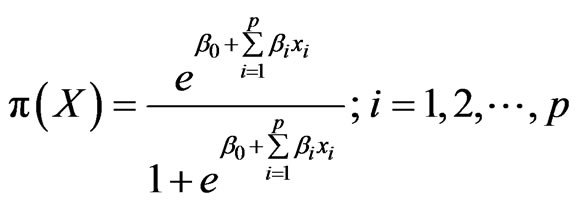
Consider a collection of p independent variables which will be denoted by the vector X' = (X1, X2, ∙∙∙, XP). For the moment we will assume that each of these variables is at least interval scaled. The specific form of the logistic regression model is as follows:
Then the logit of the multiple logistic regression models is given by the equation
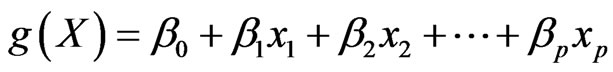
in which case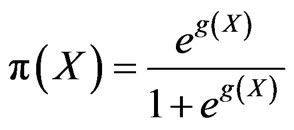 .
.
4. RESULTS AND DISCUSSIONS OF THE STUDY
4.1. Analysis of the Occurrence of Rain and Its Dependence by Markov Chain
The explanatory variables are measured in different kinds of scale but they are categorized in dichotomous form considering long past behavior of this meteorological factors in Bangladesh [29]. Notationally, all dependent and independent variables are as follows: The dependent variable rainfall (Y) is a dichotomous one, it takes on the value 1 with probability P (say) if the rainfall is present (>0.1 mm) and it takes on the value 0 with probability 1 – P if the rainfall is absent (<0.1 mm). The independent variables are:
X1 = Yesterdays rain
= 0, if x1 < 0.1
= 1, if x1 ≥ 0.1
X2 = Day before yesterdays rain
= 0, if x2 < 0.1
= 1, if x2 ≥ 0.1
4.1.1. Transition Counts and Transition Probabilities for Order One
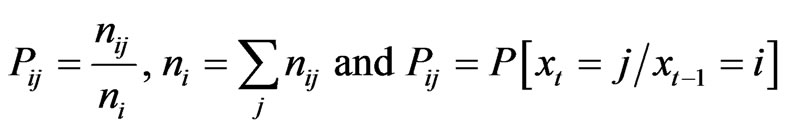
The transition counts for the first order Markov model are obtained by considering today’s and yesterday’s rain status of Dhaka station where (≥0.1 mm) rain is considered as wet day and (<0.1 mm) rain is considered as dry day. The following Table 1 shows the frequencies of the first order transitions considering today’s wet and dry day followed by yesterday’s wet and dry day.
From the above table, we see that the highest proportion (0.827) belongs to transition of the form dry day to dry day and the lowest proportion (0.172) belongs to transition from dry day to wet day. It is to be noted that transition to the dry is higher than the proportion of transition to the wet. Table 2 gives the maximum likelihood estimates of transition probabilities for a first order Markov chain obtained directly by using transition counts by the formula:
From the above table we see that being in dry state given that the day was dry at the previous time point is high (0.8272) and that of leaving the dry state is lowest (0.1728).
4.1.2. Transition Counts and Transition Probabilities for Order Two
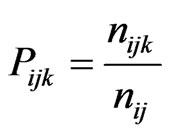
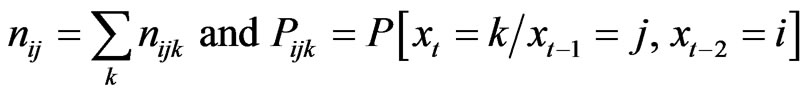
In order to count the number of transitions for the second order chain, it is necessary to consider the state of rain at three successive days. In other wards we observe whether today is dry or wet given the state of rain at the immediate past two days. Transition counts [30] for the second order chain are shown in the following Table 3.
In the above table, it is to be noted that among 4443 days 49.60% remain in the dry state for three consecutive days, whereas 14.24% of the days remain in the wet state. The rest of the states have changed the rain status at least once in the three successive days. The highest proportion (0.87) belongs to transition type dry at all consecutive day and the lowest proportion (0.37) is for transition of day before yesterday (wet) to yesterday (dry) to today day (wet). The maximum likelihood estimates of transition probabilities of a second order Markov chain obtained directly by using transition counts by the formula
where,
The estimates are shown in Table 4.
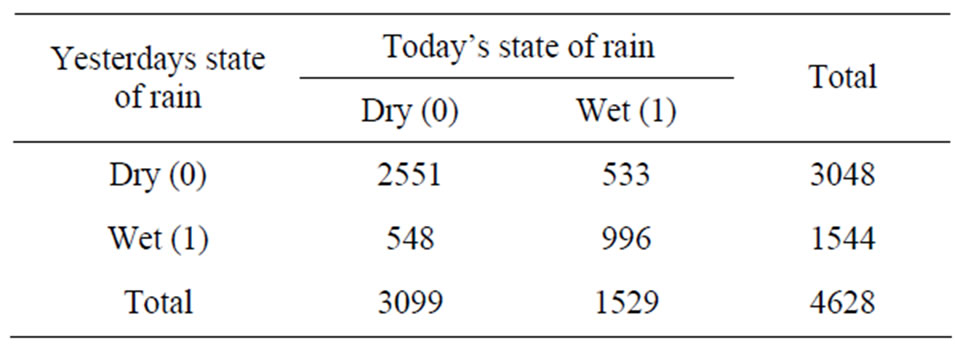
Table 1. Frequency distribution for first order transition counts.
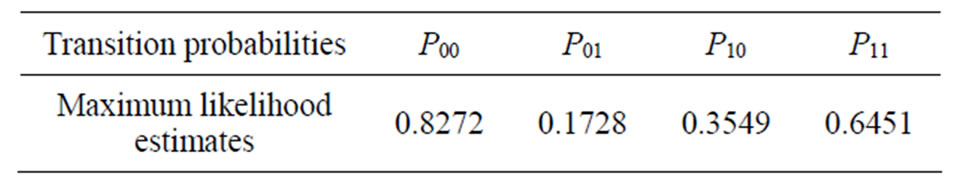
Table 2. The maximum likelihood estimates of transition probabilities for the first order model.
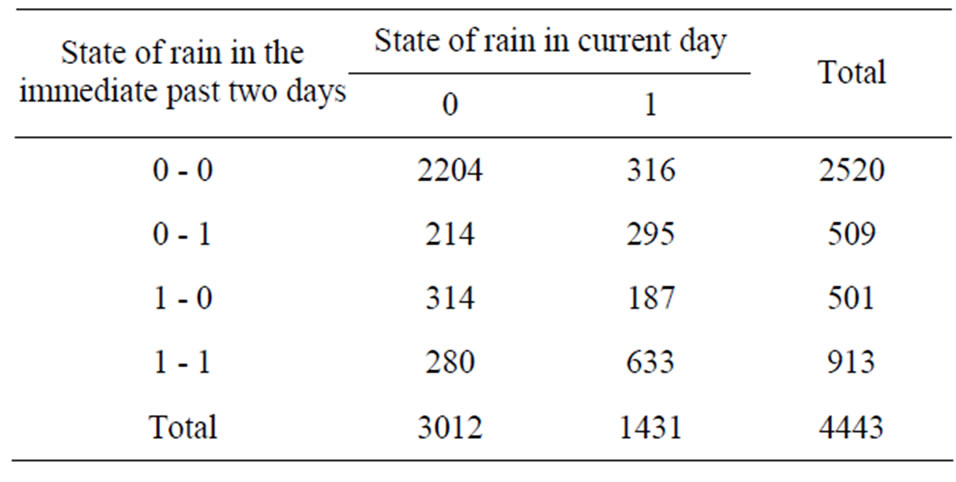
Table 3. Frequency distribution for second order transition counts.
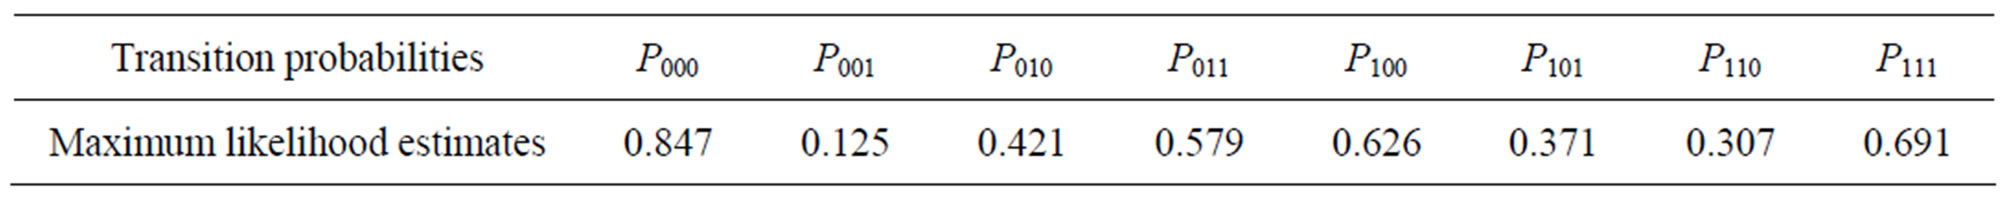
Table 4. The maximum likelihood estimates of transition probabilities for the second order model.
From the above table we see that the probability (0.8746) of being in dry state given that the day was in dry state at the previous time point is high and that of being in the wet state given the past two states were dry is lowest (0.125).
4.1.3. Testing the Order of the Markov Chain
4.1.3.1. The Markov Chain Is of Order Zero
To test the hypothesis that the Markov chain is of order zero i.e.H0: The chain is of order zero (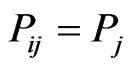 )
)
H1: The chain is of order one ( )
)
The test statistics is
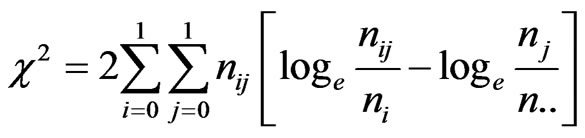
Which follow chi-square with S1–1(S – 1)2 = 20(2 – 1)2 = 1 degrees of freedom. The observed value of chi-square is 1024.500, which is greater than both  and
and . Hence we may accepts the alternative hypothesis that the Markov chain is of the order one.
4.1.3.2. The Markov Chain Is of Order One
To test the hypothesis that the Markov chain is of order zero i.e.H0: The chain is of order one ( )
)
H1: The chain is of order two ( )
)
The test statistics is
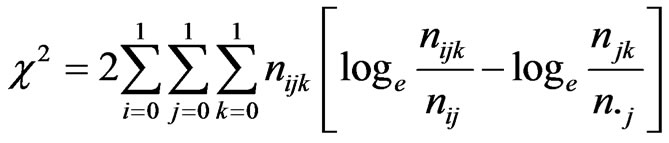
Which follow chi-square with S2–1(S – 1)2 = 21(2 – 1)2 = 2 degrees of freedom.
The observed value of chi-square is 301.26, which is greater than both χ2 0.05, 2 (5.99) and χ2 0.01, 2 (9.21). Hence we may accepts the alternative hypothesis that the Markov chain is of the order two [31,32].
4.2. Significance Test for Logistic Regression Parameters and Identification of Dependence of Rainfall
The empirical result of analysis is presented in Table 5. Before going to the result we described a short picture of the obtained statistics are given below in Table 6.
The total number of cases is 2349. Observation 0
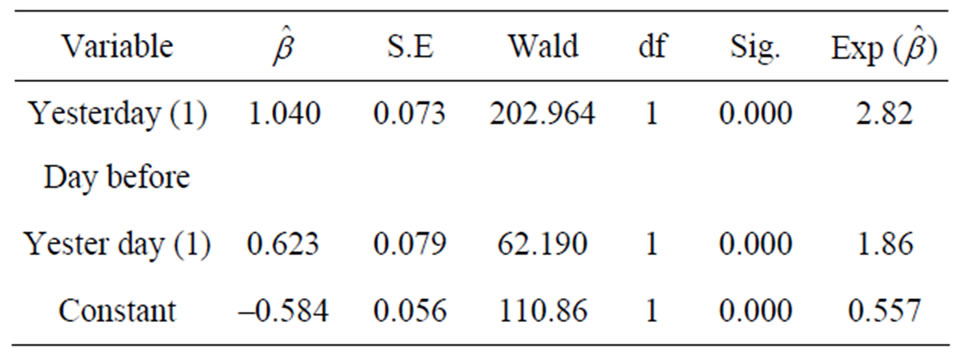
Table 5. Logistic regression output of rainfall dependence.
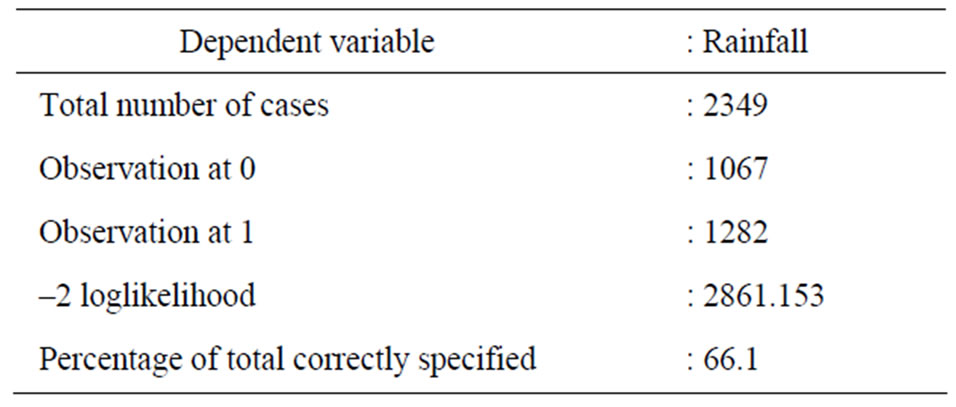
Table 6. Some features of the analysis.
means that the absence (<0.1 mm) of rainfall and observation 1 means the presence (≥0.1 mm) of rainfall. Out of total cases, 1067 cases are the absence of rainfall and 1282 cases are the presence of rainfall. The proportion of rainfall is 54.57%. Conventionally –2 loglikelihood is used as the measure of how well the model fits the data. Here –2 loglikelihood is 2861.153, which shows that the model fits the data well. From the classification we observed that the percentage of overall correct specification is 66.1%, which indicates a good fit of the model [33].
From the above table 6 we got the value of the test statistic (Wald) as 62.190 and 202.964 for day before yesterday and for yesterday respectively. Comparing these values of test statistic with the table values of Z at one degrees of freedom, we get the significance level at 0.000. Hence we can say that both the coefficient has significant influence on the regression function. So now the Exp ( ) can be interpreted as: Exp (
 ) = 2.82 i.e., The probability that today is wet is approximately thrice as likely if yesterday is wet compare to that day is dry. Exp (
 ) = 1.86 i.e., The probability that today is wet is approximately twice as likely if day before yesterday is wet compare to that day is dry. Moreover 1.51 [2.82/1.86] times likely that the probability of today being wet depends 1.51 times more on yesterday’s wet day as compared to the day before yesterday’ wet day.
5. CONCLUSION
Our discussion throughout this paper is mainly concerned with two main statistical procedures; one is the determination of stochastic model for both occurrence of rainfall and amount of rainfall and the other is the logistic regression procedure, which describes the dependence of one dichotomous dependent variable on other categorical independent variable. In connection to the Markov chain of different order, logistic regression is conducted to visualize the dependence of current rainfall upon the rainfall of previous two-time period. It had been shown that wet day of the previous two time period compared to the dry day of previous two time period influences positively the wet day of current time period. In logistic regression case, we consider that the current day’s rainfall is influenced by the rainfall of previous two days. But rainfall is also influenced by other meteorological factors (humidity, temperature and sea-level pressure). Very few studies have, so far, been attempted using data of this region. This study will open the door of research in this particular direction. It can be hoped that researchers, planners and policy makers will make headway in their fields using the findings of this study and contribute to the welfare of the country.
6. ACKNOWLEDGEMENTS
The author acknowledges the support of Quazi Md Mafizur Rahman, Ph.D. (Texas A & M), Supernumerary Professor, University of Dhaka and M Sharif Uddin, Ph.D. (Hokkaido), Associate Professor, Jahangirnagor University; Bangladesh in conducting the rainfall study. Also the authors are greatful to Professor Zulfikar Ahmed Reza Chairman, Dept. of Agricultural Statistics, Sher-e-Bangla Agricultural University for his continuous support during data collection and research planning.
REFERENCES
- Hulme, M., Osborn, T.J. and Johns, T.C. (1998) Precipitation sensitivity to global warming: Comparison of observations with HADCM2 simulations. Geophysical Research Letters, 25, 3379-3382.
- Dore, M.H.I. (2005) Climate change and changes in global precipitation patterns: What do we know. Environment International, 31, 1167-1181. doi:10.1016/j.envint.2005.03.004
- Kayano, M.T. and Sansígolo, C. (2008) Interannual to decadal variations of precipitation and daily maximum and daily minimum temperatures in southern Brazil. Theoretical and Applied Climatology, 97, 81-90. doi:10.1007/s00704-008-0050-4
- Banglapedia (2003) National encyclopaedia of Bangladesh. Asiatic Society of Bangladesh, Dhaka.
- Shahid, S. (2008) Spatial and temporal characteristics of droughts in the western part of Bangladesh. Hydrological Processes, 22, 2235-2247. doi:10.1002/hyp.6820
- Nnaji, A.O. (2001) Forecasting seasonal rainfall for agricultural decision-making in northern Nigeria. Agricultural and Forest Meteorology, 107, 193-205. doi:10.1016/S0168-1923(00)00239-2
- Williams, C.R. (1952) Sequences of wet and dry days considered in relation to the logarithmic series. Quarterly Journal of the Royal Meteorological Society, 78, 91-96. doi:10.1002/qj.49707833514
- Gabriel, K.R. and Neumann, J. (1962) On a distribution of weather cycles by length. Quarterly Journal of the Royal Meteorological Society, 83, 375-380. doi:10.1002/qj.49708335714
- Gabriel, K.R. and Neumann, J. (1962) A Markov chain model for daily rainfall occurrence at Tel Aviv. Quarterly Journal of Royal Meteorological Society, 88, 90-95. doi:10.1002/qj.49708837511
- Gates, P. and Tong, H. (1976) On Markov chain modeling to some weather data. Journal of Applied Meteorology, 15, 1145-1151. doi:10.1175/1520-0450(1976)015<1145:OMCMTS>2.0.CO;2
- Stern, R.D., Dennett, M.D. and Dale, I.C. (1982) Methods for analyzing daily rainfall measurements to give agronomically useful results. I. Direct methods. Experimental Agriculture, 18, 223-236. doi:10.1017/S001447970001379X
- Stern, R.D., Dennett, M.D. and Dale, I.C. (1982) Methods for analyzing daily rainfall measurements to give agronomically useful results. II. Direct methods. Experimental Agriculture, 18, 223-236. doi:10.1017/S001447970001379X
- Stern, R.D. and Coe, R. (1984) A model fitting analysis of daily rainfall data. Journal of the Royal Statistical Society: Series A, 147, 1-34.
- Islam, M.A. (1980) Probability distribution of seasonal rainfalls of pabana and same of its applications. Chittagong University Studies, 4, 111-119.
- Sinha, N.C. (1989) Impact of rainfall on agriculture: An Application of probability models. M. Phil. Thesis, University of Chittagong, Bangladesh.
- Sinha, N.C. and Paul J.C. (1992) Analysis of rainfall occurrences for sylhet station: An application of Markov model. Bangladesh Journal of Scientific Research, 10, 95-102.
- Islam, S.M.S. and Sinha, N.C. (1993) Markov chain analysis of rainfall in Bangladesh. Journal of Statistical Studies, 13, 45-53.
- Roy, M.K., Rahman, S. and Paul, J.C. (1990) Regional variations in the trends and periodicities of annual rainfall over Bangladesh. Journal of Statistical Studies, 10, 40- 50.
- Sinha, N.C. and Islam, S.M.S. (1994) Impact of the patterns of rainfall on aus and aman crops: An application of Markov model. Journal of Statistical Studies, 14, 77-85.
- Sinha, N.C. (1997) Analysis of rainfall in Bangladesh. Journal of Statistical Studies, 7, 25-30.
- Islam, S.E.D and Hossain, F.H. (2000) Fitting of daily rainfall occurrence as an alternating renewal process. Journal of Bangladesh Academy of Sciences, 24, 187- 195.
- Kottegoda, N.T., Natale, L. and Raiteri, E. (2004) Some considerations of periodicity and persistence in daily rainfalls. Journal of Hydrology, 296, 23-37. doi:10.1016/j.jhydrol.2004.03.001
- De Michele, C. and Bernardara, P. (2005) Spectral analysis and modeling of space-time rainfall fields. Atmospheric Research, 77, 124-136.
- Deni, S.M. and Jemain, A.A. (2009) Fitting the distribution of dry and wet spells with alternative probability models. Meteorology and Atmospheric Physics, 104, 13- 27. doi:10.1007/s00703-008-0010-7
- BBS, Dhaka, Bangladesh at a glance. http://www.bbsgov.org/urban/contents.htm
- Billingsley, P. (1961) Statistical methods in Markov chains. Annals of Mathematical Statistics, 32, 12-40. doi:10.1214/aoms/1177705136
- Ross, S.M. (1983) Stochastic processes. John Wiley, New York.
- Kleinbaum, D.G. and

 David G. Kleinbaum (Author) Visit Amazon’s David G. Kleinbaum Page Find all the books, read about the author, and more. See search results for this author Are you an author? Learn about Author Central lein M. (2005) Logistic regression: A self-learning text. Springer, Berlin.
 - Basu, A.N. (1971) Fitting of a Markov chain model for daily rainfall data at calcutta. Indian Journal of Meteorology and Geophysics, 22, 67-74.
- Kitagawa, G. and Gersch, W. (1984) A smoothness priors-state space modeling of time-series with trend and seasonality. Journal of American Statistical Association, 79, 378-389. doi:10.2307/2288279
- Good, I.J. (1955) The likelihood ratio test for Markov chain. Biometrika, 42, 531-533.
- Yakowitz, S.J. (1976) Small sample hypothesis tests of markov order, with application to simulated and hydrologic chains. Journal of the American Statistical Association, 71, 132-136.
- Ljung, G. and Box, G. (1978) On a measure of lack of fit in time series models. Biometrika, 67, 297-303. doi:10.1093/biomet/65.2.297