International Journal of Geosciences
Vol.05 No.12(2014), Article ID:51729,5 pages
10.4236/ijg.2014.512122
Inverse Correlations between Daily Average Energy of Global 0.01 to 1 M Earthquakes and Solar Flux Units: Possible Source of Coupling
David A. E. Vares, Michael A. Persinger
Laurentian University, Sudbury, Canada
Email: dx_vares@laurentian.ca, mpersinger@laurentian.ca
Copyright © 2014 by authors and Scientific Research Publishing Inc.
This work is licensed under the Creative Commons Attribution International License (CC BY).
http://creativecommons.org/licenses/by/4.0/


Received 29 August 2014; revised 27 September 2014; accepted 21 October 2014
ABSTRACT
The potential coupling between discrete releases of solar energy within the 2.8 GHz band and increments of seismic energy could suggest alternative mechanisms for solar-terrestrial interactions. Daily measures of Solar Flux Units (SFU) and the average energy of global earthquakes between 0.01 and 1 M for a 5 year period (2009-2013) shared about 25% of the same variance (r = −0.50). Average energies from the other successive 1 M intervals did not display the strength of this effect or were not statistically significant. The slope of the association indicated that for every 10−22 W/m2Hz1 decrease in daily SFUs, the average energy per earthquake in the 0.01 to 1 M range increased over the earth’s surface area on average by ~3 × 10⁻¹² J/m2. The discrepancy of ~1010 in energy density was accommodated by multiplication of the solar unit by the frequency equivalent (1.39 × 10¹⁰ Hz/T) of the Bohr magneton and its intrinsic magnetic field strength. Although the results and the convergent quantification suggest a coupling between the mechanisms responsible for fluctuations in 2.8 GHz power from the sun and the energies of the smallest magnitude earthquake activities as predicted, the presence of a third factor related to time or to the sun’s movement through space must still be accommodated.
Keywords:
Solar Flux Units, Small Magnitude Earthquakes, Solar-Seismic Equilibrium Energies, Bohr Magneton Transposition

1. Introduction
Most models of solar-earth mass interactions employ classic Newtonian solutions where the modal force between the two bodies is in the order of 1022 N. If one assumed this change of force was applied over the earth’s surface (5.1 × 10¹⁴ m2) equally, the proportion within the area occupied by an ionic bond (~6 × 10⁻²⁰ m2) would be equivalent to about 10−12 N. On the other hand the electric force between two charges at the distance of an ionic bond is more than 105 times greater (~4 × 10⁻⁹ N). Consequently gravitational changes are often considered negligible. The increasing and decreasing variations in force as earth completes its annual revolution are 2.3 × 10²¹ N or about 1014 N/s. The apparent minimal contribution from gravitational phenomena at these intervals of temporal change compared to electromagnetic interactions is particularly poignant when the rate of change for gravitational force over the earth’s surface per second during the orbit (~1.4 × 10⁻¹ N/m2s) is compared to the analogous units for an ionic force (4 × 10⁻⁹ N) per second (6.8 × 10¹⁵ Hz the Bohr frequency) divided by the cross-sectional area of the bond.
There may be other approaches that demonstrate a quantitative coupling between solar activity and specific increments of energy release by terrestrial seismicity. Persinger [1] calculated that conversion energy from the movement of the solar system through universal pressure [2] would be equivalent to the energy emission from global seismicity. Vares and Persinger [3] have shown that discrepancies in the distribution of magnitudes of earthquakes, particularly the 3.6 to 3.7 M increment, could be related to potential coupling to Zero Point Fluctuation forces and quantum energies. The relationship between solar activity, as inferred by electromagnetic emissions and global seismic activity has been assumed to be unidirectional as originating from the sun. However, Sytinkij [4] found that earthquakes preceded geomagnetic activity by 1 or 2 days. This association suggests greater simultaneity between solar-terrestrial releases of energy than typically assumed and perhaps a shared source of variance yet to be discerned rather than causal connections.
The possibility that solar-terrestrial coupling is an equilibrium process such that increases in solar energy are associated with diminishments of energy release within specific magnitudes of seismic activity could alter the current cause-effect models. The inverse association would suggest that the system exhibits a form of homeostasis or “equilibrium” and that this condition of the system could be influenced by third factors as the sun moves through a different space around the galactic center. Here we present evidence that a moderately strong inverse correlation occurs between daily solar activity, as measured in Solar Flux Units, and the small magnitude earthquakes that constitute almost 40% of all seismic events on the planet.
2. Methods and Materials
The Advanced National Seismic System (ANSS) global composite earthquake catalogue of the U.S. Geological Survey (USGS) was accessed and any earthquake registering above the minimum 0.01 magnitude value was queried from January 1, 2009 until December 31, 2013 for a total number of days N = 1826. MatLab software was utilized to compute daily average Earthquake radiated energy, daily total Earthquake radiated energy, and daily total number of recorded Earthquakes for each the orders of magnitude (0.01 - 1 M, 1.01 - 2 M, etc.). The following table depicts the daily seismic average activity with standard deviations in parentheses (Table 1).
The NOAA Penticton Solar Flux Unit (W/m2 Hz) F10.7 cm index is measured daily at local noon (2000 UT) in a bandwidth of 100 MHz centered on 2800 MHz at the Penticton site of the Dominion Radio Astrophysical Observatory (DRAO), Canada, where one solar flux unit is equivalent to 10−22 W/m2 Hz. The mean and standard deviation for the five year interval was 101.35 and 27.36 SFUs, respectively.
3. Results
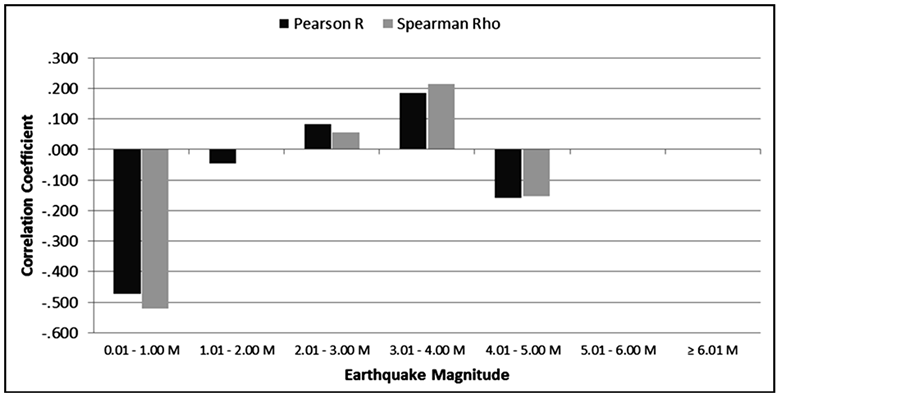
The results of the correlation analyses (parametric and non-parametric) between the variation in daily solar flux units (SFU) and the daily average energy per event released within the successive 1 M increments of earthquakes are shown in Figure 1. The strongest and most statistically significant association was between the lowest magnitude (0.01 to 1 M) quakes and the energy associated with SFUs.
The daily solar flux units displayed a strong negative relationship [rho = −0.51; r = −0.48, p < 0.001] with the daily average event energy for those recorded magnitudes between 0.01 - 1.00 M. In other words about 25% of the variance between the daily fluctuations in solar flux units and average earthquake energy within that band was shared. The strengths of the associations between the power of the solar flux activity and the other intervals
Table 1. Total numbers of events, the average energy of the events and the total energy per day for global earthquakes within 1 M increments of magnitude for five years (2009-2013).
Figure 1. Correlation coefficients (Pearson R, Spearman Rho) between the daily power in Solar Flux Units and the average energy of a seismic event within various 1 M intervals of earthquakes for the five years analyzed in this study.
of earthquake magnitude were much less, and although statistically significant (p < 0.05), accommodated less than 1% of shared variance.
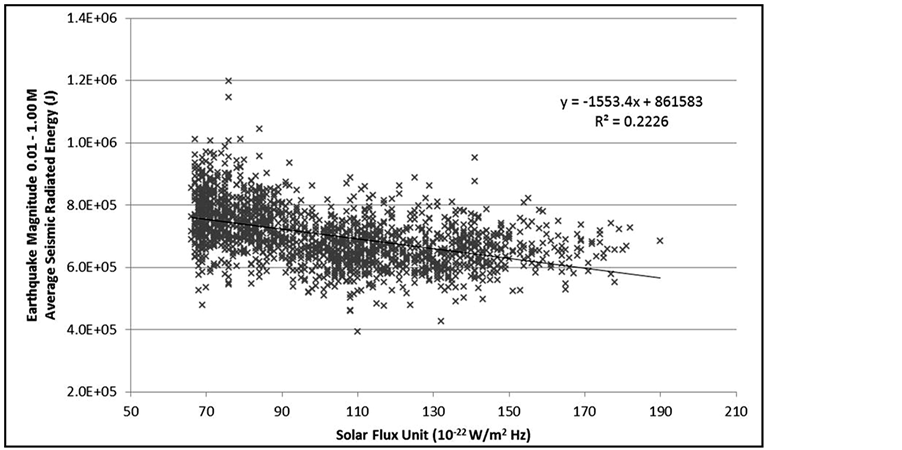
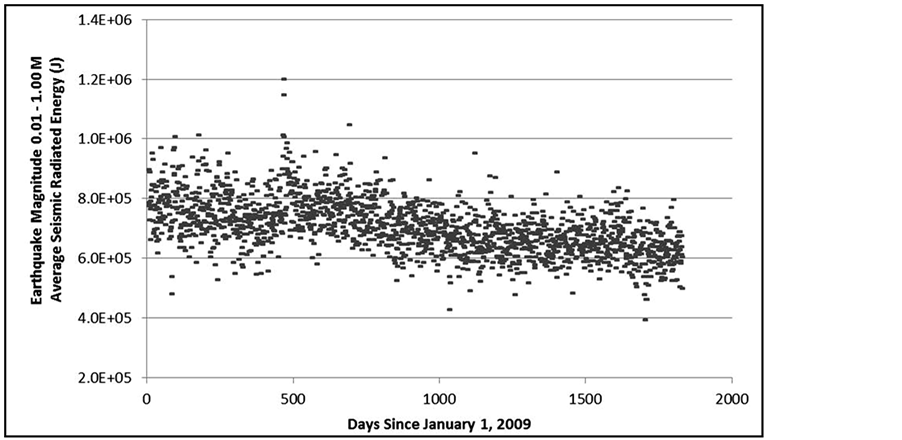
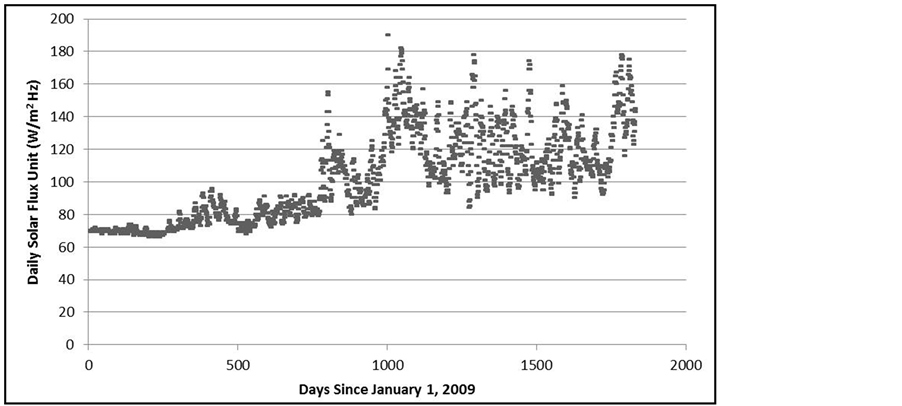
A scattergram with the results of regression analysis of the significant relationship over the 1826 day period from 2009-2013 between the average seismic radiated energy (J) for those Earthquakes of magnitude 0.01 - 1.00 M and the daily solar flux unit is shown in Figure 2. The slope indicated that for every 1 SFU unit decrease there was an increase of 1.55 × 10³ J per average earthquake within that interval of magnitude. To visualize the temporal development of the two major variables the actual values over real time for the five year period were graphed. Figure 3 shows the average energy per seismic event within the 0.01 to 1.0 M range over the five year period. Note the negative slope that is evident visually. Figure 4 shows the average power flux density for SFU units over time during the same period. In addition to the general positive slope there were conspicuous positive fluctuations.
The potential that the relationship was due to a shared source of variance associated with temporal progression, most likely movement through the galaxy was investigated. The correlation between SFU and days (over the five years) was r = 0.77. The correlation between the average energy per earthquake within the 0.01 to 1 M range was r = −0.55. This inverse relationship effectively reflects the vector of the association observed for the bivariate correlations. It is unlikely that monitoring sensitivity was the source of an artefact because, if they were valid, one would expect the numbers of these very low magnitude events to increase with more sensitive instrumentation. That did not occur. To accommodate the potential contribution from the shared time for SFU and seismicity, symmetrical partial correlation analyses were completed. The results are shown in Table 2.
Figure 2. Scattergram showing the inverse correlation between the values of Solar Flux Units and the average magnitude of seismic events (in Joules) per day for the earthquakes between 0.01 M and 1.00 M).
Figure 3. Average energy per event within the 0.01 to 1.0 M range per day for the five years involved in the analyses.
That energy rather than numbers of events were the source of the association with solar activity was shown by the maintenance of the significant correlation (−0.44) after the zero order correlation (r = −0.47) was controlled for the shared relationship with numbers of these small magnitude events. In fact the weak correlation (r = 0.22) between the numbers of small magnitude quakes and SFUs was eliminated when the variance associated with the average energy for those events was first removed (partial r = 0.08). What was clear was that a priori removal of the shared correlation between SFUs and average energy markedly reduced the shared variance between solar activity and seismic energy release within this interval of magnitudes.
4. Discussion and Implications
These analyses clearly demonstrated that solar activity within the range of 50 to 150 SFUs and the average en-
Table 2. Zero order correlation (R) between the fluctuations in Solar Flux Units (SFU), average energy per earthquake in the 0.01 to 1 M range, and time (days) for the 5 years of the analyses. ∆R refers to the partial correlation and absolute change in the coefficient after shared variance for two variables with the remaining variable was removed.
Figure 4. NOAA Penticton solar flux unit (W/m2 Hz) F10.7 cm index as measured daily at local noon (2000 UT) for each day between 1 January 2009 and December 2013.
ergy from the 1 M band of the weakest earthquakes (0.01 to 1 M) were negatively correlated. The two phenomena shared about 25% of their variance. The correlations between the daily fluctuations in SFUs and seismic energy release for any of the other increments of earthquake occurrences were not correlated in a statistically significant manner. Even when accommodating and encouraging the contributions from outliers, such as for the largest seismic events during this interval, there was no significant correlation with solar activity as defined by 2.8 GHz power fluctuations.
These results are consistent with a process of equilibrium between a proportion of energy associated with solar power within the GHz band and the release of increments of energy within the Mega Joule (MJ) for earthquakes. Usually such inverse associations suggest both phenomena are related to a third factor such that A + B = k. In other words, if quantity B increases quantity A must decrease and vice versa. The most likely model would involve a resonance coupling.
The average energy of the magnitudes within the range (0.01 to 1 M) that was significantly and negatively correlated with solar activity was about a MJ. The equation indicated that for every 10−22 W/m2Hz (kg/s2) decrease in solar activity within the 2.8 GHz range, the average energy per unit event within the 0.01 to 1 M range quakes over the surface of the earth increased by 1.55 × 10³ J or, over the surface of the earth (1.5 × 10¹⁴ m2), 3.05 × 10⁻¹² J/m2 (kg/s2). If an equilibrium system is operating, the approximately 1010 difference in magnitude must be accommodated.
We would expect the coupling to occur within the quantum level of matter. The Bohr magneton, in Hz (μB/h), where μB is the magnetic moment of the Bohr magneton and h is Planck’s constant, is 1.40 × 10¹⁰ Hz/T. The estimated magnetic field strength (B) according to:
 (1)
(1)
where μ = magnetic permeability in a vacuum (1.26 × 10⁻⁶ N/A2), I is the unit charge (1.6 × 10⁻¹⁹ As), and r is the (Bohr) radius (5.29 × 10⁻¹¹ m), multiplied by the frequency of orbits (6.58 × 10¹⁵ Hz) is 3.99 T. So, (10−22 W/m2 Hz) × (1.4 × 10¹⁰ Hz/T) × (3.99 T) is 5.6 × 10⁻¹² W/m2. Over 1 unit second this would be equivalent to 5.6 × 10⁻¹² J/m2 which is within measurement error range of the value predicted by the equation. We suggest that the source of this energy should be contained within the sub-matter space and its structure within which matter from the sun and the earth are immersed.
The presence of a “resonance” that could serve as the shared source of variance for the reciprocal relationship between average energy per seismic event within the 0.01 to 1 M range and solar activity might be supported by a quantitative solution involving relevant parameters. The strong dependence of both daily flux density and average earthquake energy within the smallest interval upon time could indicate the contribution from the movement of the solar system around the galaxy. Assuming the functional rotational length (circumference) of the earth (4 × 10⁷ m) and the typical value of 2.42 × 10⁵ m/s for the sun’s orbital velocity around the galaxy, the duration would be 165 s. If this was an average inter-event interval, this means there would be about 520 events between 0.01 and 1.0 M per day where the empirical value was ~110 per day. The discrepancy may simply reflect the current relatively fixed density of instrumental coverage over the earth’s surface.
Consideration of the contribution of convergence between gravitational and electromagnetic energies may be revealing. The ~10−10 N in an area of an ionic bond from the gravitational attraction between the earth and the sun when applied across the linear distance is within the range of 10−20 J. This quantity of energy is one solution that could intercalate domains within Planck’s Length to forces and energies that could “bind” all components of the universe [5] .
Acknowledgements
Thanks to Dr. Blake T. Dotta for technical suggestions.
References
- Persinger, M.A. (2014) Conversion Energy from the Movement of the Solar System through Universal Pressure: Reflections in Seismic Events and Global Temperatures. International Letters of Chemistry, Physics and Astronomy, 17, 78-86.
- Persinger, M.A. (2009) A Simple Estimate for the Mass of the Universe: Dimensionless Parameter A and the Construct of Pressure. Journal of Physics, Astrophysics and Physical Cosmology, 3, 1-3.
- Vares, D.A.E. and Persinger, M.A. (2013) The ~3.6 to 3.7 M Paucity in Global Earthquake Frequency: Potential Coupling to Zero Point Fluctuation Force and Quantum Energies. International Journal of Geosciences, 4, 1321-1325. http://dx.doi.org/10.4236/ijg.2013.410127
- Styinskij, A.D. (1989) Correlation of Earthquakes with Solar Activity. Izveztiya, Earth Physics of Solid Earth, 25, 86-98.
- Persinger, M.A. (2014) Discrepancies between Predicted and Observed Intergalactic Magnetic Field Strengths from the Universe’s Total Energy: Is It Contained within Submatter Spatial Geometry? International Letters of Chemistry, Physics and Astronomy, 11, 18-23.


