International Journal of Geosciences
Vol.4 No.9(2013), Article ID:40227,13 pages DOI:10.4236/ijg.2013.49125
Net Nitrogen Mineralization in Natural Ecosystems across the Conterminous US
1Department of Marine, Earth, and Atmospheric Sciences, North Carolina State University, Raleigh, USA
2Eastern Forest Environmental Threat Assessment Center, United States Department of Agriculture—Forest Service, Raleigh, USA
Email: *Steve_mcnulty@ncsu.edu
Copyright © 2013 LeeAnna Y. Chapman et al. This is an open access article distributed under the Creative Commons Attribution License, which permits unrestricted use, distribution, and reproduction in any medium, provided the original work is properly cited.
Received August 27, 2013; revised September 29, 2013; accepted October 26, 2013
Keywords: Nitrogen Limitation; Total Kjeldahl Nitrogen; Forest; Grassland; Linear Regression; Plant Available Nitrogen
ABSTRACT
Nitrogen is the primary nutrient limiting ecosystem productivity over most of the US. Although soil nitrogen content is important, knowledge about its spatial extent at the continental scale is limited. The objective of this study was to estimate net nitrogen mineralization for the conterminous US (CONUS) using an empirical modeling approach by scaling up site level measurements. Net nitrogen mineralization and total soil nitrogen data across the CONUS were obtained from three different ecosystems: low elevation forests, high elevation forests, and grasslands. Equations to predict net nitrogen mineralization were developed through stepwise linear regression using total Kjeldahl nitrogen, air temperature, precipitation, and nitrogen deposition as predictor variables for four categories: low elevation high temperature forests (coefficient of determination, R2 = 0.83), low elevation low temperature forests (R2 = 0.74), high elevation forests (R2 = 0.80), and grasslands (R2 = 0.88). A map of net nitrogen mineralization was developed in GIS using these equations and national-scale databases for the CONUS. The result shows that net nitrogen mineralization varies widely across the US. Grasslands were predicted to have the lowest net nitrogen mineralization, while low elevation forests in the east had the highest. Mean values were 14.3 kg·ha−1·yr−1 for grasslands, 22.6 kg·ha−1·yr−1 for high elevation forests, 58 kg·ha−1·yr−1 for low elevation low temperature forests, and 82.9 kg·ha−1·yr−1 for low elevation high temperature forests. This continental scale estimation of net nitrogen mineralization provides a means of comparing net nitrogen mineralization across regions, and the databases developed from this study are useful for accounting for nitrogen limitations in large scale ecosystem modeling.
1. Introduction
Nitrogen is the nutrient that most often limits plant growth in ecosystems [1-3]. Soil nitrogen limitations impact many components of an ecosystem, including limiting forest growth and yield and constraining carbon sequestration [4]. However, too much nitrogen leaving soils can cause water pollution problems in watersheds [5,6]. Total soil nitrogen includes nitrogen in all organic and inorganic forms, but is not an indicator of plant available nitrogen. Total soil nitrogen is often referred to as total Kjeldahl nitrogen (TKN) because it is primarily measured using the Kjeldahl method, a wet oxidation laboratory procedure used for the quantitative determination of nitrogen in a substance [7]. Nitrogen mineralization, the conversion of organic nitrogen to ammonium, represents most of the nitrogen availability in unfertilized soils [8], and provides an index of plant available nitrogen [9].
Ecological modeling requires accurate soil nutrient information [10,11]. Campbell et al. [12] reported that a way to extrapolate soil nitrogen availability from field data was urgently needed; such a resource is still unavailable. Modeling simulations have shown that carbon sequestration under higher carbon dioxide (CO2) conditions and future climate change conditions are likely overestimated when nitrogen limitations are omitted [13, 14]. Piao et al. [15] suggested that new terrestrial biosphere models include nutrient limitations to account for the substantial effect of carbon-nitrogen interactions of climate variability and atmospheric CO2 concentration on modeled carbon cycle. Fan et al. [16] indicated that better predictions of forest ecosystem dynamics at the regional scale could be provided by using different nitrogen mineralization equations to relate to different regions and scales.
Micro-environmental conditions strongly affect nitrogen mineralization [17]. Factors controlling nitrogen mineralization vary spatially and temporally and include temperature, soil moisture, and quality of organic matter [18-20]. Temperature and soil moisture have been widely shown to influence nitrogen mineralization [19]. Cold and dry climates have low nitrogen mineralization and low plant nitrogen use efficiency due to slowed enzyme activity [21]. An increase in total soil nitrogen has been shown to correlate to increased nitrogen mineralization [22,23]. Increased nitrogen deposition is correlated to increased nitrogen availability [24,25] due to nitrogen enriched soil, as well as net primary production [26].
Although net nitrogen mineralization is important to ecosystem productivity, a national scale database of net nitrogen mineralization that could be used for ecosystem model development is lacking primarily due to lack of spatial data at a continental scale. Many models have been developed to predict potential nitrogen mineralization measured via lab incubations [27,28]. However, few studies have scaled up field measurements and have estimated nitrogen mineralization at a regional scale [16, 29]. Burke et al. [30] utilized the CENTURY ecosystem model to estimate nitrogen mineralization for the US Central Plains region. Fan et al. [16] estimated nitrogen mineralization across the Midwestern Great Lakes region based on leaf litter, evapotranspiration, and soil texture using GIS.
In this work, we synthesized data from previous studies measuring in situ net nitrogen mineralization. Net annual nitrogen mineralization was calculated as the sum of monthly incubated sample nitrogen (NH4-N + NO3-N) minus initial monthly sample nitrogen (NH4-N + NO3-N). Stepwise multiple linear regressions were performed for four data categories: high elevation forests, low elevation low temperature forests, low elevation high temperature forests, and grasslands (including prairies, grasslands, shrublands, and woodlands) to generate equations estimating net nitrogen mineralization based on total Kjeldahl nitrogen, air temperature, precipitation, and nitrogen deposition. These equations were applied to existing national scale databases to generate a map of net nitrogen mineralization for the conterminous US (CONUS) because a national scale database of nitrogen availability does not currently exist.
The objective of this study were to create a set of empirical models that can predict net nitrogen mineralization based on total Kjeldahl nitrogen and other environmental variables and to utilize these equations to generate a map of net nitrogen mineralization for the CONUS. Our ultimate goal is to improve spatially explicit soil nutrient data for regional ecosystem modeling.
2. Methodology
Data were obtained from publications reporting both net nitrogen mineralization and total soil nitrogen data across the CONUS for low elevation low temperature forests, low elevation high temperature forests, high elevation forests, and grasslands. Through stepwise multiple linear regression, equations to predict net nitrogen mineralization were developed for each category using TKN, average air temperature during growing season, total precipitation during growing season, and nitrogen deposition as predictor variables. Using these equations and nationalscale databases of TKN, air temperature, precipitation, and nitrogen deposition for the CONUS, a map of net nitrogen mineralization was developed in GIS.
2.1. Factors Affecting Nitrogen Availability
A literature review was first conducted to locate studies reporting both total soil nitrogen and net nitrogen mineralization rate across the CONUS. Often, studies reporting total soil nitrogen and net nitrogen mineralization are soil warming, elevated carbon dioxide, or nitrogen fertilization experiments. Only data from control plots were included from these studies to reflect ambient conditions. The data obtained were used to develop net nitrogen mineralization rate equations based on parameters influencing net nitrogen mineralization that included total soil nitrogen, air temperature, precipitation, and nitrogen deposition (Table 1).
The study locations produced by the literature review were widely distributed across a large climatic gradient (Figure 1). Net nitrogen mineralization studies are conducted primarily using in situ incubations or laboratory incubations. The most widely used method for in situ studies is the buried bag procedure following Eno [46], in which soil is incubated in the field via polyethylene bags, although the exact methodology varies by experiment. A few studies utilized the resin core method of DiStefano and Gholz [47]. Results from the resin technique have been found to correlate well with the buried bag [48] and there is no evidence of a systemic bias [49,50]. We followed previous studies that have utilized data from different in situ nitrogen mineralization measurement methods [51] and included studies even if they did not have identical methodology. Studies involving laboratory incubations measure potential nitrogen mineralization, most often utilizing aerobic incubations with constant air temperature and soil moisture content. In situ

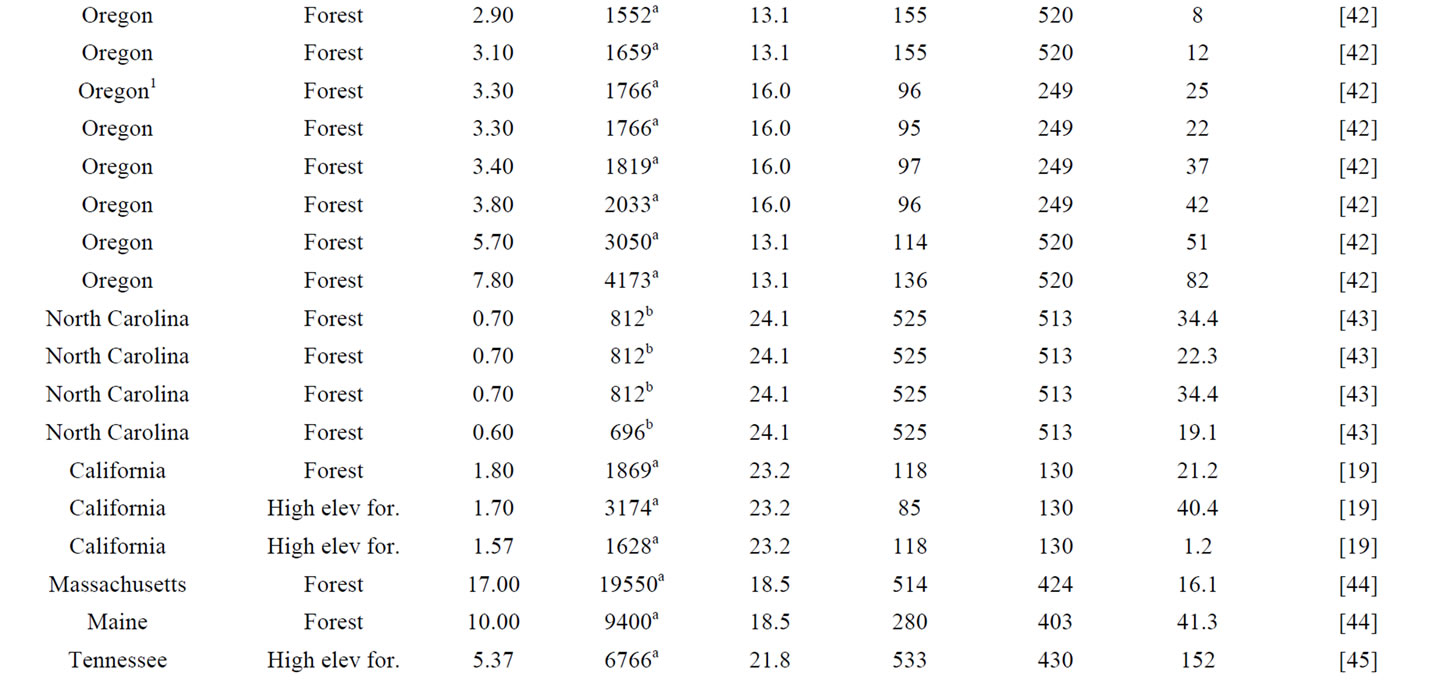
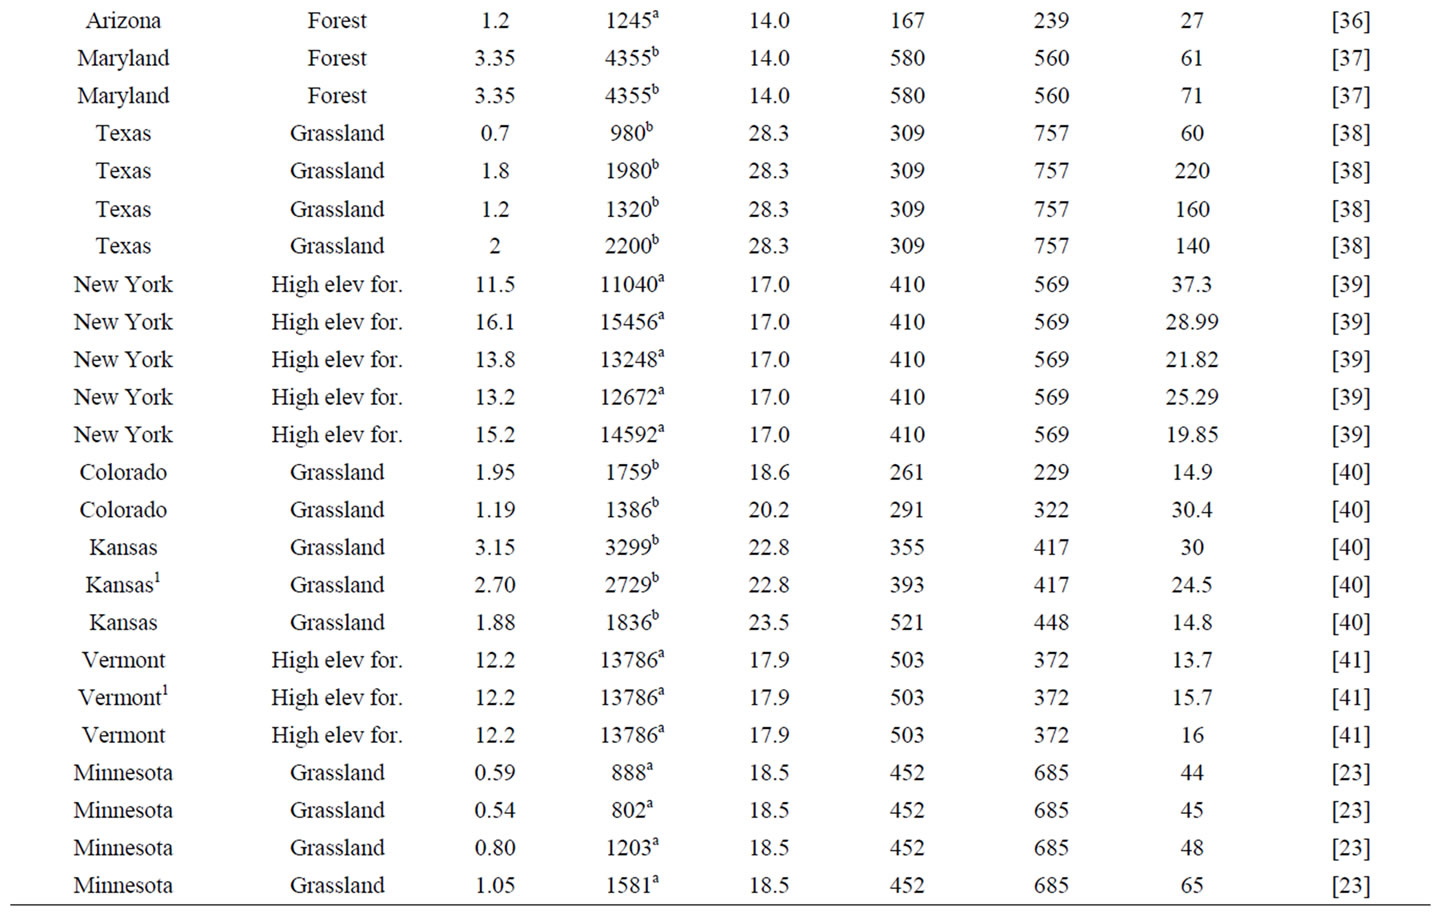
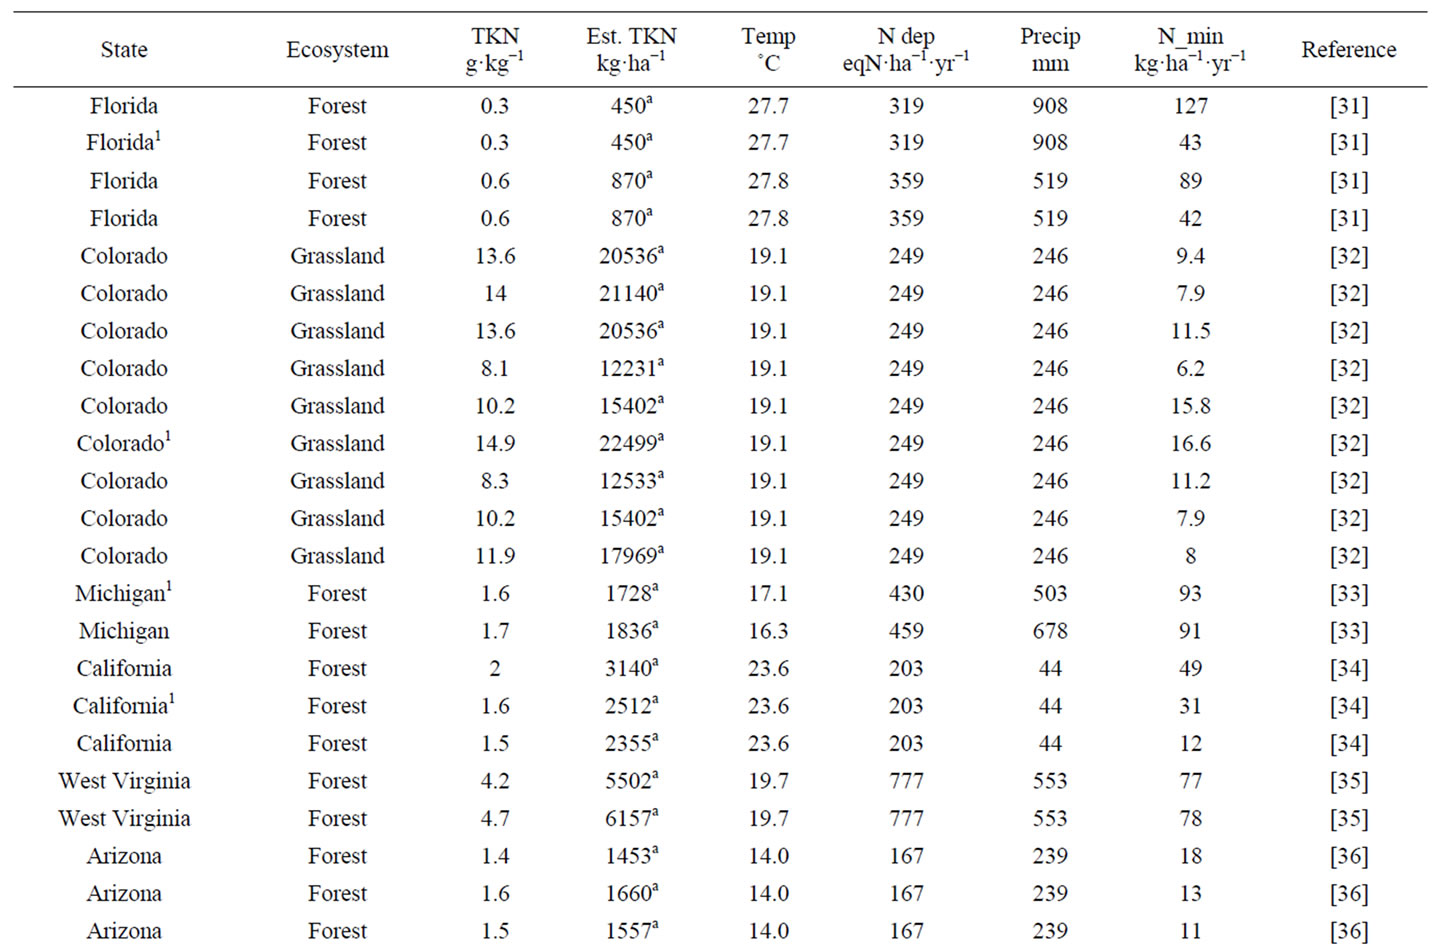
Table 1. Observations utilized in the development and validation of in situ net nitrogen mineralization equations in this work.
methods are influenced by ambient air temperature and precipitation of the study site, whereas laboratory incubations are kept at constant air temperature and soil moisture content. Soils incubated in a laboratory do not show seasonal patterns [20]. Potential mineralization depends on other factors such as incubation method and time, which vary greatly by experiment and have large impacts on nitrogen availability estimates [17]. Therefore, only in situ incubation data was the focus for the generation of the net nitrogen mineralization equations in this study. Total soil nitrogen measured on a mass per mass basis (e.g., gN·kg·soil−1·yr−1) was the focus of this study as this measurement type had the greatest number of data points and the greatest variety of ecosystems. Total soil nitrogen data were converted to common units of g·kg−1·yr−1. If data were reported as a percentage, it was converted into g·kg−1·yr−1.
To better represent nitrogen availability, total soil nitrogen on a per area basis (kg·ha−1) was needed. An estimate of total soil nitrogen in kg·ha−1 was obtained using bulk density either from publications or by soil type and location (Table 1) when the publication was missing or had incomplete bulk density values [52]. Only the upper mineral soil was examined in most nitrogen mineralization studies [17]. Therefore, when converting from mass per mass to mass per area, soil depth was kept constant at 10 cm for all data points to provide standardization among studies. The estimated value of total soil nitrogen was used in this study for consistent treatment (Table 1) because per area total soil nitrogen is not given in all publications. The resulting total soil nitrogen values from 0 - 10 cm depth were used for regression analysis and mapping at the continental scale.
Air temperature was used instead of soil temperature for this study because air temperature data are easily obtainable and proved to have a high statistical correlation to net nitrogen mineralization. Monthly total precipitation and mean air temperature data for year 2010 were downloaded from the National Climatic Data Center (NCDC) for a nearby station for each of the research areas recorded in the in situ net nitrogen mineralization studies (Table 1). The majority of net nitrogen mineralization occurs during the growing season due to higher temperature and greater soil moisture. We define growing season as the month of May-September. The wet and dry nitrogen deposition data were derived from a 1-km2 resolution map compiled by McNulty et al. [53], who combined the wet deposition map of Grimm and Lynch [54], wet deposition isopleth maps from the National Atmospheric Deposition Program/National Trends Network (NADP/NTN) [55], and dry deposition data from the Clean Air Status and Trends Network (CAST-NET) [56].
Data utilized in this study represent many ecosystems developed under a variety of climate regimes (Figure 1). Across the CONUS, total soil nitrogen varied from 0.3 to 17 g·kg−1, average growing season air temperature ranged from 12.8˚C to 28.3˚C, total growing season precipitation ranged from 44 to 908 mm, nitrogen deposition ranged from 84 to 777 eqN·ha−1·yr−1, and net nitrogen mineralization ranged from 1.2 to 220 kg·ha−1·yr−1. Other studies have shown that vegetation influences net nitrogen mineralization [8]. Given the variability in site conditions among the studies, models were formulated for different land uses, resulting in several net nitrogen mineralization equations for different data categories. High elevation ecosystems contain unique characteristics, such as low air temperature but high TKN [39] and were thus separated from low elevation studies. Similarly, forest and grassland ecosystems were separated to account for their diverse climatic, soil, and vegetation characteristics. Data were divided by high elevation forest, low elevation forest, and grassland (including prairie, grassland, shrubland, and woodland) studies to account for differences (e.g., vegetation, soil type) among ecosystems. Data clustering of previous studies of temperature and net primary productivity (NPP) [30,57] and soil respiration [21], reveals a data division around 19˚C. Below 19˚C, net NPP and soil respiration rate increase linearly with temperature. Above 19˚C, a strong linear relationship between temperature and these processes is no longer
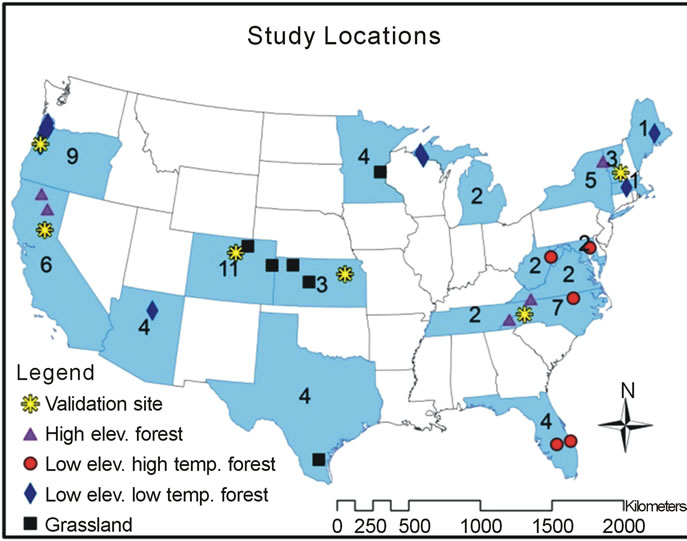
Figure 1. Map of study locations. The number of data points in each state is also shown. Symbols indicate the category of the data.
observed. Thus, the low elevation forest category was further divided by temperature due to differences in productivity at high and low temperature forests with a division threshold of 19˚C.
2.2. Linear Regression Models
Stepwise multiple linear regressions were performed independently in Microsoft Excel for each data category (i.e., high elevation forests, low elevation high temperature forests, low elevation low temperature forests, and grasslands) with annual net nitrogen mineralization as the dependent variable and four independent variables: total soil nitrogen from 0 to 10 cm depth, average air temperature (˚C) during growing season, total precipitation (mm) during growing season, and nitrogen deposition (eqN·ha−1·yr−1). Independent variables were only included in the final equations if they were statistically significant (i.e., p-value < 0.1).
2.3. Mapping Net Nitrogen Mineralization
The equations developed were used to calculate national scale net nitrogen mineralization from existing CONUS databases of the five predictor variables. The total Kjeldahl nitrogen map was developed at a 1-km2 resolution using soil taxonomic relationships to link data from the National Soil Characterization Database to spatial information in STATSGO (State Soil Geographic Database) [58]. Averages from 1960-2010 Parameter-elevation Regressions on Independent Slopes Model (PRISM) data were used to obtain average growing season temperature and total growing season precipitation (http://www. prism.oregonstate.edu/). The map aggregated to a 1-km2 resolution compiled by McNulty et al. [53] was used for wet and dry nitrogen deposition.
The 2006 National Land Cover Database [59] was used to determine which areas were forests and grasslands. Forested land cover types included deciduous, evergreen, and mixed forests. Grasslands, pasture, and shrublands were included in the grassland category. Air temperature data from PRISM was used to determine forest areas above and below 19˚C for use in separating low elevation high temperature forests from low temperature forests (Table 2). High elevation in this study indicates an elevation of 304.8 m (i.e., 1000 ft) or greater [60]. The National Elevation Dataset (Data available from the US Geological Survey) was utilized to determine elevation. Spatially distributed net nitrogen mineralization was computed within ArcGIS as functions of total Kjeldahl nitrogen, nitrogen deposition, temperature, and precipitation.
2.4. Validation of the Linear Regression Models
In each of the four data categories, two net nitrogen

Table 2. Characteristics, coefficient of determination, and p-values for each data category selected for regression.
mineralization data points were randomly excluded from regression for use in validation of the derived regression equations (Table 1, Figure 1). After stepwise multiple linear regression was performed and statistically significant variables were identified (p-value < 0.1), the corresponding equation was used to predict net nitrogen mineralization for these two excluded sites in each data category. The predicted net nitrogen mineralization values were compared to the measured net nitrogen mineralization values to verify if the equations were representative of different site conditions. A value was considered significantly different if the predicted value did not fall within the measured value plus or minus the standard error of the category. If the predicted net nitrogen mineralization was significantly different from the measured value, factors causing the discrepancy are explored and discussed.
3. Results
3.1. Nitrogen Mineralization Equations
Net nitrogen mineralization equations were created separately for the four ecosystem categories through stepwise multiple linear regression. The equations were used to compare predictions to measured values for each category. Predictions were also made for validation sites and compared to their measured value and discrepancies explored.
3.1.1. High Elevation Forests
In the high elevation forest category, the regression model for net nitrogen mineralization had a coefficient of determination (R2) of 0.80, adjusted coefficient of determination (adjusted R2) of 0.76 (sample size, n = 16), and standard error (S.E.) of 11.54 (Table 3). The associated equation was used to predict net nitrogen mineralization for high elevation locations included in regression and was compared to their corresponding measured values (Figure 2). Validation sites in Vermont and North Carolina were predicted to have net nitrogen mineralization rates of 20 kg·ha−1·yr−1 (vs. observed value of 15.7 kg·ha−1·yr−1) and 81 kg·ha−1·yr−1 (vs. observed value of 82 kg·ha−1·yr−1), respectively. The formula for net nitrogen mineralization in the high elevation category is presented below (Equation 1).
 (1)
(1)
where N min is predicted net nitrogen mineralization (kg·ha−1·yr−1), SoilN is estimated total soil nitrogen (kg·ha−1), Depo is nitrogen deposition (eqN·ha−1·yr−1), and Precip is total growing season precipitation (mm).
3.1.2. Grasslands
After graphing net nitrogen mineralization for grasslands (R2 = 0.73), it was apparent that the data from Hibbard et al. [38] was an outlier, as measured net nitrogen mineralization values are much greater than those in other areas. Further investigation revealed that this study was
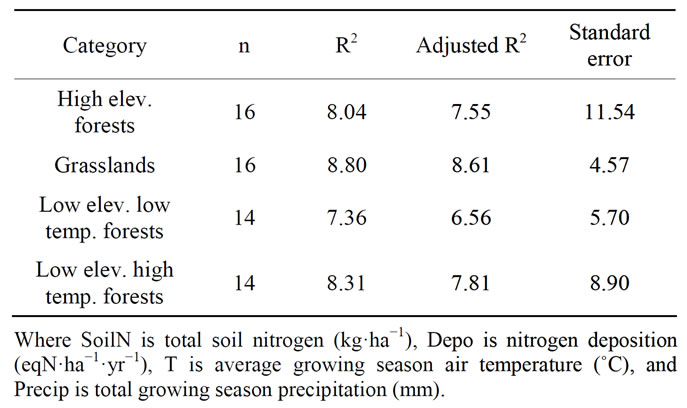
Table 3. Statistics for each data category selected for regression.
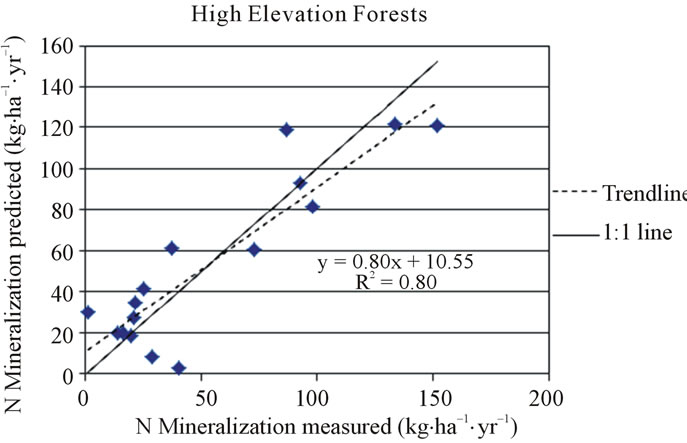
Figure 2. Measured and predicted net nitrogen mineralization in the high elevation forest category.
conducted on a site with heavy livestock grazing, possibly resulting in the fertilization of the soil. Previous studies have shown that nitrogen dynamics can be altered by long term livestock grazing [61]. Thus, this study was omitted in further calculations. The net nitrogen mineralization regression equation for grasslands had a high correlation (R2 = 0.88, adjusted R2 = 0.86, n = 16) and standard error of 4.77. The associated equation (Equation 2) was used to predict annual net nitrogen mineralization for all grassland locations included in the regression and compared to their corresponding measured values (Figure 3). The equation predicted that the Colorado validation site should have a net nitrogen mineralization rate of 12 kg·ha−1·yr−1 (vs. observed value of 16.6 kg·ha−1·yr−1) and that the Kansas site should be 22.3 kg·ha−1·yr−1 (vs. observed value of 24.5 kg·ha−1·yr−1).
 (2)
(2)
3.1.3. Low Elevation Low Temperature Forests
In the low elevation, low temperature (mean growing season temperature < 19˚C) forest category, the net nitrogen mineralization R2 was 0.74, adjusted R2 was 0.66, and S.E. was 5.70. (n = 14). The regression equation (Equation 3) was used to predict net nitrogen mineralization for all low elevation low temperature forest locations and was compared to their corresponding measurements (Figure 4). The equation was used to predict net annual nitrogen mineralization for two validation sites. The model predicted that a site in Oregon would have a net nitrogen mineralization rate of 31 kg·ha−1·yr−1 (vs. observed value of 25 kg·ha−1·yr−1) and a site in Michigan was predicted to be 71 kg·ha−1·yr−1 (vs. observed value of 93 kg·ha−1·yr−1). The validation site in Oregon could be over-predicted due to vegetation type because this site is dominated by Douglas-fir trees. Conifers in the Pacific Northwest are generally considered nitrogen poor [62,6]. The site in Michigan is possibly under-predicted due to a high amount of soil organic matter at the site. Increased soil organic matter has been shown to increase net nitrogen mineralization [63].
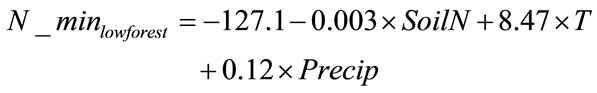 (3)
(3)
where T is average growing season air temperature (˚C)
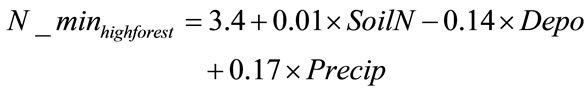
3.1.4. Low Elevation High Temperature Forests
In the low elevation, high temperature (mean growing season temperature ≥ 19˚C) forest category, the net nitrogen mineralization R2 was 0.83, adjusted R2 was 0.78, and S.E. was 8.90 (n = 12). This equation (Equation 4) was used to predict annual net nitrogen mineralization for all low elevation high temperature forest locations included in regression and was compared to their corresponding measured values (Figure 4). Validation sites in

Figure 3. Measured and predicted net nitrogen mineralization in the grassland category.
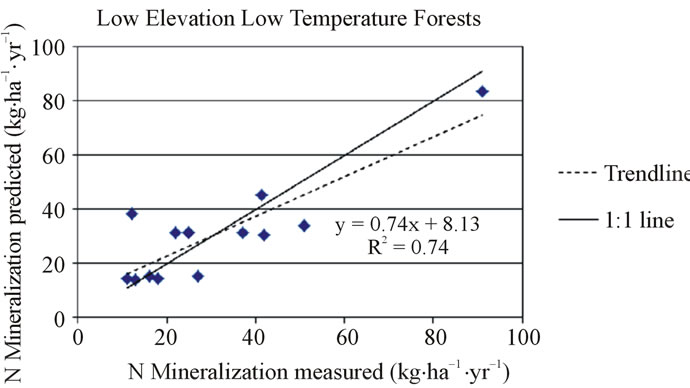 (a)
(a)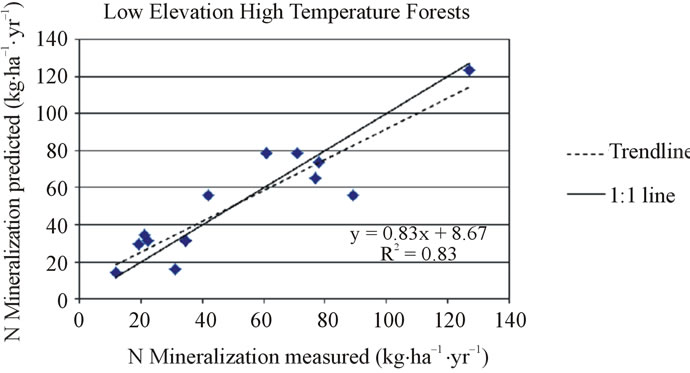 (b)
(b)
Figure 4. Measured and predicted net nitrogen mineralization in the low elevation forest category for low temperature (top) and high temperature (bottom) locations.
California and Florida were predicted to have net nitrogen mineralization rates of 24 kg·ha−1·yr−1 (vs. observed value of 31 kg·ha−1·yr−1) and 50 kg·ha−1·yr−1 (vs. observed value of 43 kg·ha−1·yr−1), respectively.
 (4)
(4)
3.2. Spatial Distribution of Net Nitrogen Mineralization
Predicted net nitrogen mineralization was the highest in the south and eastern portions of the US and the lowest in the west (Figure 5). This trend is similar to nitrogen deposition and precipitation trends (Figure 6) that increase from west to east. High temperatures (Figure 6) correlate with high net nitrogen mineralization in the southern US. The highest net nitrogen mineralization values correspond to low elevation eastern forests with high precipitation (Figure 7). Net nitrogen mineralization is the lowest in the grassland locations (Figure 8) and is consistent with low nutrient levels often found in old fields due to past agriculture practices [22]. High elevation forest areas have low predicted net nitrogen mineralization due to low air temperature and slow decomposition rates (Figure 9).
Net nitrogen mineralization is categorized by low (<50 kg·ha−1·yr−1), moderate (51 - 100 kg·ha−1·yr−1), high (101 - 150 kg·ha−1·yr−1), and very high (>151 kg·ha−1·yr−1). A large majority of grassland and high elevation forest locations have values less than 50 kg·ha−1·yr−1 (Figure 10). Both low elevation low and high temperature forest categories most often have net nitrogen mineralization rates of 50 - 100 kg·ha−1·yr−1 (Figure 11). The mean values were 14.3 kg·ha−1·yr−1 (standard deviation, σ = 2.89)
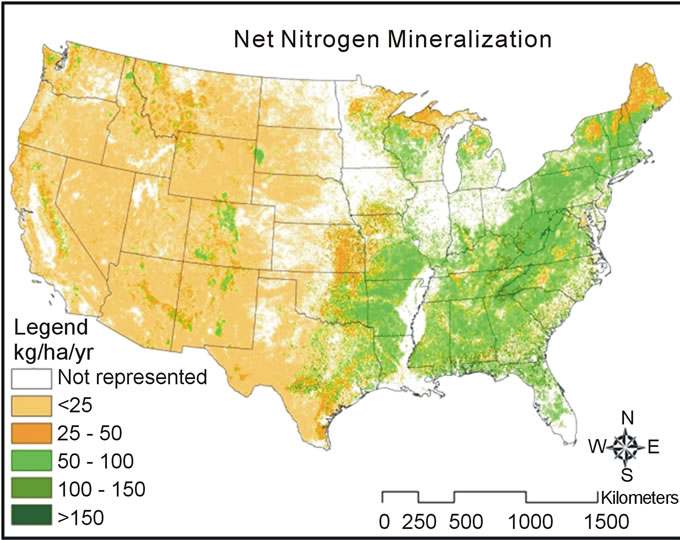
Figure 5. Map of net nitrogen mineralization created using developed equations. White areas indicate areas not included in this study (i.e., non-forest, non-grassland).

Figure 6. Air temperature (upper left), precipitation (upper right), nitrogen deposition (lower left), and total Kjeldahl nitrogen (lower right) input maps.
 (a)
(a)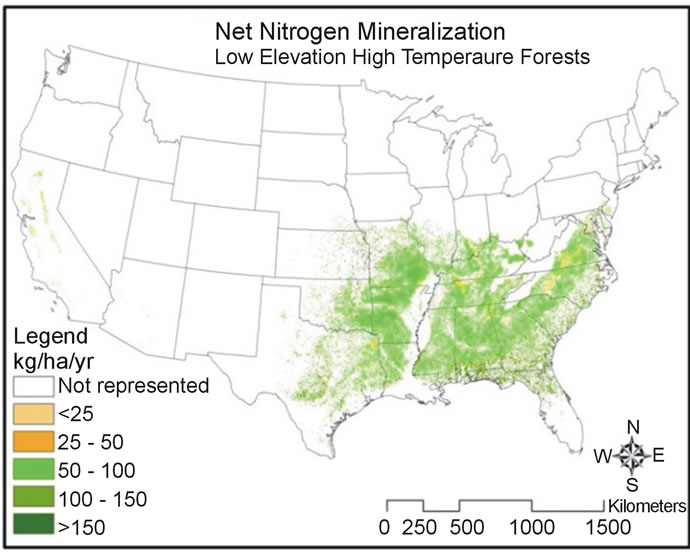 (b)
(b)
Figure 7. Map of net nitrogen mineralization for low elevation low (top) and high (bottom) temperature forests.
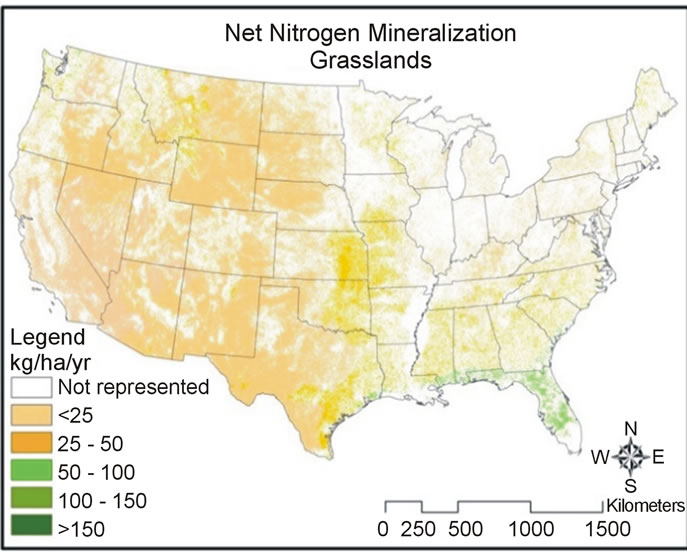
Figure 8. Map of net nitrogen mineralization for grassland locations.
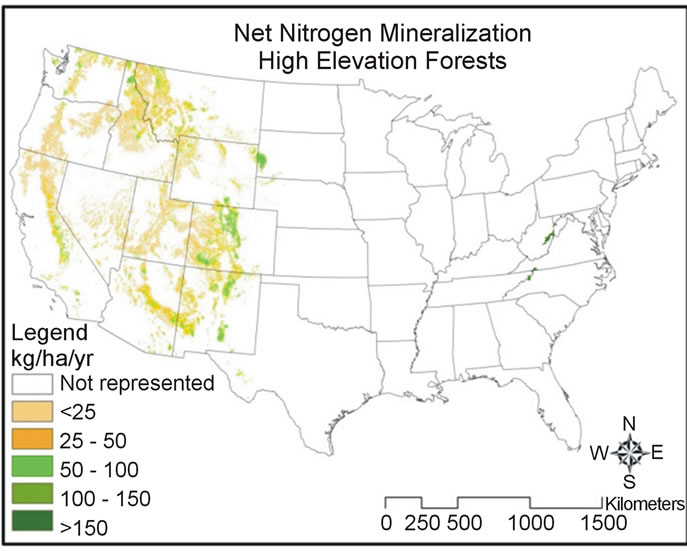
Figure 9. Map of net nitrogen mineralization for high elevation forest areas.
for the grassland category; net nitrogen mineralization was 22.6 kg·ha−1·yr−1 (σ = 4.86) for high elevation forests; net nitrogen mineralization was 58 kg·ha−1·yr−1 (σ = 3.46) for low elevation low temperature forests; and 82.9 kg·ha−1·yr−1 (σ = 7.31) for low elevation high temperature forests.
4. Discussion
Our predicted net nitrogen mineralization values correspond closely with previous modeling studies. In this study, and that of Fan et al. [16], the lowest rates observed for the Great Lakes region are in the Upper Peninsula of Michigan. Rates are also similar in Wisconsin, Illinois, Indiana, and Ohio. Our study also follows that of Burke et al. [30], with a trend of low to high nitrogen mineralization from the west to east in the Central Grassland region.
A challenge that emerged during this study was the difficulty in predicting net nitrogen mineralization for forest ecosystems. Forests differ greatly by region in soil type, input material (i.e. litter and root quality), climate, and previous land use history. Therefore, it is difficult to predict net nitrogen mineralization using a simple equation. The separation of forests by temperature was proven to be the most efficient way to account for differences between forests.
The equations and maps generated during this study were not meant to be used to predict net nitrogen mineralization at an individual site. Instead, these estimates are meant to indicate nitrogen availability at a larger spatial scale. Other factors influencing nitrogen mineralization exist but are not used in this study due to their limited availability at a continental scale. At a smaller scale (i.e., regional or watershed), other controls of net nitrogen mineralization could include soil pH, soil aeration,

Figure 10. Percentage of net nitrogen mineralization in each data category.

Figure 11. Percentage of net nitrogen mineralization for forest areas.
specific vegetation type (i.e. species), land use history (e.g., burned forest, natural growth forest), and litter quality. Soil temperature would likely be a better predictor of nitrogen availability than air temperature. This map and equations were used to predict net nitrogen mineralization for forests and grasslands; they may not be accurate for other land types, such as croplands. Extremely low rates of net nitrogen mineralization calculated for some locations may indicate a lack of representation for extreme cases (i.e., very high or low temperatures, precipitation, nitrogen deposition, or TKN) in equation development, although effort was made to represent all areas equally well.
These equations were developed under steady state conditions. A change in climate conditions could alter nitrogen availability, and such a change should be considered in future work. The model may predict high net nitrogen mineralization, but this will likely balance over a long time scale [64]. Ecosystem disturbances and stresses, such as insect invasions, drought, severe weather, and loss of vegetation reduce ecosystem health [65]. The decline of ecosystem health will slow soil processes, including net nitrogen mineralization. The equations created in this study are limited by accuracy of data used (i.e., total soil nitrogen and net nitrogen mineralization data measured in the studies, and the temperature, precipitation, and nitrogen deposition data obtained). The map is limited by the accuracy of extrapolation (i.e., TKN map, nitrogen deposition map, and temperature and precipitation data). Although the TKN map was created using 1994 soil data, it is a reasonable estimate of TKN. Total soil nitrogen (e.g., TKN) remains fairly static over time, even in nitrogen addition experiments [41] because the amount added is small relative to the bulk of organic nitrogen already present in the soil, so this map is a good estimate of net nitrogen mineralization. There is a shortage of nitrogen mineralization data measured in situ with corresponding total soil nitrogen data. To improve study results, a greater number of study sites should be included.
5. Conclusion
Our study suggests that different ecosystems have different controls on net nitrogen mineralization. Climate, vegetation type, and topographic characteristics are the three major drivers at the US continental scale. Empirical equations were developed for high elevation forests, low elevation high temperature forests, low elevation low temperature forests, and grasslands using four regionally readily available parameters (i.e., TKN, air temperature, precipitation, and nitrogen deposition) or a subset of them as predictor variables. These empirical models allowed us to extrapolate net nitrogen mineralization at a national scale. Creating a national map of net nitrogen mineralization is the first step toward considering nitrogen limitations in large scale ecosystem modeling. Future integrated regional ecosystem models are expected to be improved by including soil fertility information.
6. Acknowledgements
This work is sponsored by the National Science Foundation (NSF) Earth System Modeling Program Grant No. AGS-1049200 at NCSU. The authors wish to thank Erika Cohen for technical assistance and Bill Hargrove for providing TKN data.
REFERENCES
- E. Epstein, “Mineral Nutrition of Plants: Principles and Perspectives,” Wiley, New York, 1972.
- F. S. Chapin III, “The Mineral Nutrition of Wild Plants,” Annual Review of Ecology, Evolution, and Systematics, Vol. 11, 1980, pp. 233-260. http://dx.doi.org/10.1146/annurev.es.11.110180.001313
- G. H. Ros, E. J. M. Temminghoff and E. Hoffland, “Nitrogen Mineralization: A Review and Meta-Analysis of the Predictive Value of Soil Tests,” European Journal of Soil Science, Vol. 62, No. 1, 2011, pp. 162-173. http://dx.doi.org/10.1111/j.1365-2389.2010.01318.x
- R. Oren, D. S. Ellsworth, K. H. Johnsen, N. Phillips, B. E. Ewers, C. Maier, K. Schafer, H. McCarthy, G. Hendrey, S. G. McNulty and G. G. Katul, “Soil Fertility Limits Carbon Sequestration by Forest Ecosystems in a CO2-Enriched Atmosphere,” Nature, Vol. 411, No. 6836, 2001, pp. 469-472. http://dx.doi.org/10.1038/35078064
- J. D. Aber, K. J. Nadelhoffer, P. Steudler and J. M. Melillo, “Nitrogen Saturation in Northern Forest Ecosystems,” BioScience, Vol. 39, No. 6, 1989, pp. 378-286. http://dx.doi.org/10.2307/1311067
- M. E. Fenn, M. A. Poth, J. D. Aber, J. S. Baron, B. T. Bormann, D. W. Johnson, A. D. Lemly, S. G. McNulty, D. F. Ryan and R. Stottlemyer, “Nitrogen Excess in North American Ecosystems: Predisposing Factors, Ecosystem Responses, and Management Strategies,” Ecological Applications, Vol. 8, No. 3, 1998, pp. 706-733. http://dx.doi.org/10.1890/1051-0761(1998)008[0706:NEINAE]2.0.CO;2
- J. M. Bremner and C. S. Mulvaney, “Nitrogen-Total,” In: A. L. Page, Ed., Methods of Soil Analysis Part 2: Chemical and Microbiological Properties, 2nd Edition, Madison, Wisconsin, 1982, pp. 595-624.
- J. Pastor, J. D. Aber, C. A. McClaugherty and J. M. Melillo, “Aboveground Production and N and P Cycling along a Nitrogen Mineralization Gradient on Blackhawk Island, Wisconsin,” Ecology, Vol. 65, No. 1, 1984, pp. 256-268. http://dx.doi.org/10.2307/1939478
- K. J. Nadelhoffer, J. D. Aber and J. M. Melillo, “LeafLitter Production and Soil Organic Matter Dynamics along a Nitrogen-Availability Gradient in Southern Wisconsin (USA),” Canadian Journal of Forest Research, Vol. 13, No. 1, 1983, pp. 12-21. http://dx.doi.org/10.1139/x83-003
- R. V. O’Neill, D. L. DeAngelis, J. J. Pastor, B. J. Jackson and W. M. Post, “Multiple Nutrient Limitations in Ecological Models,” Ecological Modelling, Vol. 46, No. 3, 1989, pp. 147-163. http://dx.doi.org/10.1016/0304-3800(89)90015-X
- W. Cramer, A. Bondeau, F. I. Woodward, I. C. Prentice, R. A. Betts, V. Brovkin, P. M. Cox, V. Fisher, J. A. Foley, A. D. Friend, C. Kucharik, M. R. Lomas, N. Ramankutty, S. Sitch, B. Smith, A. White and C. Young-Molling, “Global Response of Terrestrial Ecosystem Structure and Function to CO2 and Climate Change: Results from Six Dynamic Global Vegetation Models,” Global Change Biology, Vol. 7, No. 4, 2001, pp. 357-373. http://dx.doi.org/10.1046/j.1365-2486.2001.00383.x
- C. A. Campbell, Y. W. Jame and G. E. Winkleman, “Mineralization Rate Constants and Their Use for Estimating Nitrogen Mineralization in Some Canadian Prairie Soils,” Canadian Journal of Soil Science, Vol. 64, No. 3, 1984, pp. 333-343. http://dx.doi.org/10.4141/cjss84-035
- Y. P. Wang and B. Z. Houlton, “Nitrogen Constraints on Terrestrial Carbon Uptake: Implications for the Global Carbon-Climate Feedback,” Geophysical Research Letters, Vol. 36, No. 24, 2009, Article ID: L24403. http://dx.doi.org/10.1029/2009GL041009
- Y. P. Wang, E. Kowalczyk, R. Leuning, G. Abramowitz, M. R. Raupach, B. Pak, E. van Gorsel and A. Luhar, “Diagnosing Errors in a Land Surface Model (CABLE) in the Time and Frequency Domains,” Geophysical Research Letters, Vol. 116, No. G1, 2011, Article ID: G01034. http://dx.doi.org/10.1029/2010JG001385
- S. Piao, S. Sitch, P. Ciais, P. Friedlingstein, P. Peylin, X. Wang, et al., “Evaluation of Terrestrial Carbon Cycle Models for Their Response to Climate Variability and to CO2 Trends,” Global Change Biology, Vol. 19, No. 7, 2013, pp. 2117-2132. http://dx.doi.org/10.1111/gcb.12187
- W. Fan, J. C. Randolph and J. L. Ehman, “Regional Estimation of Nitrogen Mineralization in Forest Ecosystems Using Geographic Information Systems,” Ecological Applications, Vol. 8, No. 3, 1998, pp. 734-747. http://dx.doi.org/10.1890/1051-0761(1998)008[0734:REONMI]2.0.CO;2
- D. Binkley and S. C. Hart, “The Components of Nitrogen Availability Assessments in Forest Soils,” Advances in Soil Sciences, Vol. 10, 1989, 57-112. http://dx.doi.org/10.1007/978-1-4613-8847-0_2
- M. J. Swift, O. W. Heal and J. M. Anderson, “Decomposition in Terrestrial Ecosystems,” University of California Press, Berkeley, 1979.
- R. F. Powers, “Nitrogen Mineralization along an Altitudinal Gradient: Interactions of Soil Temperature, Moisture, and Substrate Quality,” Forest Ecology and Management, Vol. 30, No. 1-4, 1990, pp. 19-29. http://dx.doi.org/10.1016/0378-1127(90)90123-S
- J. D. Knoepp and W. T. Swank, “Using Soil Temperature and Moisture to Predict Forest Soil Nitrogen Mineralization,” Biology and Fertility of Soils, Vol. 36, No. 3, 2002, pp. 177-182. http://dx.doi.org/10.1007/s00374-002-0536-7
- J. Lloyd and J. A. Taylor, “On the Temperature Dependence of Soil Respiration,” Functional Ecology, Vol. 8, No. 3, 1994, pp. 315-323. http://dx.doi.org/10.2307/2389824
- K. Vlassak, “Total Soil Nitrogen and Nitrogen Mineralization,” Plant and Soil, Vol. 32, No. 1, 1970, pp. 27-32. http://dx.doi.org/10.1007/BF01372843
- J. Pastor, M. A. Stillwell and D. Tilman, “Nitrogen Mineralization and Nitrification in Four Minnesota Old Fields,” Oecologia, Vol. 71, No. 4, 1987, pp. 481-485. http://dx.doi.org/10.1007/BF00379285
- S. G. McNulty, J. D. Aber, T. M. McLellan and S. M. Katt, “Nitrogen Cycling in High Elevation Forests of the Northeastern US in Relation to Nitrogen Deposition,” Ambio, Vol. 19, No. 1, 1990, pp. 38-40.
- D. W. Schindler and S. E. Bayley, “The Biosphere as an Increasing Sink for Atmospheric Carbon: Estimates from Increased Nitrogen Deposition,” Global Biogeochemical Cycles, Vol. 7, No. 4, 1993, pp. 717-733. http://dx.doi.org/10.1029/93GB02562
- D. W. Cole and M. Rapp, “Elemental Cycling in Forest Ecosystems,” In: D. E. Reichle, Ed., Dynamic Properties of Forest Ecosystems, Cambridge University Press, New York, 1981, pp. 301-409.
- G. Stanford, J. N. Carter and S. J. Smith, “Estimates of Potentially Mineralizable Soil Nitrogen Based on ShortTerm Incubations,” Proceedings—Soil Science Society of America, Vol. 38, No. 1, 1974, pp. 99-102. http://dx.doi.org/10.2136/sssaj1974.03615995003800010031x
- Z. Dou, J. D. Toth, J. D. Jabro, R. H. Fox and D. D. Fritton, “Soil Nitrogen Mineralization during Laboratory Incubation: Dynamics and Model Fitting,” Soil Biology and Biochemistry, Vol. 28, No. 4, 1996, pp. 625-632. http://dx.doi.org/10.1016/0038-0717(95)00184-0
- D. Hope, W. Zhu, C. Gries, J. Oleson, J. Kayne, N. B. Grimm and L. A. Baker, “Spatial Variation in Soil Inorganic Nitrogen across an Arid Urban Ecosystem,” Urban Ecosystems, Vol. 8, No. 3-4, 2005, pp. 251-273. http://dx.doi.org/10.1007/s11252-005-3261-9
- I. C. Burke, W. K. Lauenroth and W. J. Parton, “Regional and Temporal Variation in Net Primary Production and Nitrogen Mineralization in Grasslands,” Ecology, Vol. 78, No. 5, 1997, pp. 1330-1340. http://dx.doi.org/10.1890/0012-9658(1997)078[1330:RATVIN]2.0.CO;2
- H. Dou, A. K. Alva and B. R. Khakural, “Nitrogen Mineralization from Citrus Tree Residues under Different Production Conditions,” Soil Science Society of America Journal, Vol. 61, No. 4, 1997, pp. 1226-1232. http://dx.doi.org/10.2136/sssaj1997.03615995006100040031x
- M. C. Fisk and S. K. Schmidt, “Nitrogen Mineralization and Microbial Biomass Nitrogen Dynamics in Three Alpine Tundra Communities,” Soil Science Society of America Journal, Vol. 59, No. 4, 1995, pp. 1036-1043. http://dx.doi.org/10.2136/sssaj1995.03615995005900040012x
- M. C. Fisk, D. R. Zak and T. R. Crow, “Nitrogen Storage and Cycling in Oldand Second-Growth Northern Hardwood Forests,” Ecology, Vol. 83, No. 1, 2002, pp. 73-87. http://dx.doi.org/10.1890/0012-9658(2002)083[0073:NSACIO]2.0.CO;2
- D. W. Frazer, J. G. McColl and R. F. Powers, “Soil Nitrogen Mineralization in a Clearcutting Chronosequence in a Northern California Conifer Forest,” Soil Science Society of America Journal, Vol. 54, No. 4, 1990, pp. 1145- 1152. http://dx.doi.org/10.2136/sssaj1990.03615995005400040038x
- F. S. Gilliam, M. B. Adams and B. M. Yurish, “Ecosystem Nutrient Responses to Chronic Nitrogen Inputs at Fernow Experimental Forest, West Virginia,” Canadian Journal of Forest Research, Vol. 26, No. 2, 1996, pp. 196-205. http://dx.doi.org/10.1139/x26-023
- K. C. Grady and S. C. Hart, “Influences of Thinning, Prescribed Burning, and Wildfire on Soil Processes and Properties in Southwestern Ponderosa Pine Forests: A Retrospective Study,” Forest Ecology and Management, Vol. 234, No. 1-3, 2006, pp. 123-135. http://dx.doi.org/10.1016/j.foreco.2006.06.031
- P. M. Groffman, R. V. Pouyat, M. L. Cadenasso, W. C. Zipperer, K. Szlavecz, I. D. Yesilonis, L. E. Band and G. S. Brush, “Land Use Context and Natural Soil Controls on Plant Community Composition and Soil Nitrogen and Carbon Dynamics in Urban and Rural Forests,” Forest Ecology and Management, Vol. 236, No. 2-3, 2006, pp. 177-192. http://dx.doi.org/10.1016/j.foreco.2006.09.002
- K. A. Hibbard, S. Archer, D. S. Schimel and D. W. Valentine, “Biogeochemical Changes Accompanying Woody Plant Encroachment in a Subtropical Savanna,” Ecology, Vol. 82, No. 7, 2001, pp. 1999-2011. http://dx.doi.org/10.1890/0012-9658(2001)082[1999:BCAWPE]2.0.CO;2
- A. B. Joshi, D. R. Vann, A. H. Johnson and E. K. Miller, “Nitrogen Availability and Forest Productivity along a Climosequence on Whiteface Mountain, New York,” Canadian Journal of Forest Research, Vol. 33, No. 10, 2003, pp. 1880-1891. http://dx.doi.org/10.1139/x03-105
- R. L. McCulley, I. C. Burke and W. K. Lauenroth, “Conservation of Nitrogen Increases with Precipitation across a Major Grassland Gradient in the Central Great Plains of North America,” Oecologia, Vol. 159, No. 3, 2009, pp. 571-581. http://dx.doi.org/10.1007/s00442-008-1229-1
- S. G. McNulty and J. D. Aber, “Effects of Chronic Nitrogen Additions on Nitrogen Cycling in a High-Elevation Spruce-Fir Stand,” Canadian Journal of Forest Research, Vol. 23, No. 7, 1993, pp. 1252-1263. http://dx.doi.org/10.1139/x93-160
- S. S. Perakis and E. R. Sinkhorn, “Biogeochemistry of a Temperate Forest Nitrogen Gradient,” Ecology, Vol. 92, No. 7, 2011, pp. 1481-1491. http://dx.doi.org/10.1890/10-1642.1
- K. B. Piatek and H. L. Allen, “Nitrogen Mineralization in a Pine Plantation Fifteen Years after Harvesting and Site Preparation,” Soil Science Society of America Journal, Vol. 63, No. 4, 1999, pp. 990-998. http://dx.doi.org/10.2136/sssaj1999.634990x
- L. E. Rustad, J. L. Campbell, G. M. Marion, R. J. Norby, M. J. Mitchell, A. E. Hartley, J. H. C. Cornelissen and J. Gurevitch, “A Meta-Analysis of the Response of Soil Respiration, Net Nitrogen Mineralization, and Aboveground Plant Growth to Experimental Ecosystem Warming,” Oecologia, Vol. 126, No. 4, 2001, pp. 543-562. http://dx.doi.org/10.1007/s004420000544
- R. H. Strader, D. Binkley and C. G. Wells, “Nitrogen Mineralization in High Elevation Forests of the Appalachians. I. Regional Patterns in Southern Spruce-Fir Forests,” Biogeochemistry, Vol. 7, No. 2, 1989, pp. 131-145. http://dx.doi.org/10.1007/BF00004125
- C. F. Eno, “Nitrate Production in the Field by Incubating the Soil in Polyethylene Bags,” Soil Science Society of America Journal, Vol. 24, No. 4, 1960, pp. 277-279. http://dx.doi.org/10.2136/sssaj1960.03615995002400040019x
- J. F. DiStefano and H. L. Gholz, “A Proposed Use of Ion Exchange Resins to Measure Nitrogen Mineralization and Nitrification in Intact Soil Cores,” Communications in Soil Science & Plant Analysis, Vol. 17, No. 9, 1986, pp. 989-998. http://dx.doi.org/10.1080/00103628609367767
- D. Binkley, J. Aber, J. Pastor and K. Nadelhoffer, “Nitrogen Availability in Some Wisconsin Forests: Comparisons of Resin Bags and On-Site Incubations,” Biology and Fertility of Soils, Vol. 2, No. 2, 1986, pp. 77-82. http://dx.doi.org/10.1007/BF00257583
- X. Zou, D. W. Valentine, R. L. Sanford Jr. and D. Binkley, “Resin-Core and Buried-Bag Estimates of Nitrogen Transformations in Costa Rican Lowland Rainforests,” Plant and Soil, Vol. 139, No. 2, 1992, pp. 275-283. http://dx.doi.org/10.1007/BF00009319
- D. Binkley, R. Bell and P. Sollins, “Comparison of Methods for Estimating Soil Nitrogen Transformations in Adjacent Conifer and Alder-Conifer Forests,” Canadian Journal of Forest Research, Vol. 22, No. 6, 1992, pp. 858-863. http://dx.doi.org/10.1139/x92-115
- N. A. Scott and D. Binkley, “Foliage Litter Quality and Annual Net N Mineralization: Comparison across North American Forest Sites,” Oecologia, Vol. 111, No. 2, 1997, pp. 151-159. http://dx.doi.org/10.1007/s004420050219
- M. Unkovich, D. Herridge, M. Peoples, G. Cadisch, B. Boddey, K. Giller, B. Alves and P. Chalk, “Analysis of Nitrogen,” Measuring Plant-Associated Nitrogen Fixation in Agricultural Systems, Australian Centre for International Agricultural Research (ACIAR), Canberra, 2008, pp. 45-84.
- S. G. McNulty, E. C. Cohen, J. A. Moore Myers, T. J. Sullivan and H. Li, “Estimates of Critical Acid Loads and Exceedances for Forest Soils across the Conterminous United States,” Environmental Pollution, Vol. 149, No. 3, 2007, pp. 281-292. http://dx.doi.org/10.1016/j.envpol.2007.05.025
- J. W. Grimm and J. A. Lynch, “Enhanced Wet Deposition Estimates Using Modeled Precipitation Inputs,” Environmental Monitoring and Assessment, Vol. 90, No. 1, 2004, pp. 243-268. http://dx.doi.org/10.1023/B:EMAS.0000003592.56006.a0
- Illinois State Water Survey NADP Program Office, “National Atmospheric Deposition Program (NADP) (NRSP- 3),” Illinois State Water Survey NADP Program Office, Champaign, 2005.
- US Environmental Protection Agency (EPA), “Clean Air Markets: Data and Maps,” 2007. http://cfpub.epa.gov/gdm/index.cfm?fuseaction=aciddeposition.wizard
- R. H. Waring and W. H. Schlesinger, “Forest Ecosystems: Concepts and Management,” Academic Press, Orlando, 1985.
- W. W. Hargrove and F. M. Hoffman, “A Flux Atlas for Representativeness and Statistical Extrapolation of the AmeriFlux Network,” ORNL Technical Memorandum ORNL/TM-2004/112, Oak Ridge National Laboratory, Oak Ridge, 2004, p. 37.
- J. Fry, G. Xian, S. Jin, J. Dewitz, C. Homer, L. Yang, C. Barnes, N. Herold and J. Wickham, “Completion of the 2006 National Land Cover Database for the Conterminous United States,” Photogrammetric Engineering and Remote Sensing, Vol. 77, No. 9, 2011, pp. 858-864.
- P. Fisher and J. Wood, “What Is a Mountain? Or the Englishman Who Went up a Boolean Geographical Concept But Realised It Was Fuzzy,” Geography, Vol. 83, No. 3, 1998, pp. 247-256.
- J. M. Welker, J. T. Fahnestock, K. L. Povirk, C. J. Bilbrough and R. E. Piper, “Alpine Grassland CO2 Exchange and Nitrogen Cycling: Grazing History Effects, Medicine Bow Range, Wyoming, USA,” Arctic, Antarctic, and Alpine Research, Vol. 36, No. 1, 2004, pp. 11-20. http://dx.doi.org/10.1657/1523-0430(2004)036[0011:AGCEAN]2.0.CO;2
- P. Sollins, C. C. Grier, F. M. McCorison, K. Cromack Jr., R. Fogel and R. L. Fredriksen, “The Internal Element Cycles of an Old-Growth Douglas-Fir Ecosystem in Western Oregon,” Ecological Monographs, Vol. 50, No. 3, 1980, pp. 261-285. http://dx.doi.org/10.2307/2937252
- F. Berendse, “Organic Matter Accumulation and Nitrogen Mineralization during Secondary Succession in Heathland Ecosystems,” Journal of Ecology, Vol. 78, No. 2, 1990, pp. 413-427. http://dx.doi.org/10.2307/2261121
- P. M. Vitousek and W. A. Reiners, “Ecosystem Succession and Nutrient Retention: A Hypothesis,” BioScience, Vol. 25, No. 6, 1975, pp. 376-381. http://dx.doi.org/10.2307/1297148
- S. G. McNulty and J. L. Boggs, “A Conceptual Framework: Redefining Forest Soil’s Critical Acid Loads under a Changing Climate,” Environmental Pollution, Vol. 158, No. 6, 2010, pp. 2053-2058. http://dx.doi.org/10.1016/j.envpol.2009.11.028
NOTES
*Corresponding author.