International Journal of Geosciences
Vol. 4 No. 3 (2013) , Article ID: 31762 , 7 pages DOI:10.4236/ijg.2013.43056
A Comparison of MODIS LST Retrievals with in Situ Observations from AWS over the Lambert Glacier Basin, East Antarctica
1Shandong Provincial Key Laboratory of Marine Ecological Restoration, Shandong Marine Fisheries Research Institute, Yantai, China
2State Key Laboratory of Cryospheric Science, Cold and Arid Regions Environmental and Engineering Research Institute, CAS, Lanzhou, China
Email: wangyetang@163.com
Copyright © 2013 Yetang Wang et al. This is an open access article distributed under the Creative Commons Attribution License, which permits unrestricted use, distribution, and reproduction in any medium, provided the original work is properly cited.
Received January 18, 2013; revised February 23, 2013; accepted March 22, 2013
Keywords: MODIS; LST; Air Temperature; AWS
ABSTRACT
Satellite-derived surface temperature data is increasingly required to supplement the limited weather stations for the assessment of temperature trend over the data-sparse Antarctic Ice Sheet. To accomplish this, it is essential to assess the relationship and difference between satellite-based land-surface temperature (LST) retrieval and air temperature observation. In this study, we made a comparison between monthly averaged LST from Moderate Resolution Imaging Spectroradiometer (MODIS) and the corresponding air temperature at the nominal heights of 1 m and 2 m from automatic weather stations (AWSs) over the Lambert Glacier basin, East Antarctica. This comparison reveals a statistically significant correlation between the two types of temperature measurements with correlation coefficient (R) above 0.6. Also, the time difference between satellite overpass and air temperature observation is not critical for the R values. Although MODIS LST evidently deviates from air temperature (Mean difference fluctuates from 2.87˚C to 8.08˚C) probably due to the temperature inversion effect, heterogeneity in surface emissivity, representative of AWS measurements and satellite self limitation. MODIS LST measurements have a great potential for the accurate evaluation or monitoring of regional air temperature over Antarctica, and thus better improve current reconstruction of spatial and temporal reconstruction variability in Antarctic temperature.
1. Introduction
Antarctic Ice Sheet plays an important role in the global climate and has large potential contributions to sea level rise. It is of importance to evaluate Antarctic near-surface temperature changes to better understand the Antarctic Ice Sheet mass balance and Antarctic climate change in response to global warming. There are only 16 meteorological stations located mainly along the coast with continuous weather records since the 1957/58 Internal International Geophysical Year (IGY), which may result in considerable uncertainties for the assessment of climate changes over inland Antarctica. To improve the spatial coverage of weather observations, more than 100 Automatic Weather Stations (AWSs) were installed [1-3]. However, limited climate information in Antarctic interior can be captured due to the considerable regions still undocumented by weather observation. Despite substantial improvement in assimilation skills of atmospheric models, the widely used reanalysis data have artificiality over Antarctica, especially over East Antarctic Plateau [4]. Additionally, the previous statistical reconstruction of air temperature may have large errors due to the few in situ observations available and large seasonal and inter-annual variability in regional air temperature [5,6]. As a result, knowledge of change trends in Antarctic air temperature at continental scale remain challenged by the sparseness and short duration of observations and the spatial heterogeneity of air temperature variations. Therefore, much attention have been paid to employ remote sensing-based land surface temperature (LST) either as a substitution or in combination with more spatially limited near-surface air temperature observations to improve the assessment and reconstruction of Antarctic air surface temperature spatial and temporal variability [7-11]. Sat ellite-derived LST is also useful for climate simulation, hydrologic, ecological and biogeochemical studies.
LST derived from NOAA AVHRR and SSM/I satellites have been used to detect Antarctic temperature variability and trends [7-9], and snow melt [12,13]. More recently, there has been a rapid increase in the needs of LST products derived from the Moderate Resolution Imaging Spectroradiometer (MODIS) for many fields such as quantifications of heat waves [14], forest cover change [15], assessment of air temperature [16], hazard prediction and mitigation [17], water resource management, and improvement of weather forecast [18]. Validated attempts have been therefore made through either surface emissivity spectra measurements or in situ temperature observations over lakes [19-22], cropland [23- 25], bare soil [26], silt-playa [20], densely vegetated areas [21], snow and ice surface [27] and permafrost region [28,29] to better understand the uncertainties and limitations of MODIS-derived LST. Yet these comparisons/ validations of MODIS LST products focus on midand low-latitude regions. At high latitude regions, especially Antarctica, there are still few reports on validation/comparison of multiple snow and ice LSTs derived from the various EOS standard products with temperature observations.
In this work, our main objective is to quantify the relationship and difference between LST values from MODIS Monthly averaged Land Surface Temperature Product created by Wan et al. [22] and near-surface air temperature from AWSs over the Lambert Glacier basin.
2. Study Area
The Lambert Glacier basin is located in a deep rift valley between the Prince Charles Mountains and Mawson Escarpment in East Antarctica and comprises the largest outlet ice stream system of the Antarctic Ice Sheet, covering an area of more than 1.5 × 10⁶ km2. It consists of Lambert Glacier, Amery Ice Shelf and upstream area (Figure 1). Lambert Glacier is the largest and longest valley glacier in the world and flows at the velocities ranging from 0.5 m∙a−1 to 63 m∙a−1 [30], having important implications for the studies on the Antarctic Ice Sheet movement and its response to climate changes. The area of the Amery Ice Shelf reaches about 71,260 km2 [31], which is the largest ice shelf in East Antarctica. The grounded ice from the basin interior converges into the Lambert Glacier and then drains across Amery Ice Shelf through 1.7% of the coastline. The drained ice accounts about 16% of the area of the grounded ice in East Antarctic Ice Sheet [31], which make the glacier basin very sensitive to East Antarctic ice mass balance changes.
Chinese and Australian studies on Antarctic glaciology and climatology have long focused on the Lambert Gla-
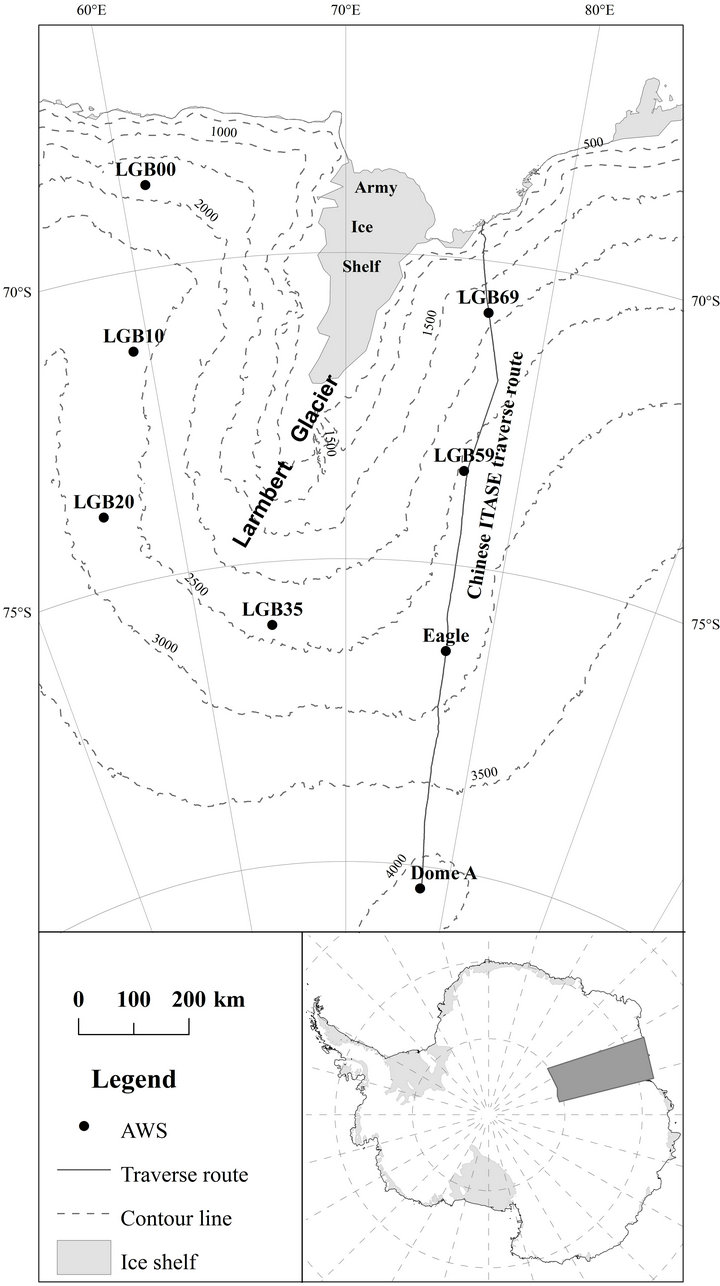
Figure 1. Location map of the Lambert Glacier Basin and AWSs.
cier basin. Many scientific traverses have been carried out to investigate ice characteristics, dynamics, mass balance, and regional climatology. For understanding of atmospheric processes in this region, a series of AWSs were deployed by Australian Antarctic Division since the late 1980s and early 1990s. Along the transverse line between Zhongshan Station and Dome Argus, another AWSs were also installed during the 18th and 21st Chinese Antarctic Research Expeditions (CHINARE) performed in 2001/02 austral summer and 2004/2005 austral summer, respectively. All stations provide the measurements of air temperature, atmospheric pressure, and wind speed and direction. Some stations measure atmospheric humidity, solar radiation, and snow temperature at measuring snow temperature at different depths of 10 cm, 1 m, 3 m and 10 m below snow surface, and provide near surface air temperature vertical gradients through the sensors at the nominal heights of 1, 2 and 4 m above the snow surface.
3. Data and Methods
The V5 level 3 MODIS/Terra Monthly Global Climate Modeling Grid (CMG) LST data (MOD11C3) was obtained from Land Processes Distributed Active Center (LPDAC) of NASA Earth Observing System Data and Information System (EOSDIS). MOD11C3 provides monthly composited average LST values from the MOD11C1 product with clear-sky condition at a 0.05˚ × 0.05˚ spatial resolution. Each cloud free grid box of MOD11C3 provides a daytime and nighttime pass LST through a certain quality control. The primary source of the LST data in the series of MOD11C products is retrieved by the day/ night LST algorithm using thermal infrared bands. Compared to MODIS collection 4 LST products, the quality and accuracy of collection 5 LST products are highly improved by the important refinements of MODIS day/ night LST algorithm [21].
We collected near surface air temperature data over Lambert Glacier Basin from a network of automatic weather stations operated by the Australian Antarctic Division Glaciology Program. Table 1 shows the characteristics of each site for near-surface air temperature measurements. Each AWS measures air temperature using the thermistors mounted at the nominal heights of 1 m, 2 m and 4 m. Hourly averaged data are relayed through AR GOS system via the World Meteorological Organisation’s Global Telecommunication System. These data can be processed to daily and monthly averaged values when necessary.
Statistical parameters including the correlation coefficient (R), the mean difference (MD) and the standard deviation (SD) were employed to the investigation of the relationship between MOD11C3 LST and the corresponding AWS air temperature measurements. R is a variation which can measure the co-variation in time of the two types of temperature measurements. If MD amounts to zero, the average of LST is equivalent to the average of air temperature. SD shows how much variation exists from the average.
4. Results and Discussion
MOD11C3 LST presents strong correlation with air temperature at the heights of 1 m and 2 m with very similar seasonal variation patterns over Lambert Glacier basin (Figure 2, Tables 2 and 3). In spite of the time difference between satellite overpass and air temperature observation, there is no significant difference of R values between air temperature and LSTs from the daytime mean and the nighttime mean. However, the relationship between the two sets of temperature measurements spatially varies with the locations of AWS.
Monthly averaged daytime LST are consistent with
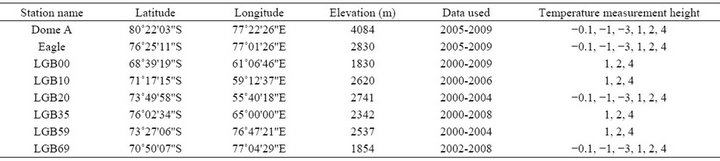
Table 1. Characteristics of meteorological stations.
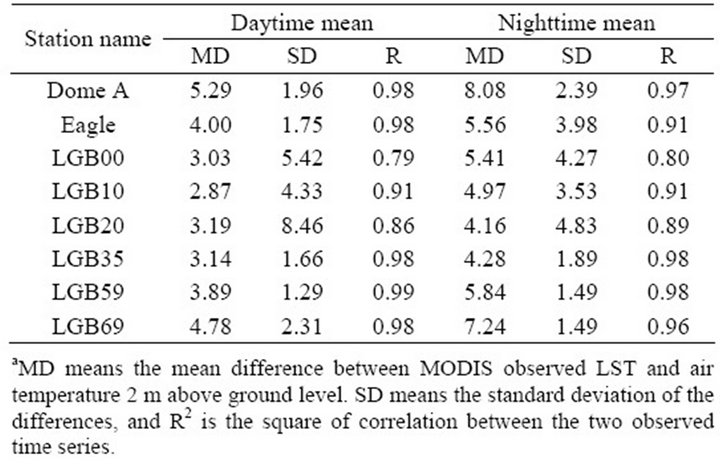
Table 2. A comparison of MODIS observed LST with air temperature 2 m above ground level from AWSa.
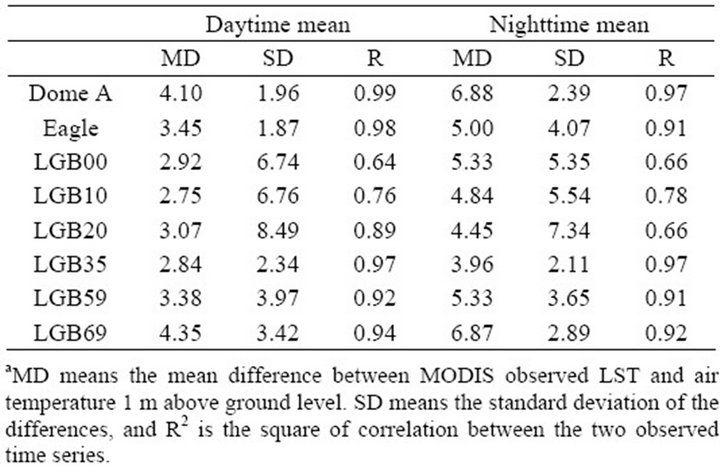
Table 3. A comparison of MODIS observed LST with air temperature 1 m above ground level from AWSa.
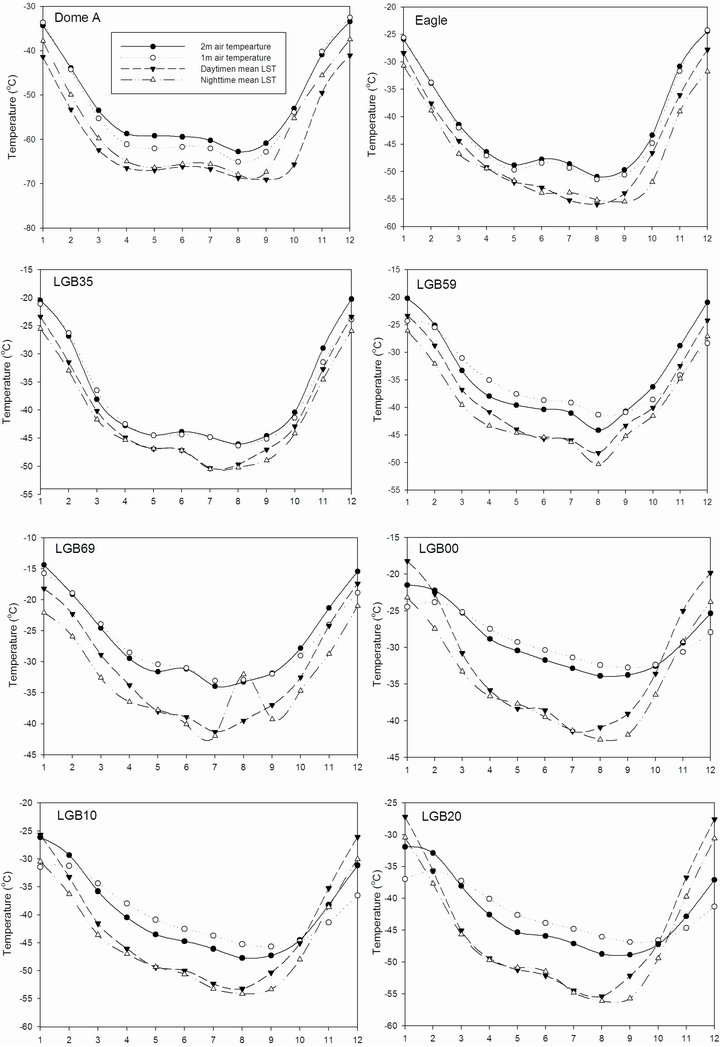
Figure 2. Comparison of daytime mean and nighttime mean LST derived from MODIS with 1 m and 2 m air temperature observation.
corresponding in situ 2 m monthly air temperatures from AWS over the East Lambert Glacier basin, with the correlation coefficient (R) near 1, and standard deviation (SD) below 2.5˚C (Table 2). When compared to the East Lambert Glacier basin, the West Lambert Glacier basin indicates a relatively weak relationship between the two types of temperature measurements with the values of R from 0.79 to 0.91, and SD between 4.33˚C and 8.46˚C (Table 2). Mean difference (MD) between the two types of temperature observations varies from 2.87˚C to 5.29˚C. The comparisons of nighttime mean monthly LST and the corresponding 2 m monthly air temperature measurement yield R values from 0.80 to 0.99, and SD between 1.49˚C and 4.27˚C, while MD values are generally larger than those for daytime mean.
Table 3 shows the comparison between MODIS observed LST and 1 m air temperature measurements from AWS. The correspondence between the MODIS daytime LST and air temperatures from AWS is strong for the East Lambert Glacier basin with the values of R ranging from 0.92 to 0.99, but is relatively weak for the West Lambert Glacier basin with the R values between 0.64 and 0.89. SD values is quite high (6.74˚C to 8.49˚C) in the West Lambert Glacier basin, while they are low (1.87˚C to 3.97˚C) in the East Lambert Glacier basin. The correlation between MODIS LST and 1m air temperature for nighttime mean is almost comparative to those for daytime mean, with R values from 0.66 to 0.97, and SD values from 2.11˚C to 7.34˚C.
The strong correlation between the two types of temperature measurements over Lambert Glacier basin implies that this LST product is robust and accurate for the estimation of spatiotemporal pattern of Antarctic regional monthly averaged air temperature. AHHRR satellitebased LST has been used to assist in Antarctic air temperature statistical reconstruction [10]. However, the accuracy of reconstruction is very limited at regional scales [10]. MODIS-derived LST provides potential improvement for the spatial and temporal air temperature reconstruction over Antarctica due to its robust agreement with regional air temperature. MODIS LST based air temperature estimate has been reported in other regions. Vancutsem et al. [32] used MODIS data to assess weekly minimum and maximum air temperatures in different ecosystems over Africa. Over the state of Mississippi, USA, Mostovoy et al. [33] evaluated daily maximum and minimum air temperatures from MODIS LST products. Zaksek and Schroedter-Homscheidt [34] assessed 2 m air temperature based on MODIS LST data for Slovenia, the French region and southern Germany. Spatial and temporal variability in air surface temperature in Portugal was also estimated using MODIS LST data [16].
Despite the robust correlation between LST and air temperature, MODIS daytime and nighttime mean LSTs are slower than air temperature at the heights of 1 m and 2 m. MD between monthly averaged LST values and the corresponding air temperature fluctuates from 2.87˚C to 8.08˚C. Furthermore, relative to air temperature mean, daytime mean LST has a higher average than nighttime mean LST. Over Antarctica, the temperature inversion exists due to inequality in emissivities of snow surface and atmosphere [35,36]. Significant temperature gradients in the low atmosphere linked to the inversion may contribute more to the lower MODIS-based surface temperature than air temperature from AWS measurements. AWS point observation may not always represent the temperature over a MODIS pixel (about 5.6 × 5.6 km2) due to the surface roughness and some shadowing. In addition, the monthly averaged MODIS LSTs were derived from only cloud-free data owing to its inability to precisely observe LST through cloud cover or fog. When storms and blizzards take place over the Antarctic ice sheet and nearsurface temperatures vary significantly.
5. Conclusions
The comparison between MODIS LST retrievals and in situ near-surface air temperature observations gives some helpful understanding of the remotely sensed data. Despite the difference in spatial scales, the monthly averaged MODIS LSTs were strongly correlated with monthly air temperature measurements. Through the linear regression of the robust relationship between the two sets of temperature measurements, gridded air temperature can be estimated for future climate change studies and application in the high resolution regional climate modes.
The deviation between the two types of temperature measurements may be dependent on many effects including temperature inversion, heterogeneity in surface emissivity, representative of point measurements, MODIS LST error, and satellite-self limitation (e.g., cloud contamination). Spatial and temporal in situ ground and radiation-based LST measurements over Antarctica are therefore urgently needed to quantify the uncertainties in LST retrieval. The revised algorithm in the processing V6 MODIS might have improved cloud clearing. Other instruments which have been launched and are going to be launched may provide LST measurements or products. It is very likely to determine LST by means of multiple instruments.
6. Acknowledgements
This study is funded by the Natural Science Foundation of China (41206175 and 41176165), State Key Laboratory of Cryospheric Science, Cold and Arid Regions Environmental and Engineering Research Institute, CAS (SKLCS-2012-08), the State Oceanic Administration (CHINARE2012-02-02), and Taishan Scholar Position (TS200651036).
REFERENCES
- C. R. Savage, “Automatic Weather Station 1980-1981,” Antarctic Journal of the United States, Vol. 42, No. 5, 1981, pp. 56-62.
- I. Allison, “Automatic Weather Stations in the Antarctic,” Austral Meteorology Magazine, Vol. 31, No. 6, 1983, pp. 71-76.
- C. H. Rejimer, “Antarctic Meteorology: A study with Automatic Weather Stations,” Ph.D. Thesis, Utrecht University, Utrecht, 2001.
- D. H. Bromwich and R. L. Fogt, “Strong Trends in the Skill of the ERA-40 and NCEPNCAR Reanalyses in the High and Midlatitudes of the Southern Hemisphere, 1958- 2001,” Journal of Climate, Vol. 17, No. 23, 2004, pp. 4603- 4619. doi:10.1175/3241.1
- S. Rutherford, M. E. Mann, T. J. Osborn, K. R. Briffa, P. D. Jones, R. S. Bradley and M. K. Hughes. “Proxy-Based Northern Hemisphere Surface Temperature Reconstructions: Sensitivity to Methodology, Predictor Network, Target Season and Target Domain,” Journal of Climate, Vol. 18, No. 13, 2005, pp. 2308-2329. doi:10.1175/JCLI3351.1
- M. E. Mann, S. Rutherford, E. Wahl and C. Ammann. “Robustness of Proxy-based Climate Field Reconstruction Methods,” Journal Geophysical Research, Vol. 112, No. D12, 2007, Article ID: D12109. doi:10.1029/2006JD008272
- J. C. Comiso, “Variability and Trends in Antarctic Surface Temperatures from in Situ and Satellite Infrared Measurements,” Journal of Climate, Vol. 13, No. 10, 2000, pp. 1674-1696. doi:10.1175/1520-0442(2000)013<1674:VATIAS>2.0.CO;2
- R. Kwok and J. C. Comiso, “Spatial Patterns of Variability in Antarctic Surface Temperature: Connections to the Southern Hemisphere Annular Mode and the Southern Oscillation,” Geophysical Research Letters, Vol. 29, No. 14, 2002, pp. 30-33. doi:10.1029/2002GL015415
- D. P. Schneider, E. J. Steig and J. Comiso, “Recent Climate Variability in Antarctica from Satellite-Derived Temperature Data,” Journal of Climate, Vol. 17, No. 7, 2004, pp. 1569-1583. doi:10.1175/1520-0442(2004)017<1569:RCVIAF>2.0.CO;2
- E. J. Steig, D. P. Schneider, S. D. Rutherford, M. E. Mann, J. C. Comiso and D. T. Shindell, “Warming of the Antarctic Ice-Sheet Surface since the 1957 International Geophysical Year,” Nature, Vol. 457, No. 7228, 2009, pp. 459- 463. doi:10.1038/nature07669
- A. J. Monaghan, D. H. Bromwich, W. Chapman and J. C. Comiso, “Recent Variability and Trends of Antarctic near Surface Temperature,” Journal of Geophysical Research, Vol. 113, Vol. 457, No. D4, 2008, Article ID: D04105. doi:10.1029/2007JD009094
- H. Liu, L. Wang and K. C. Jezek, “Spatiotemporal Variations of Snowmelt in Antarctica Derived from Satellite Scanning Multichannel Microwave Radiometer and Special Sensor Microwave Imager data (1978-2004),” Journal of Geophysical Research, Vol. 111, No. F1, 2006, Article ID: F01003. doi:10.1029/2005JF000318
- P. K. Meijgaard, “Insignificant Change in Antarctic Snowmelt Volume Since 1979,” Geophysical Research Letters, Vol. 39, No. 5788, 2012, Article ID: L01501. doi:10.1029/2011GL050207
- T. P. Albright, A. M Pidgeon, C. D. Rittenhouse, M. K. Claytonb, C. H. Flatherc, P. D. Culberta and V. C. Radeloffa, “Heat Waves Measured with MODIS Land Surface Temperature Data Predict Changes in Avian Community Structure,” Remote Sensing of Environment, Vol. 115, No. 1, 2011, pp. 245-254. doi:10.1016/j.rse.2010.08.024
- T. T. van Leeuwen, A. J. Frank, Y. F. Jin, P. Smyth, M. L. Goulden, G. R. van der Werf and J. T. Randerson, “Optimal Use of Land Surface Temperature Data to Detect Changes in Tropical Forest Cover,” Journal of Geophysical Research, Vol. 116, No. G02002, 2011, Article ID: G02002. doi:10.1029/2010JG001488
- A. Benali, A. C. Carvalho, J. P. Nunes, N. Carvalhais and A. Santos, “Estimating Air Surface Temperature in Portugal Using MODIS LST Data,” Remote Sensing of Environment, Vol. 124, No. 12, 2012, pp. 108-121. doi:10.1016/j.rse.2012.04.024
- M. C. Anderson and W. P. Kustas, “Mapping Evapotranspiration and Drought at Local to Continental Scales Using Thermal Remote Sensing,” IEEE Transactions on Geoscience and Remote Sensing, Boston, 6-11 July 2008.
- L. Campo1, F. Castelli, D. Entekhabi and F. Caparrini, “Land-Atmosphere Interactions in a High Resolution Atmospheric Simulation Coupled with a Surface Data Assimilation Scheme,” Natural Hazards and Earth System Sciences, Vol. 9, No. 9, 2009, pp. 1613-1624. doi:10.5194/nhess-9-1613-2009
- Z. Wan, Y. Zhang, Z. Li, R. Wanga, V. V. Salomonsonb, A. Yvesc, R. Bossenoc and J. F. Hanocqd, “Preliminary Estimate of Calibration of the Moderate Resolution Imaging Spectroradiometer Thermal Infrared Data Using Lake Titicaca,” Remote Sensing Environment, Vol. 80, No. 1, 2002, pp. 497-515. doi:10.1016/S0034-4257(01)00327-3
- Z. Wan, Y. Zhang, Q. Zhang and Z.-L. Li, “Validation of the Land Surface Temperature Products Retrieved from Terra Moderate Resolution Imaging Spectroradiometer Data,” Remote Sensing of Environment, Vol. 83, No. 1, 2002, pp. 163-180. doi:10.1016/S0034-4257(02)00093-7
- Z. Wan, “New Refinements and Validation of the MODIS Land Surface Temperature/Emissivity Products,” Remote Sensing of Environment, Vol. 112, No. 1, 2008, pp. 59-74. doi:10.1016/j.rse.2006.06.026
- E. T. Crosman and J. D. Horel, “MODIS-Derived Surface Temperature of the Great Salt Lake,” Remote Sensing of Environment, Vol. 113, No. 1, 2009, pp. 73-81. doi:10.1016/j.rse.2008.08.013
- C. Coll, Z. Wan and J. M. Galvem, “Temperature-Based and Radiance-Based Validations of the V5 MODIS Land Surface Temperature Product,” Journal of Geophysical Research, Vol. 114, No. D20, 2009, Article ID: D20102. doi:10.1029/2009JD012038
- J. M. Galve, C. Coll, V. Caselles, E. Valor, R. Niclòs, J. M. Sánchez and M. Mira, “Simulation and Validation of Land Surface Temperature Algorithms for MODIS and AATSR Data,” Tethys, Vol. 4, No. 4, 2007, pp. 27-32. doi:10.3369/tethys.2007.4.04
- Z. Wan, Y. Zhang, Q. Zhang and Z.-L. Li, “Quality Assessment and Validation of the MODIS Global Land Surface Temperature,” Internal Journal of Remote Sensing, Vol. 25, No. 1, 2004, pp. 261-274. doi:10.1080/0143116031000116417
- Z. Wan and Z.-L. Li, “Radiance-based Validation of the V5 MODIS Land-surface Temperature Product,” Internal Journal of Remote Sensing, Vol. 29, No. 17-18, 2008, pp. 5373-5395. doi:10.1080/01431160802036565
- D. K. Hall, J. E. Box, K. A. Casey, S. J. Hook, C. A. Shuman and K. Steffen, “Comparison of Satellite-Derived and In-Situ Observations of Ice and Snow Surface Temperatures over Greenland,” Remote Sensing of Environment, Vol. 112, No. 10, 2008, pp. 3739-3749. doi:10.1016/j.rse.2008.05.007
- S. Westermann, M. Langer and J. Boike, “Spatial and Temporal Variations of Summer Surface Temperatures of HighArctic Tundra on Svalbard—Implications for MODIS LST Based Permafrost Monitoring,” Remote Sensing of Environment, Vol. 115, No. 3, 2011, pp. 908-922. doi:10.1016/j.rse.2010.11.018
- S. Hachem, C. R. Duguay and M. Allard, “Comparison of MODIS-Derived Land Surface Temperatures with Ground Surface and Air Temperature Measurements in Continuous Permafrost Terrain,” The Cryosphere, Vol. 6, No. 1, 2012, pp. 51-69. doi:10.5194/tc-6-51-2012
- R. Manson, R. Coleman, P. Morgan and M. King, “Ice Velocities of the Lambert Glacier from Static GPS Observations,” Earth Planets Space, Vol. 52, No. 11, 2000, pp. 1031-1036.
- H. A. Fricker, G. Hyland, R. Coleman and W. Young, “Digital Elevation Models for the Lambert Glacier-Amery Ice Shelf System, East Antarctica, from ERS-1 Satellite Radar Altimetry,” Journal of Glaciology, Vol. 46, No. 155, 2000, pp. 553-560. doi:10.3189/172756500781832639
- C. Vancutsem, P. Ceccato, T. Dinku and J. Connor, “Evaluation of MODIS Land Surface Temperature Data to Estimate Air Temperature in Different Ecosystems over Africa,” Remote Sensing of Environment, Vol. 114, No. 2, 2010, pp. 449-465. doi:10.1016/j.rse.2009.10.002
- G. V. Mostovoy, R. L. King, K. R. Reddy and V. Gopal Kakani, “Statistical Estimation of Daily Maximum and Minimum Air Temperatures from MODIS LST Data over the State of Mississippi,” GIScience and Remote Sensing, Vol. 43, No. 1, 2006, pp. 78-110. doi:10.2747/1548-1603.43.1.78
- K. Zaksek and M. Schroedter-Homscheidt, “Parameterization of Air Temperature in High Temporal and Spatial Resolution from a Combination of the SEVIRI and MODIS Instruments,” ISPRS Journal of Photogrammetry and Remote Sensing, Vol. 64, No. 4, 2009, pp. 414-421. doi:10.1016/j.isprsjprs.2009.02.006
- Y. Zhang, D. J. Seidel, Y-H. Zhang, D. J. Seidel J.-C. Golaz, C. Deser and R. A. Tomas, “Climatological Characteristics of Arctic and Antarctic Surface-Based Inversions,” Journal of Climate, Vol. 24, No. 19, 2011, pp. 5167-5186. doi:10.1175/2011JCLI4004.1
- S. R. Hudson and R. E. Brandt, “A Look at the SurfaceBased Temperature Inversion over the Antarctic Plateau,” Journal of Climate, Vol. 18, No. 11, 2005, pp. 1673-1696. doi:10.1175/JCLI3360.1