International Journal of Geosciences
Vol. 4 No. 2 (2013) , Article ID: 29350 , 9 pages DOI:10.4236/ijg.2013.42034
Coseismic Effects of the 2011 Magnitude 9.0 Tohoku-Oki Earthquake Measured at Far East Russia Continental Coast by Gravity and GPS Methods
1Institute of Petroleum Geology and Geophysics, Siberian Branch of Russian Academy of Sciences, Novosibirsk, Russia
2V. I. Il’ichev Pacific Oceanological Institute, Far Eastern Branch of Russian Academy of Science, Vladivostok, Russia
3Institute of Automatic and Electrometry Siberian, Branch of Russian Academy of Sciences, Novosibirsk, Russia
4Georges Lemaître Centre for Earth and Climate Research, Catholic University of Louvain, Leuven, Belgium
5Institute of Tectonics and Geophysics, Far Eastern Branch of Russian Academy of Sciences, Khabarovsk, Russia
Email: timofeevvy@ipgg.sbras.ru
Received September 29, 2012; revised December 1, 2012; accepted January 3, 2013
Keywords: Absolute Gravimetry; GPS; Tidal Gravity Modeling and Observation; Scintrex Gravimeter; Co-Seismic Effect for Tohoku-Oki Earthquake
ABSTRACT
This work presents the results of complex gravity observation performed at Shults Cape, Gamov peninsula (42.58˚N, 131.15˚E), Russia. Absolute laser gravimeter GABL type and Scintrex type relative gravimeter were used for measurement. To investigate the accuracy of tidal corrections we compared the observed tidal parameters of the main tidal waves O1 and M2 with modeled ones computed from 6 different ocean tidal models: CSR4, FES02, FES04, GOT00, NAO99 and TPX06. After discussion a theoretical model based on TPX06 ocean tides model and DDW99 non-hydrostatic body tides model was used for tidal correction of absolute gravity data. Preliminary estimate of gravity effect induced by the Tohoku-Oki earthquake of 11 March 2011 Mw = 9.0 at Primorye territory (Russia) was found to be 5.1 ± 2.0 μGal. Co-seismic crustal displacements revealed by GPS data at Far East Russia continental coast are also investigated. Volumetric dilatation of this area is observed at +1.7 × 10⁻⁸ level.
1. Introduction
Joint project to measure gravity change associated with tidal and earthquake’s effect using absolute and relative gravimeters was started at 2010 year. Well-known coseismic effects in gravity and in displacement field distributed on big territory for the earthquake of Mw ≥ 9. GPS measured displacement jump at 1 cm level was registered at 1500 km from epicenter of Sumatran earthquake 27.12.2004, M > 9 [1,2]. Gravity effect at 15 µGal level was measured by GRACE method at 1000 km distance. The Tohoku-Oki earthquake of 11 March 2011 Mw = 9.0 description is presented in many articles [3-8]. We tried to measure co-seismic gravity effect at south part of Primorye territory (Russia) at 1000 km distance from the epicenter. Some GPS results measured during last years at Far East Russia continental coast are also investigated. List of points for observation is presented at Table 1.
2. Gravity Measurement
Gravity observation started on 2010. Absolute gravimeter GABL [9] was added to the summer observation with Scintrex gravimeter measurement (Table 2). Observation was developed at Marine Experimental Observatory (MEO) territory “Shults Cape” of V.I. Il’ichev Oceanological Institute Far East Branch Russian Academy of Science. MEO is situated at Gamov peninsula (42.58˚N, 131.15˚E, Russia) on the Coast of Japan Sea (Figure 1). Special underground cellar with passive temperature stabilization was used for gravity measurement. In 2010 and 2011 three months of tidal gravity record have been obtained during summer time with Scintrex gravimeter.
For the main tidal waves we determine the amplitude A and the phase difference α, i.e. the vector A(A, α), with respect to the astronomical tide of amplitude Ath (Figure 2). The amplitude factor δ is defined as the ratio A/Ath [10]. For gravity tides prediction we build the modeled tidal factors based on the body tide amplitude R(R = Ath
Table 1. GPS and gravity points, coordinates and horizontal coseismic jump in mm.
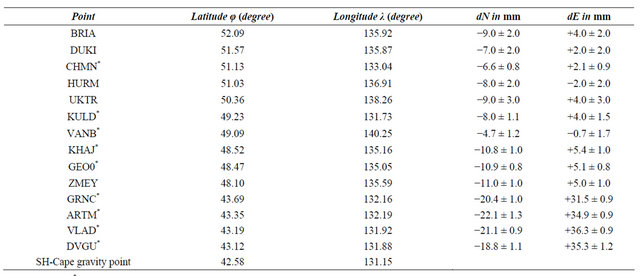
Points marked by* from work [12].
Table 2. Technical specifications of GABL gravimeter.
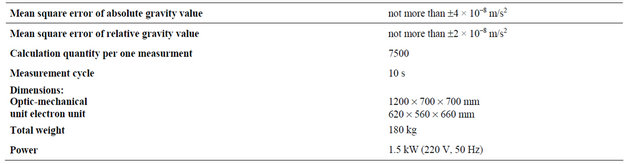
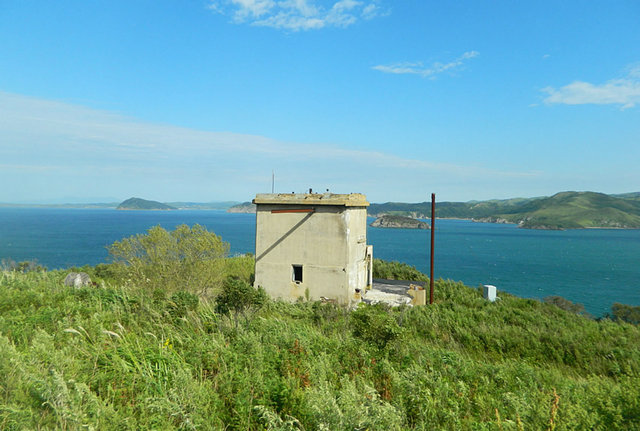
Figure 1. Gravity point at marine experimental station of V.I. Il’ichev oceanological institute far east branch Russian academy of science.
δDDW, 0) computed from the DDW99 non-hydrostatic inelastic model [11] and the ocean load vector L(L, λ) computed from nine different ocean tides models. The modeled vector Am(Am, αm) is given as
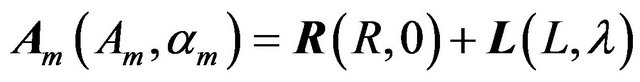 (1)
(1)
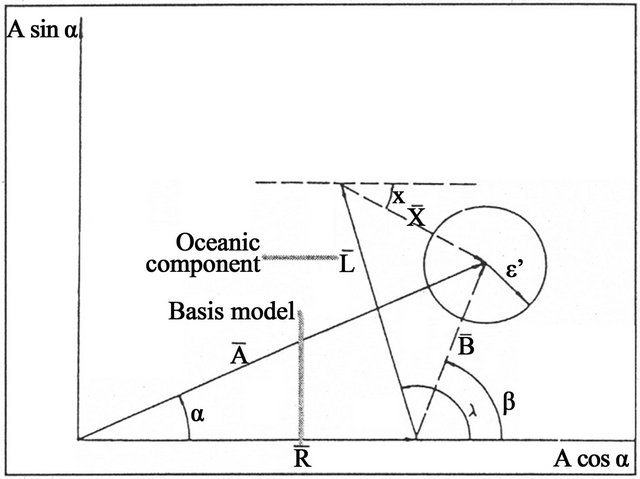
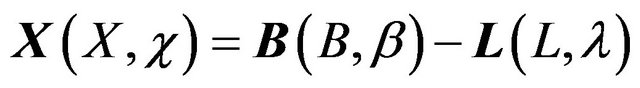
Figure 2. Relationship between the observed tidal amplitude vector A(A, a), the Earth model R(R, 0), the computed ocean tides load vector L(L, l), the tidal residue B(B, b) and the corrected residue X(X, c): B = A – R; X = B – L (4).
The modeled amplitude factor δm is simply given by the ratio Am/Ath.
The tidal loading vector L, which takes into account the direct attraction of the water masses, the flexion of the ground and the associated change of potential, is generally evaluated by performing a convolution integral between the ocean tide models and the load Green’s function computed by Farrell [12]. We used the program referenced in Melchior et al. [13]. Details and references can be found in [14,15].
The corrected tidal factors are defined as
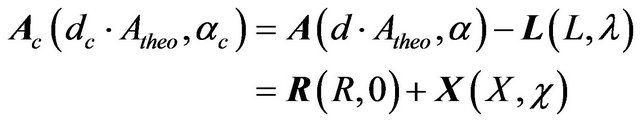 (2)
(2)
We built also the residual vector  defined as (see Figure 3 for explanation):
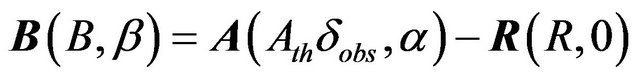 (3)
(3)
 (4)
(4)
The accuracy of the absolute gravity determination depends strongly on the precision of the tidal correction. The Trans-Siberian tidal gravity profile [16] demonstrated that modelled tidal factors, based on the mean of the 6 most recent ocean tides models (CSR4, GOT00, NAO99 with 0.5˚ × 0.5˚ grid; FES02, TPX06 wit 0.25˚ × 0.25˚ grid and FES04 with 0.125˚ × 0.125˚ grid), insure a precision of gravity tides predictions of the order of 5 nm/s2 on the Siberian territory.
The situation is more delicate at Shults Cape which is located directly on the coast. The resolution of the grid being at the best of 10 km, the ocean tides models do not follow accurately the coast line and the precision of the numerical evaluation is degraded.
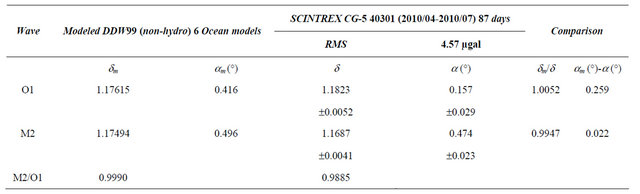
Tidal gravity records remain thus important to try to determine experimentally the tidal parameters, at least in the diurnal (D) and semidiurnal (SD) tides. However long records are required to reach the suitable precision of 0.2% (5 nm/s2) and we have only two summer records of 3month each. Our precision is only of 0.5% in amplitude and 0.25 in phase (Table 3). The analysis results are in agreement with the modelled tidal factors within the RMS errors for O1 (Figure 3(b)), but the difference is a bit larger on the tidal amplitude factor for M2 (Figure 3(c)). The analysis of the 3 summer months 2011 (M2 1.1688 ± 0.0056) confirms this result.
A more detailed comparison is given in Table 4.
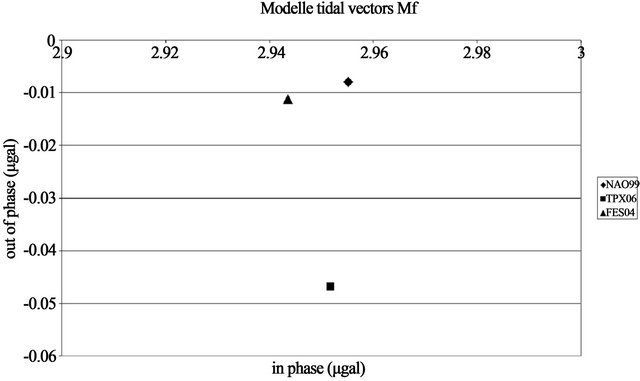
For the while our gravity tides predictions remain thus based on the modelled tidal factors. For absolute gravity measurements the modelling of the long period (LP) tides is very important. It is the reason why we used only the three ocean tides models including the LP tides: NAO99 (0.5˚ × 0.5˚), TPX06 (0.25˚ × 0.25˚) and FES04 (0.125˚ × 0.125˚). Figure 4 displays the spectral difference between one month of tidal prediction computed with the three different models. As pointed out in Figure 3(a)-(c), TPX06 and NAO99 are very similar For D and SD tides, but for LP tides TPX06 differs from the two other models. It is thus difficult to make a choice. Differences between models remain below ±5 nm/s2. It is the expected precision of the gravity tides prediction at Shults Cape.
Finally we used the theoretical model based on TPX06 ocean tides model and DDW99 non hydrostatic body tides model for station Shults Cape and computed tides with Tamura potential for absolute gravity correction.
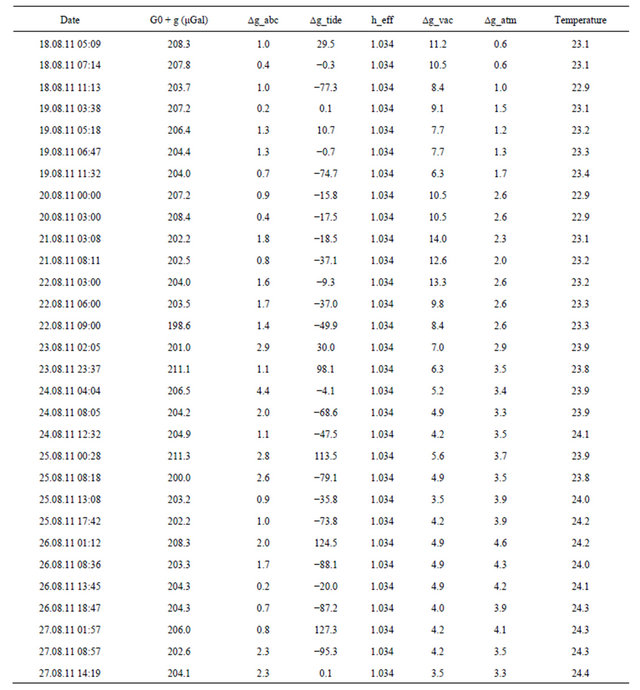
Absolute gravimeter situated at Shults Cape station is presented at Figure 5. As usually, we used corrections for: solid earth tide, ocean loading, air pressure, polar motion and instrumental ones. Result of measurements and corrections are presented at Table 5 and on Figure 6.
Absolute gravity observations were performed during two periods: 23-30 October 2010 and 15-30 August 2011. Mean square error of measurements series was 1-2 microgal. Gravity value increased by 5.1 microgal during this period including 11 March 2011 earthquake.
3. GPS Measurement
Original and published results [6] computed by GPS data
Table 3. Comparison of the results of SCINTREX CG5 40301 with modeled tidal factors at Shults Cape.
 (a)
(a) 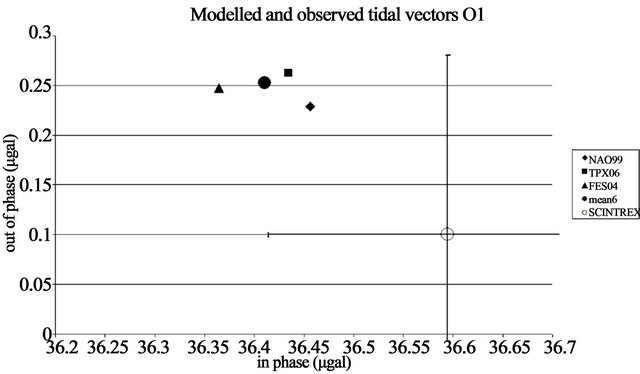 (b)
(b) 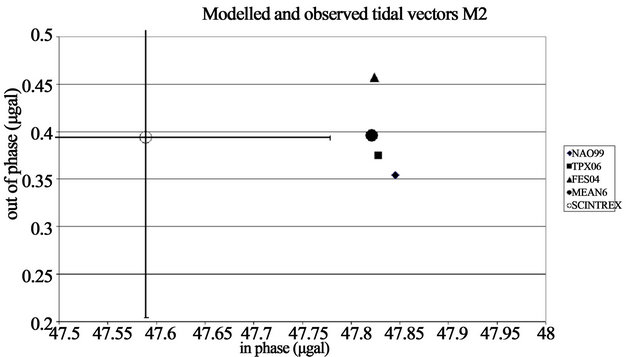 (c)
(c)
Figure 3. Modelled and observed tidal factors NAO99, TPX06, FES04 and MEAN6: in phase dm·Atheocos(am), out of phase dm·Atheosin(am) SCINTREX: in phase d·Atheocos(a), out of phase d·Atheosin(a), with error bars. (a) Mf wave; (b) O1 wave; (c) M2 wave.
Table 4. Results of tidal analysis. Station 1406, appareil 403, oceanic model TPX06, component V, model Wahr-Dehant: non-hydrostatic inelastic case.
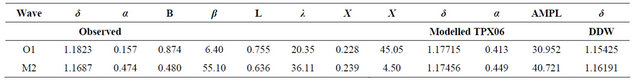
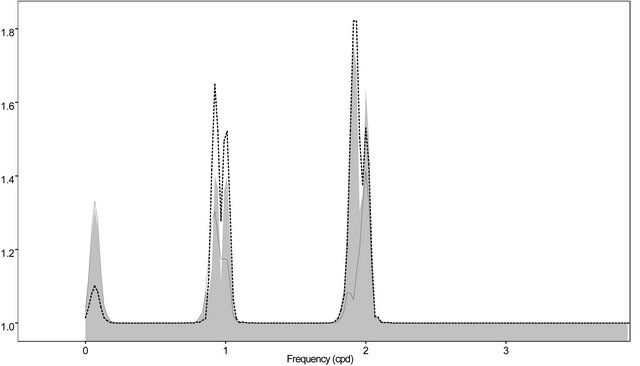
Figure 4. Spectral difference between different theoretical tidal evaluations in nm/s**2. From left to right LP, D and SD tidal bands. TPX06-FES04 shadow, TPX06-NAO99 full line, FES04-NAO99 dotted line.
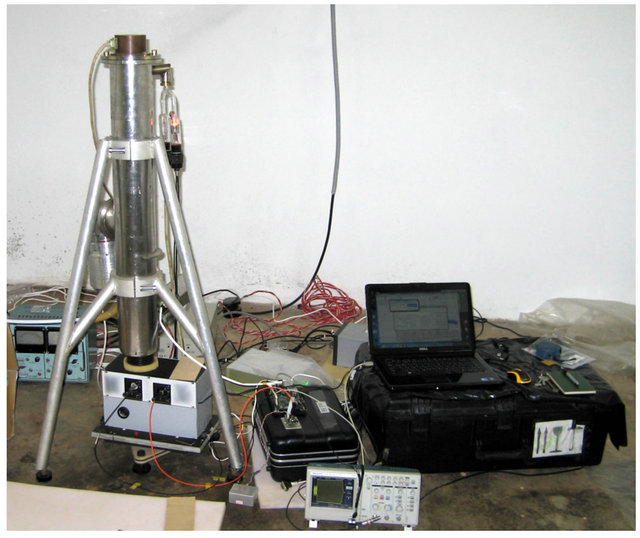
Figure 5. Absolute gravimeter (GABL type) at gravity cellar (Shults Cape).
are presented in Table 1. Data were obtained at points situated at far epicentral distance (1000 km - 1700 km). Horizontal vector changes from 4.0 cm to 0.7 cm. Mean square error is ranging from 0.5 cm to 3.0 cm.
GPS measured horizontal displacement jump (5 - 8 cm) was registered at 1000 km from epicenter of Sumatran earthquake 27.12.2004, M > 9 [7]. Horizontal jump more then 1 cm was registered at 1500 km distance. GPS measurement at Primorye (1000 km distance from epicenter of Tohoku earthquake 2011) shows 4 cm horizontal jump (Table 1). Vertical jump was observed at ZMEY station. Subduction was 8 mm ± 3 mm. (Figure 7).
You can see on Figure 8(a) our stations (BRIA, DUKI, HURM, UKTR, ZMEY), which are belonging to northern part of GPS-network of Far East of Russia, and Zmey-station (60 km to SE from Khabarovsk). South profile cross the Sikhote-Alin range. Our measurements, are always performed in September to suppress seasonal effects [17,18]. A similar procedure was already used at Gorny Altay for yearly measurements [19]. Observations were performed during 2 - 5 days at network points
Table 5. Results of GABL observation and corrections for the period: 18-27 August 2011 year.
(BRIA, DUKI, HURM, UKTR) and 15 - 20 days at ZMEY base station by two receivers TRIMBLE4700 type with MICROCENTERED antennas. We used hard benchmarks to monument the network (Figure 8(b)). Examples of observation curves are presented on Figures 8-10.
Horizontal velocity relative to YSSK permanent station for the period 2003-2006 is shown on Figure 8(c). Anomalous motion is registered at Japanese islands (red oval). South part of network and Zmey-station are shown inside a orange oval. Small red point is the epicenter of Nevelskoe earthquake 2/08/2007, M = 6.3. Big red point is epicenter of Tohoku earthquake. G-gravity point, Shults Cape (Gamov peninsula, 42.58˚N, 131.15˚E).
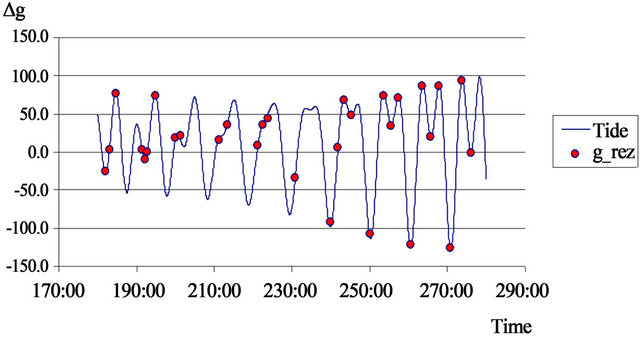
Figure 6. Tidal model and absolute gravimeter data (Table 5).

Figure 7. GPS results at Far East territory from 2007 to 2011 years. Position changes and coseismic jump for ZMEY point.
4. Discussion and Conclusion
Connection gravity variation with height change may be described as:
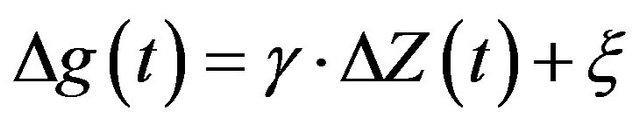 (5)
(5)
where: g-vertical gradient of gravity g, normal value −3.08 × 10⁻⁶ m/s2; DZ(t)—height change, ξ—error.
Subduction of Primorye region (Shults Cape) was induced by Tohoku-Oki Megathrust. Preliminary result

Figure 8. (a) GPS network at Far East of Russia; (b) Hard installation into bed-rock for GPS antenna; (c) Horizontal velocity relative YSSK, 2003-2006 yy.
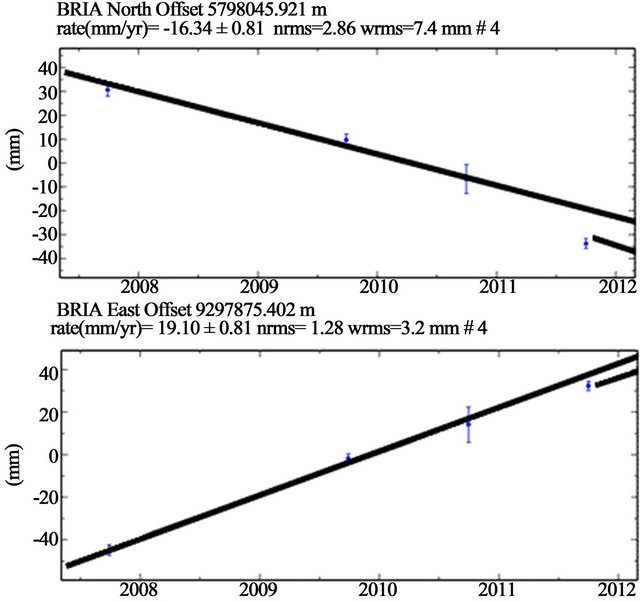
Figure 9. GPS results at Far East territory from 2007 to 2011 years. Position changes and coseismic jump for BRIA point.
gravity change 5.1 microgal means 17 mm subsidence of crust surface. A vertical subsidence of 8 mm was Registered at ZMEY point by GPS method. It is not clear if it is regional or local. From other side, if we have deformation of a medium, the associated variation of g is given by:
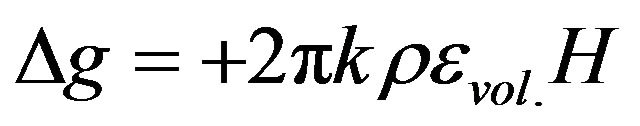 (6)
(6)
where: k—gravity constant, ρ—density of a medium, εvol. —volumetric strain jump, H—thickness of a layer (earth crust or lithosphere).
Strain measurements in two orthogonal directions on
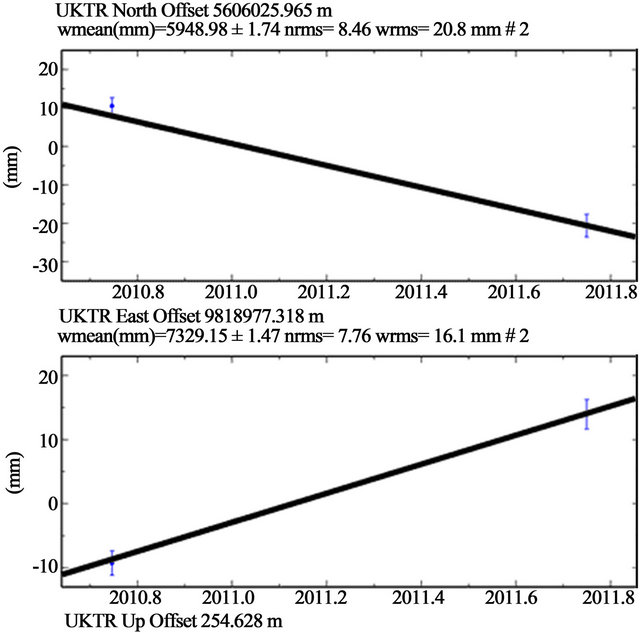
Figure 10. GPS results at Far East territory from 2007 to 2011 years. Position changes and coseismic jump for UKTR point, annual velocity 16 mm/y for N-direction and 20 mm/y for E-direction (by model).
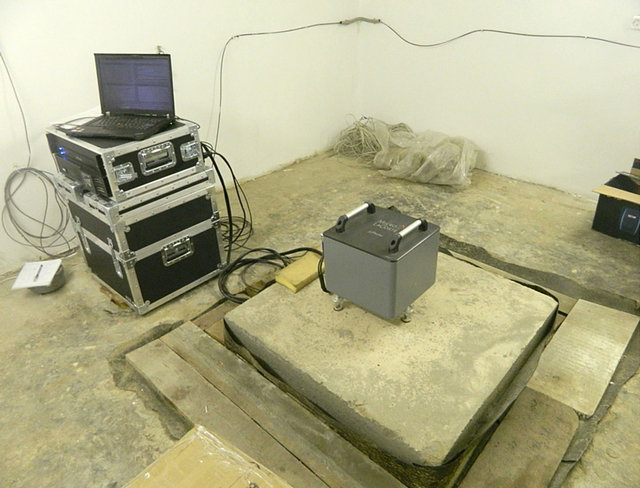
Figure 11. Microg LaCoste & Romberg (gPhone, n111) at Shults Cape station.
the flat surface can be used to calculate areal, volumetric, and vertical strain. For an isotropic medium we get:
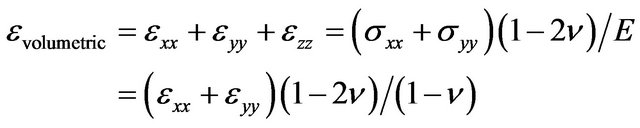 (7)
(7)
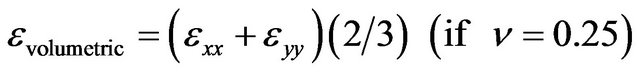 (8)
(8)
where, ν is Poisson coefficient.
Level of regional deformation can be estimated by GPS results (Table 1). We have 0.8 × 10⁻⁸ for EW KULD-VANB line. For orthogonal NS DUKI-ARTM line we have +1.7 × 10⁻⁸. We may estimate Volumetric dilatation at +1.7 × 10⁻⁸ level (Poisson coefficient ν = 0.25). Gravity changes for lithosphere thickness (50 km, 100 km and 150 km) will be −0.1 microgal, −0.2 microgal and −0.3 microgal (ρ = 3.5 × 10³ kg/m3). It is negligible with respect to subsidence effect. Observed gravity variation is connected only with height change or with tectonic plate level down.
Now gravity observation is continued at Shults Cape station. Microg LaCoste&Romberg (gPhone, n111) gravimeter is used for the registration of tidal variation (Figure 11). More precise tidal model will be calculated. We hope to prepare better model for local gravity variation. GPS observation started at gravity point at the end of August 2012 year.
REFERENCES
- S. C. Han, C. K. Shum, M. Bevis, C. Ji and C. Y. Kuo, “Crustal Dilatation Observed by GRACE after the 2004 Sumatra-Andaman Earthquake,” Science, 2006, Vol. 313, No. 5787, pp. 658-662.
- T. Lay and H. Kanamori, “Insights from the Great 2011 Japan Earthquake,” Physics Today, Vol. 64, No. 12, 2011, p. 33. doi:10.1063/PT.3.1361
- ARIA Team, “Preliminary GPS Coseismic Displacement Data for March 11, 2011 M9 Japanese Earthquake,” JPL and Caltech. ftp://sideshow.jpl.nasa.gov/pub/usrs/ARIA
- N. Shestakov, M. Gerasimenko, H. Takahashi, M. Kasahara, V. Bormotov, V. Bykov, A. Kolomiets, G. Gerasimov, N. Vasilenko, A. Prytkov, V. Timofeev, D. Ardyukov and T. Kato, “Present Tectonics of the Southeast of Russia as Seen from GPS Observations,” Geophysical Journal International, Vol. 184, No. 2, 2011, pp. 529-540. doi:10.1111/j.1365-246X.2010.04871.x
- M. Simon, S. E. Minson, A. Sladen, F. Ortega, J. Jiang, S. E. Owen, L. Meng, J.-P. Ampaero, S. Wei, R. Chu, D. V. Helcuberger, H. Ranamori, E. Hetland, A. W. Moore and F. H. Webb, “The 2011 Magnitude 9.0 Tohaku-Oki Earthquake: Mosaicking the Megethrust from Seconds to Centuries,” Science, Vol. 332, No. 6036, 2011, pp. 1421-1425. doi:10.1126/science.1206731
- N. V. Shestakov, H. Takahashi, M. Ohzono, V. G. Bykov, M. D. Gerasimenko, A. S. Prytkov, V. A. Bormotov, M. N. Luneva, A. G. Kolomiets, G. N. Gerasimov, N. F. Vasilenko, J. Baek, P.-H. Park, A. A. Sorokin, V. F. Bakhtiarov, N. N. Titkov and S. S. Serovetnikov (2011) “Crustal Displacements of East Asia Caused by the Tohoku Earthquake of March 11, 2011, Mw=9.0,” 7th Biennual Workshop on Japan-Kamchatka-Alaska Subduction Processes: Mitigating Risk through International Volcano, Earthquake, and Tsunami Science (JKASP- 2011), Petropavlovsk-Kamchatsky, 25-30 August, 2011, pp. 48-53. http://www.kscnet.ru/ivs/conferences/kasp/tez/index.html
- L. Wang, C. K. Shum, F. J. Simons, B. Tapley and C. Dai, “Coseismic and Postseismic Deformation of the 2011 Tohoku-Oki Earthquake Constrained by GRACE Gravimetry,” Geophysical Research Letters, Vol. 39, No. 7, 2012.
- K. Matsuo and K. Heki, “Coseismic Gravity Changes of the 2011 Tohoku-Oki Earthquake from Satellite Gravimetry,” Geophysical Research Letters, Vol. 38, No. 7, 2011. doi:10.1029/2011GL049018
- L. Robertson, O. Francis, T. M. van Dam, J. Faller, D. Ruess, J.-M. Delinte, L. Vitushkin, J. Liard, C. Gagnon, Y. G. Guo, D. L. Huang, Y. Y. Fang, J. Y. Xu, G. Jeffries, H. Hopevell, R. Edge, I. Robinson, B. Kibbe, J. Makinen, J. Hinderer, V. Amalvict, B. Luck, H. Wilmes, F. Rehren, K. Schmidt, M, Schnull, G. Cerutti, A. Germmak, Z. Zabek, A. Pachuta, G. Arnautov, E. Kalish, Yu. Stus, D. Stizza, J. Friderich, J.-M. Chartier and I. Marson, Metrologia, Vol. 38. No. 1, 2001, pp. 71-78.
- P. Melchior, “The Tides of the Planet Earth,” 2nd Edition, Pergamo Press, Oxford, 1983, 641 p.
- V. Dehant, P. Defraigne and J. Wahr, “Tides for a Convective Earth,” Journal of Geophysical Research, Vol. 104, No. B1, 1999, pp. 1035-1058. doi:10.1029/1998JB900051
- W. E. Farrell, “Deformation of the Earth by Surface Load,” Reviews of Geophysics, Vol. 10, No. 3, 1972, pp. 761-779. doi:10.1029/RG010i003p00761
- P. Melchior, M. Moens and B. Ducarme, “Computations of Tidal Gravity Loading and Attraction Effects,” Royal Observatory of Belgium, Bulletin of Observatory Marées Terrestres, Vol. 4, No. 5, 1980, pp. 95-133.
- J.-P. Boy, M. Llubes, J. Hinderer and N. Florsch, “A Comparison of Tidal Loading Models Using Superconducting Gravimeter Data,” Journal of Geophysical Research, Vol. 108, No. B4, 2003, p. 2193. doi:10.1029/2002JB002050
- B. Ducarme, S. Rosat, L. Vandercoilden, J. Q. Xu, H. P. Sun, “European Tidal Gravity Observations: Comparison with Earth Tides Models and Estimation of the Free Core Nutation (FCN) Parameters,” International Association of Geodesy Symposia, Vol. 133, 2008, pp. 523-532.
- B. Ducarme, V. Y. Timofeev, M. Everaerts, P. Gornov, V. Parovishnii and M. van Ruymbeke, “A Trans-Siberian Tidal Gravity Profile (TSP) for the Validation of Ocean Tides Loading Corrections,” Journal of Geodynamics, Vol. 45, No. 2-3, 2008, pp. 73-82.
- V. Yu. Timofeev, P. Yu. Gornov, D. G. Ardyukov, Yu. F. Malyshev and E. V. Boiko, “GPS Measurements (2003- 2006) in the Sikhote Alin Network, the Far East,” Russian Journal of Pacific Geology, Vol. 2, No. 4, 2008, p. 314.
- V. Yu. Timofeev, A. Yu. Kazansky, D. G. Ardyukov, D. V. Metelkin, P. Yu. Gornov, N. V. Shestakov, A. V. Timofeev and G. Z. Gil’manova, “Rotation Parameters of the Siberian Domain and Its Eastern Surrounding Structures during Different Geological Epochs,” Russian Journal of Pacific Geology, Vol. 5, No. 4, 2011, pp. 288-298.
- V. Yu. Timofeev, D. G. Ardyukov, E. Calais, A. D. Duchkov, E. A. Zapreeva, S. A. Kazantsev, F. Roosbeek and C. Bruyninx, “Displacement Fields and Models of Current Motion in Gorny Altai,” Russian Geology and Geophysics, Vol. 47, No. 8, 2006, pp. 923-937.