International Journal of Geosciences
Vol. 3 No. 4 (2012) , Article ID: 22908 , 12 pages DOI:10.4236/ijg.2012.34074
Simulation of Heavy Rainfall Events during Retreat Phase of Summer Monsoon Season over Parts of Andhra Pradesh
1Department of Meteorology and Oceanography, Andhra University, Visakhapatnam, India
2Regional Meteorological Centre, India Meteorological Department, Hyderabad, India
Email: osrubhanukumar@yahoo.com
Received April 16, 2012; revised May 20, 2012; accepted May 29, 2012
Keywords: Meso-α low pressure; cumulus parameterization; heavy rainfall; floods
ABSTRACT
The main aim of this paper is to simulate monsoon heavy rainfall episodes that caused floods across some parts of Andhra Pradesh (AP) state, India during 29th September through 2nd October, 2009. A heavy rainfall quantity of 21 cm was observed near Amaravathi station (16.15˚N; 80.5˚E) in Guntur district due to a meso-α low pressure system extended from the Bay of Bengal and widespread rainfall episodes were also appeared to many adjoining places in other three districts namely Mahaboob Nagar, Kurnool and Krishna in AP state simultaneously on 29th September. The rainy situation continued till 2nd October and caused floods over above districts of AP state which lead to a death toll of 33 people and heavy crop loss. To quantify the above catastrophic monsoon heavy precipitation events a high resolution (9 km) Weather Research and Forecast (WRF-ARW) model is centered at Amaravathi station to simulate rainfall episodes over the study region. In the present case study the simulated sensitive experiment highlights the dynamical characteristics of the meso-α system interms of circulation changes at different levels. Secondly, the thermodynamical characteristics for the generation of convective activity of this meso-α event in terms of Convective Available Potential Energy (CAPE) and Convective Inhibition Energy (CINE) are also simulated. Dynamical and thermodynamical simulated results support heavy rainfall episodes due to a low pressure system around Amaravathi station. Thus circulation changes, high CAPE and low CINE magnitudes have well defined not only the strength of meso-α system, but also quantum of rainfall to a tune of 19 cm near Amaravathi station on 29th September. The observed rainfall was 21 cm on 29th September and thus this model underestimates rainfall about 9.5% not only at Amaravathi station, but also at other stations as well. Similar results are noticed over the study region on other three days. In this numerical study heavy rainfall events are better represented by Kain-Fritsch (KF) scheme than Betts-Miller-Janjic (BMJ) and Grell-Deveneyi (GD) schemes. Finally simulated circulation features and rainfall quantities are validated with observed rainfall of the India Meteorological Department (IMD) and satellite derived datasets of KALPANA-1, while CAPE and CINE quantities are checked against available Wyoming University observations. The results are promising.
1. Introduction
Indian summer monsoon normally bursts over extreme South India on 1st week of June in association with Intraseasonal oscillations [1-4] and covers whole of India in a northwesterly direction by 15th July in five or six pulses [5,6], but year-to-year anomalies are worth noting. July and August are peak months of monsoon rainfall period over India due to synoptic and sub-synoptic systems in different active phases. Later monsoon starts its withdrawal process from extreme northwest India by 1st September and slowly retreats in opposite direction of advance of monsoon till October (Figure 1). [7,8] reported that the periods of advance and withdrawal of southwest monsoon are related with variations of winter Eurasian/Himalayan snow cover extent. The southwest monsoon provides considerable portion of rainfall over India in both onset and withdrawal phases through heavy precipitation episodes along East and West coasts of India due to synoptic systems; these generally lead to flash floods of great volume in a short duration due to heavy rainfall. Year, 2009 is marked by early onset of southwest monsoon over extreme South India (three days prior to normal onset) and late withdrawal from West Rajasthan in northwest India (three weeks).
In the past there were several diagnostic studies to simulate frequent heavy rainfall episodes over West coast of India during both onset and withdrawal phases of the southwest monsoon season [9-15]. Though such heavy rainfall incidents are very regular over East coast of India as well, there are limited simulation studies of heavy
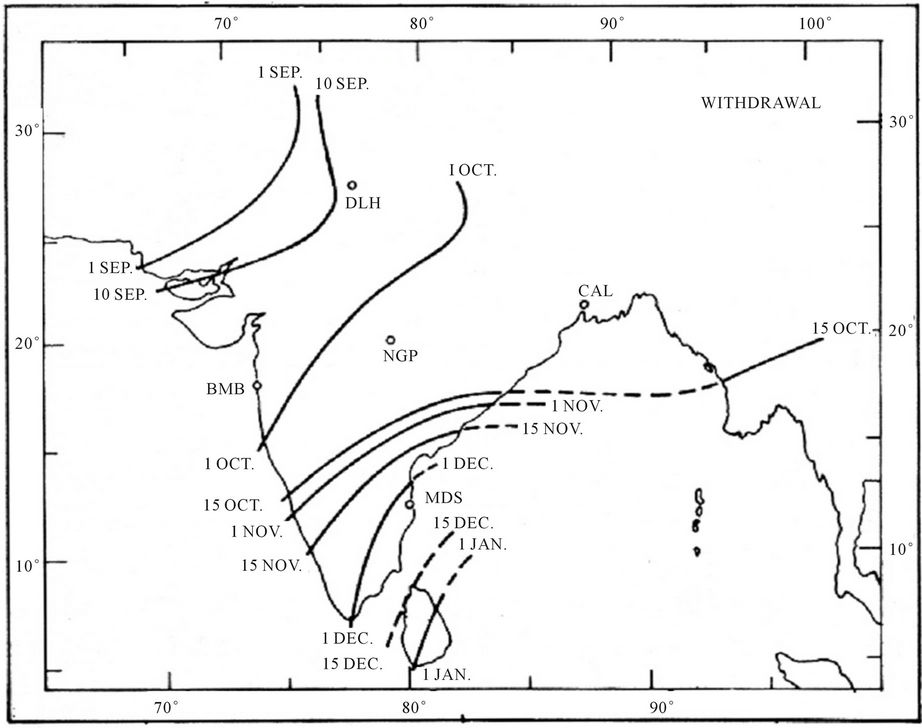
Figure 1. Normal dates of withdrawal of southwest monsoon season over India (source: IMD).
precipitation episodes over AP state and are not well documented using numerical models. Hence there is a pressing need in this study to simulate the dynamical and thermodynamical characteristics of heavy rainfall episodes over AP state during withdrawal phase of the southwest monsoon season. So in this case study the sudden enhanced environmental mesoscale disturbance inspires the authors to simulate heavy rainfall events over four districts of AP state namely Guntur, Mahaboob Nagar, Kurnool and Krishna during the withdrawal phase of monsoon, 2009 in the present context.
2. Study Area
AP state is situated on the East coast of India near the Bay of Bengal, which consists of three meteorological subdivisions namely Coastal AP, Telengana and Rayalaseema. Though the mean annual precipitation over AP state is 938 mm, the major portion of the rain (624 mm) is obtained during withdrawal period of southwest monsoon season. Frequent heavy precipitation episodes are very common over the study region during September and October due to monsoon lows/depressions, which are emanated from the monsoon trough located across AP state (Figure 2). A great proportion of the variability of rainfall in AP state is related to the occurrence and intensity of extreme heavy rainfall events due to mesoscale systems from the Bay of Bengal. Recent numerical studies [16-20] highlighted that heavy precipitation events in monsoon and post-monsoon seasons are plenty that caused floods over West coast. In the present study four districts of AP state in the East coast mentioned earlier had experienced flash floods caused by heavy precipitation episodes due to a mesoscale system during 29th September to 2nd October, 2009 (Figure 3). For example Amaravathi station in Guntur district has received an accumulated rainfall of 50.5 cm due to a meso-scale system in this study.
3. Data, Synoptic Features and Model Description
3.1. Input Data
The datasets used in the present study of heavy rainfall episodes mainly focused at Amaravathi station using
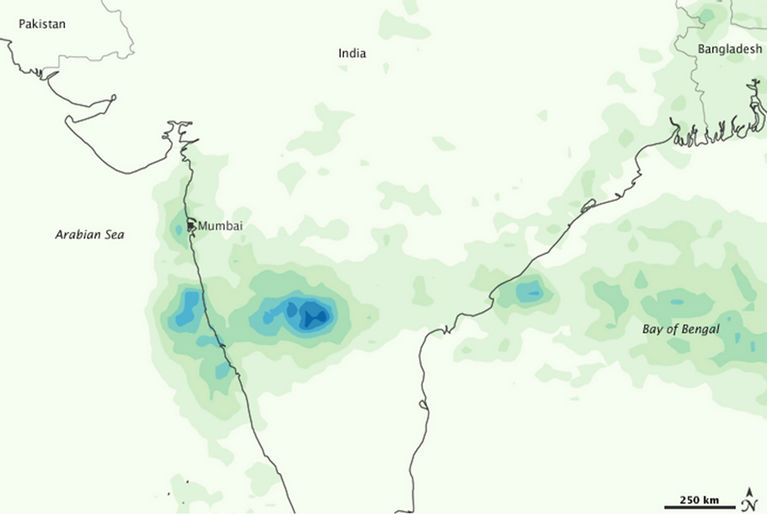

Figure 2. NASA Satellite imagery of the heavy rainfall event at Amaravathi on 29th September to 2nd October, 2009.
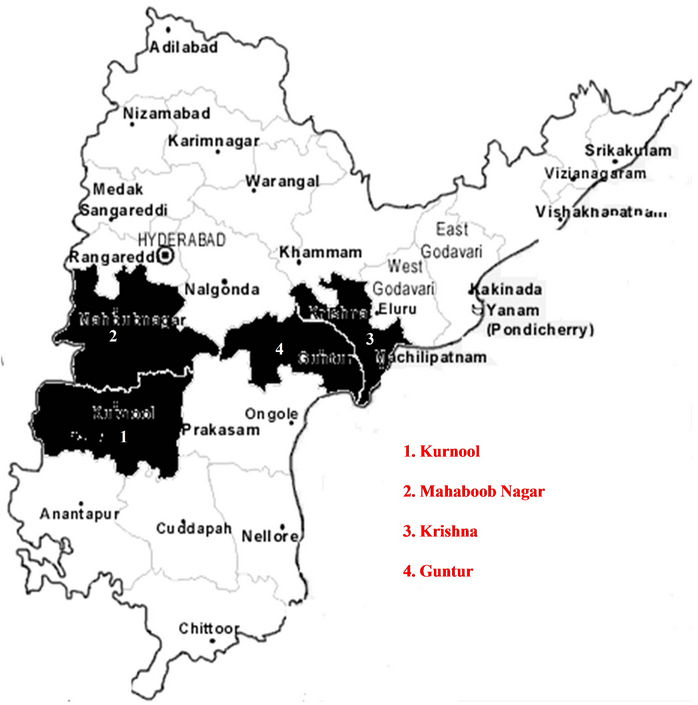
Figure 3. Study region with flash flood districts (darken) of AP on 29th September to 2nd October, 2009.
high resolution NCEP/NCAR FNL (1⁰ × 1⁰) for the model initial and boundary conditions at 6 hour interval and TRMM satellite derived real time daily rain products for validation during the period 29th September through 2nd October, 2009. Data relating to climatological heavy precipitation episodes over AP state were downloaded from Climatological Atlas of the India Meteorological Department (IMD). For the WRF model boundary conditions of topography are downloaded from the USGS website, while Wyoming University sounding profiles were obtained and used for intercomparison of model simulated thermodynamic variables over the study region. KALPANA-1 and METEOSAT products (CMV and CTT) and images were also downloaded for the study period to describe the lifecycle of sub-synoptic system and structure of meso-α low pressure system, which caused heavy precipitation episodes over AP state and the synoptic data is obtained from the Indian Daily Weather Reports for the synoptic overview of low pressure system in the Bay of Bengal during 29th September through 2nd October, 2009.
3.2. Synoptic Overview
Generally two or three monsoon depressions/low pressure systems are form over the Bay of Bengal on an average in September/October and cross AP coast. During above months the relative position of monsoon trough is normally near by study region in AP state. The normal rainfall amounts for the month of September over Coastal AP, Rayalaseema and Telengana are 15.78 cm, 14.96 cm and 17.55 cm respectively due to synoptic or sub-synoptic systems. Maximum rainfall generated by the monsoon depression in the Bay of Bengal is usually concentrated in the southwestern sector of the system. AP state receives frequent heavy precipitation episodes during withdrawal phase and a time series of heavy precipitation episodes occurred (up to 50.5 cm) are plotted for the period, 1908-2007 in summer monsoon and post-monsoon seasons (figure 4) and narrated. In all these cases of heavy rainfall quantities varied from 100 - 520 mm and the frequency is increased considerable from 1960 onwards, which may coincide with global warming era. Highest frequency of heavy precipitation episodes were noticed in 2005. In the climatological studies often heavy precipitation episodes were recorded over AP out of 34 episodes in September and October. In the present synoptic study a well marked low pressure system with a center (lat 17.53˚N/lon 84.56˚E) had persisted off the coast of West central Bay of Bengal and adjoining central Coastal AP from 29th September through 2nd October 2009. The condensation heating maintains over the Bay in a strong way and cyclonic circulation with the associated sub-synoptic scale cells of low level
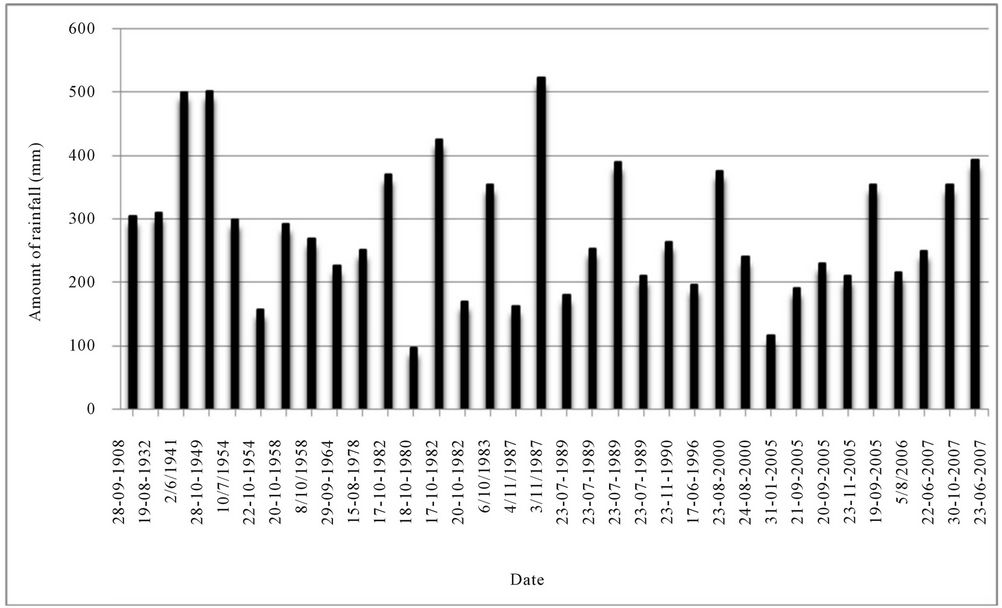
Figure 4. Record of extreme heavy rainfall events over AP.
caused moisture convergence; it has extended vertically up to 500 hPa level and high level divergence is maintained at 200 hPa level. A deep convection associated with east-west trough from Southwest Bay to Amaravathi might have propagated the westward generation spells of heavy precipitation over study region. On this day, the wide spread heavy rainfall amounts recorded at several stations (Nuzividu, Tiruvur, Achampeta, Nagarkurnool) in four districts of study region are presented in table 1. On 29th September, Amaravathi station received the highest amount of rainfall (21 cm) in 24-hour period and similar incidents were took place in other stations of four districts also. Above synoptic system has further persisted and stagnated on 30th September and slowly weakened from 1st October, 2009, which caused severe flooding activity over the study region. In this case study the accumulated rainfall was 50.5 cm at Amaravathi in four days. The life-cycle of the meso-α low pressure system, which caused floods through heavy precipitation events, is clearly seen in Meteosat imageries from 29th September to 2nd October, 2009 (Figure 5). One of the most striking aspects of the large-scale flow in the sensitive experiment at this time was the formation of a meso-α scale low pressure system over northwest Bay of Bengal (Lat 17.5˚N/Lon 81.5˚E) and strong low-level pressure gradients over the coastal Bay. The movement of the meso-low towards the coast was approximately in phase with the propagation of the heaviest precipitation over central Coastal AP and South Telengana. An examination of the vertical temperature evaluation in the mid levels of the atmosphere during this time supports the hypothesis that latent heat release influenced the movement of the meso-low as warm core air-mass moved approximately in phase with the system. All these heavy rainfall episodes are well captured by a numerical model in this case study.
3.3. Model Description
The state-of-art-of methodology used for simulating heavy precipitation episodes for the present case study is WRF Model version 3.0.1; it uses the Eulerian mass coordinate and is referred to as the Advance Research WRF (ARW) [21; www. wrf-model.org]. The model configuration includes a domain with 9-km horizontal grid spacing consisting of 148 × 148 grid points covering the study region. The model integrates 27 vertical levels where the top of the model is set at 50 hPa. One valuable feature of the WRF model is its framework for allowing the testing of numerous different physical process schemes, including cumulus parameterization, microphysics, radiation, planetary boundary layer (PBL), surface layer and land surface processes. Cumulus parameterization schemes are responsible for the sub-grid scale effects of convective and/or shallow clouds in the tropics. These schemes are mainly intended to represent vertical fluxes due to unresolved updrafts and downdrafts and compensating motion outside the clouds. They operate only on individual columns where the scheme is triggered and provided vertical heating and moistening profiles. The cumulus schemes provide the convective component of surface rainfall and are theoretically only valid for coarsed grid sizes (>10 km), where they are necessary to properly release latent heat on a realistic time scale in the convective columns [21]. But sometimes these schemes have been found to be helpful in triggering convection in 5 - 10 km grid applications. The control (SENSITIVE) experiment indicates clearly the behavior of meso-α low pressure system in association with the heavy rainfall episodes in the withdrawal period. In this study we have tested three cumulus parameterization schemes options available in the ARW. These are the Kain-Fritsch (KF: [22]), Betts-Miller-Janjic [23,24] and Grell-Devenyi [25] schemes, which has been modified based on the testing within the NCEP Eta models [26]; the schemes are all mass flux type schemes, but with differing updraft and downdraft entrainment and detrainment parameters, and precipitation efficiencies. The differences are in dynamic control, which is the method of determining cloud mass flux. Another control is the trigger, where the maximum capacity strength that permits convection can be varied.
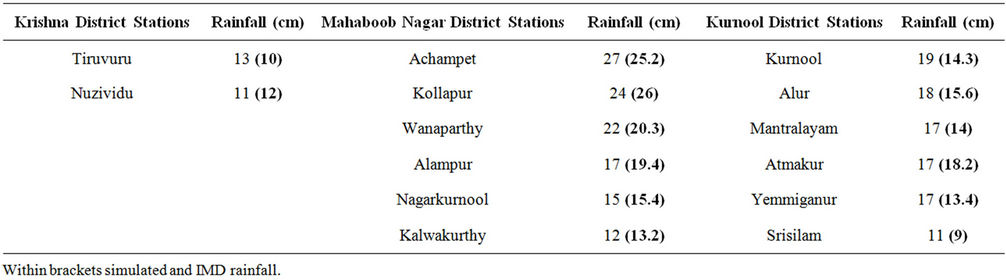
Table 1. Observed daily rain-guage data on 29th September, 2009.
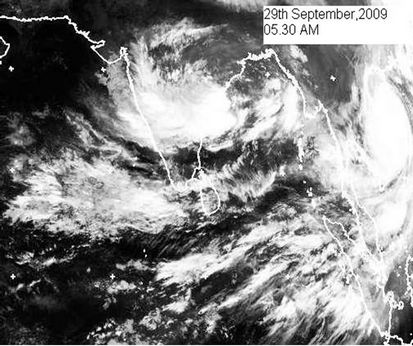
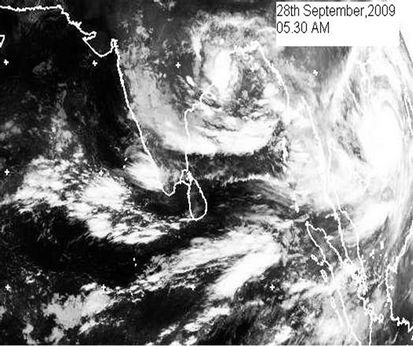
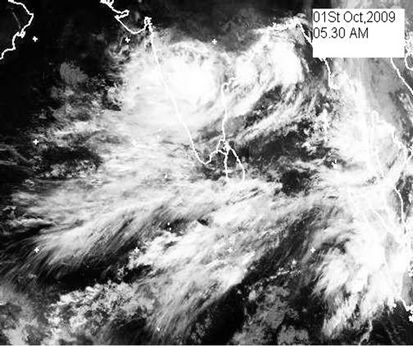
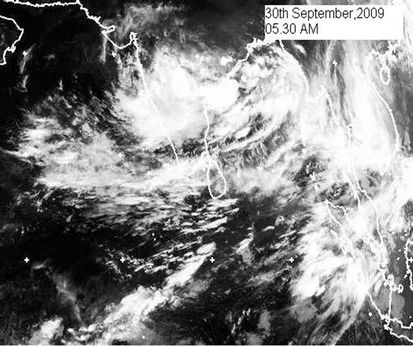
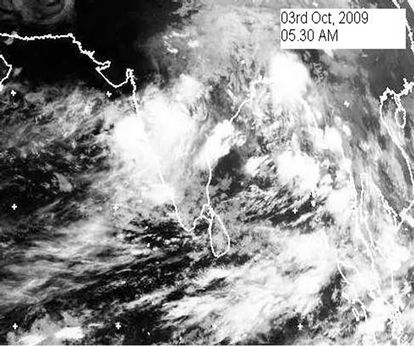
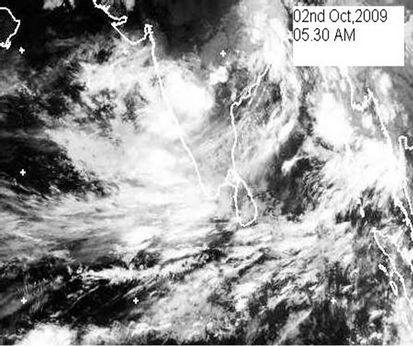
Figure 5. Life cycle of of meso-α low pressure system (Meteosat Satellite images) during 28th September to 3rd October, 2009.
Microphysics includes explicitly resolved water vapor, cloud and precipitation processes for heavy precipitation episodes. In the present study with convective conditions and grid size of 9-km, where updrafts may be resolved, and the mixed phase processes that result from the interaction of ice and water particles, such as riming that produces graupel may be dominant. Hence a relative sophisticated microphysics scheme with six classes of hydrometeors: water vapour, cloud water, rain, cloud ice, snow and graupel is included. The scheme is taken from the Purdue cloud model, and the details can be found [27]. In order to consider the atmospheric heating due to radiative flux divergence and surface downward long wave and shortwave radiation for the ground heat budget, we chose the Rapid Radiative Transfer Model (RRTM; [28]) for long wave radiation. Next, the shortwave scheme is based on Dudhia. The non-local Yonsei university PBL scheme (YSU: [29]) is used to determine the profiles of the vertical sub-grid scales fluxes due to eddy transports within well-mixed boundary layer and the stable layer above, and thus provide atmospheric tendencies of temperature, moisture(including clouds), and horizontal momentum of the entire atmospheric column. A surface layer scheme with four stability regimes following Zhang and Anthes scheme is used to calculate friction velocities and exchange coefficients that enable the calculation of surface heat and moisture fluxes by a landsurface model (LSM) and surface stress in the PBL scheme. Over water surfaces, the surface fluxes and surface diagnostics fields are computed in the surface layer scheme itself, a simple soil slab LSM [30,31] is used. Following [32] the ground temperature is calculated using a five-layer soil thermal diffusion option (with layer’s thicknesses of 1, 2, 4, 8 and 16 cm) and there is no explicit representation of vegetation effects. The soil moisture remains constant during a simulation and is defined in terms of a moisture availability that depends on land use type with only seasonal dependence. More details of the physical parameterization schemes are presented in WRF model for heavy precipitation events [29]. In this study, simulations are carried out on a Dell Precession T5400 with Linux operating system in the Department of Meteorology and Oceanography, Andhra University, Visakhapatnam.
4. Results and Discussion
4.1. The Sensitive Experiment for Circulation Changes
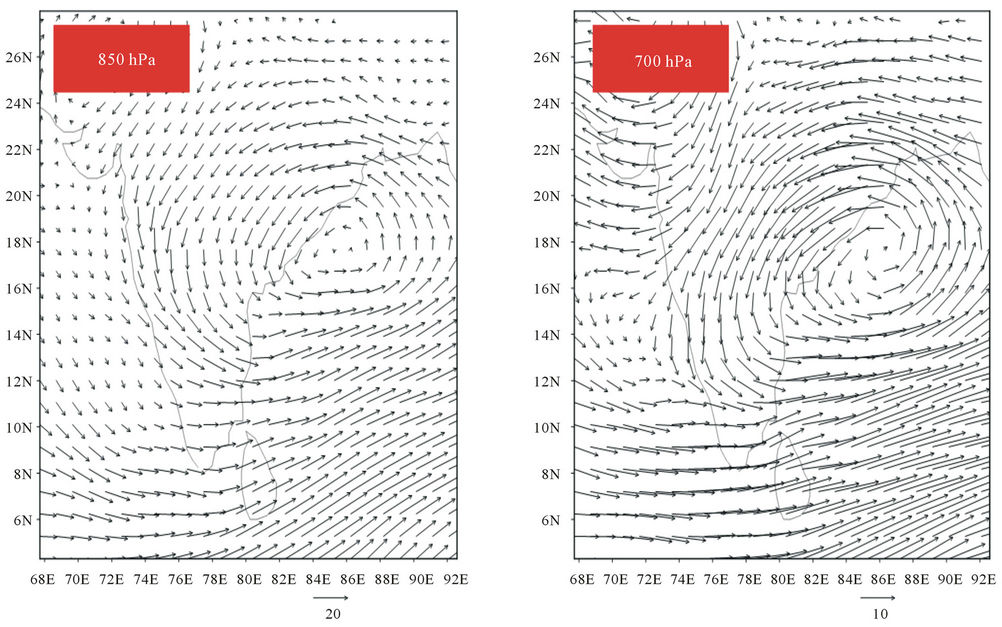
The southwest monsoon provides major portion of rainfall in its onset and retreat phases over East/west Coasts of India through heavy rainfall episodes (Figure 4). AP state in the East coast receives frequent heavy precipitation episodes during withdrawal phase of monsoon. A time series of heavy precipitation episodes that occurred (up to 50.5 cm) over AP are plotted for the period, 1908-2007 in both summer monsoon and post-monsoon seasons (figure 4) and narrated. In this climatological study 34 heavy precipitation episodes were recorded in September and October. In all these cases of heavy rainfall quantities varied from 100 - 520 mm and the frequency is increased considerable from 1960 onwards, which may coincide with global warming era. Highest frequency of heavy precipitation episodes were noticed in 2005. In the present case study the strength and intensity of meso-α system is examined using WRF model at 21 levels to examine the low-level convergence (850,700 and 500 hPa) and high level divergence (200 hPa level) from 29th September to 02nd October over AP using three parameterization scheme namely KF, BMJ and GD and compared with the observed circulation changes of IMD (not shown). Out of these schemes, KF scheme shows better organization of circulation changes on all the four days. Figure 6(a) depicts a typical example of simulated cyclonic circulation using (KF scheme) centered over West Bay of Bengal (17.5˚N/84.5˚E) at 850,700,500 and 200 hPa levels. It is interesting to note that Amaravathi station is situated very close to the Maximum amount of convergence and high amount of divergence are observed from the figure 6(a). The magnitude of simulated (northeasterly) winds is about 17 m/s at 850 hPa level. The anticlockwise direction is extended with the center of low pressure systems from 850 to 500 hPa level with decreasing intensity. The easterly wind at 200 hPa level is about 13 m/s and the circulation change is clockwise. Above circulation changes results in enhancement of convective activity and rainfall and caused heavy rainfall episodes over different parts of AP. There are about eleven episodes at different stations in four districts of heavy rainfall episodes have presented in table 2. The east-west trough from Bay of Bengal to Amaravathi station with a southward tilt with height extended up to 500 hPa level on 29th September, 2009 and caused heavy precipitation episodes. The Bay of Bengal branch is very active than the Arabian Sea branch of the Indian summer monsoon. Simulated cyclonic circulation at 500 hPa level is validated with the available Cloud Motion wind Vectors of KALPANA-1 at about 600 hPa level (Figure 6(b)). In both the cases the anti-clockwise direction is predominant. Simulated circulation changes are extended for other days also. The METEOSAT images confirm the life cycle of this meso-α system on all days. It is interesting to note that Amaravathi station and other stations in Guntur district, Mahaboob Nagar, Kurnool, Krishna districts are situated in the southwest quadrant of meso-α low pressure system which received heavy rainfall events to cause floods. On 30th September, the system has further intensified and moved westward across the Andhra coast at 0600 UTC. Later, it maintained stationary till 1st October, 2009 (2100 UTC). Finally, the system weakened and moved further northwestward and caused floods to continue over the study region on 2nd October, 2009 and thus the meso-α system provided 50.5 cm of accumulated rainfall over Amaravathi station alone. Thus, the present
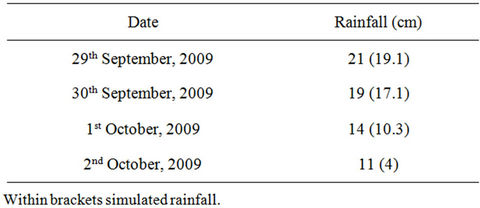
Table 2. Comparison of KF simulated and observed rainfall at Amaravathi station.
 (a)
(a)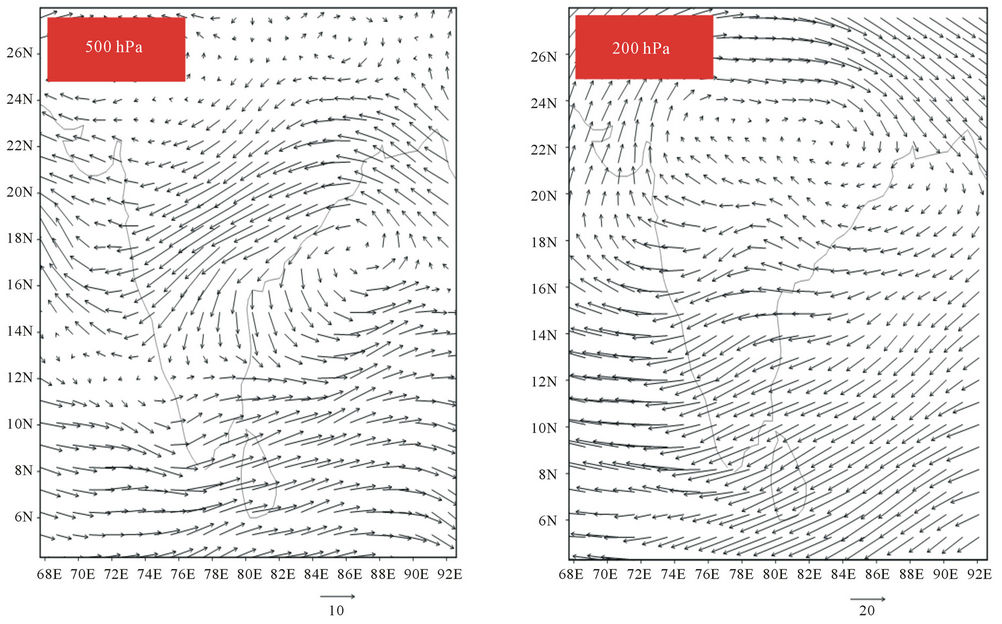 (b)
(b)
Figure 6. Simulated winds around meso-alpha low pressure system at different levels on 29th September, 2009.
case study coincides with the climatological study of frequent heavy precipitation events during the process of withdrawal period of monsoon over AP state in September and October months. Present dynamical characteristics of the meso-scale system suggests to examine detailed thermodymaical features over the study region for better understanding of heavy precipitation episodes.
4.2. Simulation of Thermodynamical Characteristics of Meso-α System
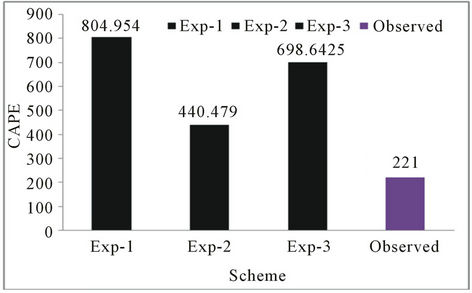
As CAPE and CINE are the two prime quantities for understanding of conditional instability of the tropical atmosphere, the thermodynamic characteristics of environment around meso-α system are simulated with KF, BMJ and GD schemes from 29th September through 2nd October, 2009. Of them, the KF scheme simulates CAPE to a tune of 1001 J/kg around Amaravthi station whereas the observed CAPE (nearby station; lat 17˚22'N/lon 78˚29'E) from Wyoming University was 1003.2 J/kg on 29th September at 1800 UTC (Figure 7(a)) when the heavy precipitation episodes occurred over some parts of AP. Next day the simulated CAPE is reduced to a tune of 996 J/kg when the observed CAPE was 1001 J/kg at 1200 UTC (Figure 7(c)) over the study region. Similar study is extended for other two days where low CAPE values are noticed because of stationarity of meso-α system. The simulated highest amount of CAPE is observed with KF scheme (1001 J/kg) where a strong updraft and downdraft interactions prevailed when compared with the BMJ and GD schemes. Using the same schemes, similarly the simulated CINE is also well represents the thermodynamical characteristics with low values relating to low pressure system for four days which are close to the observations of Wyoming University. For example on 29th September the simulated CINE value is 40 J/kg around Amaravtahi station (Figures 7(b) and (d)) when the observed value from the Wyoming University is around 60 J/kg. Thus high magnitude of CAPE and low value of CINE are keynote characteristics of meso-α system that caused heavy rainfall episodes over some parts of AP state. It will be of great interest to simulate rainfall episodes near Amaravathi station in the light of above noteworthy dynamic and thermodynamic characteristics of present rain-bearing system of the Bay of Bengal.
4.3. Simulation of Rainfall Due to Meso-α Low Pressure System
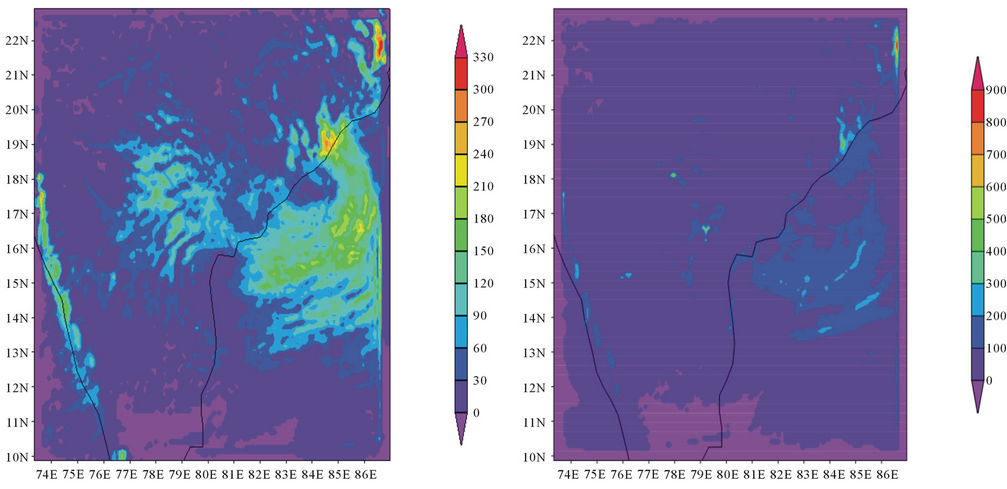
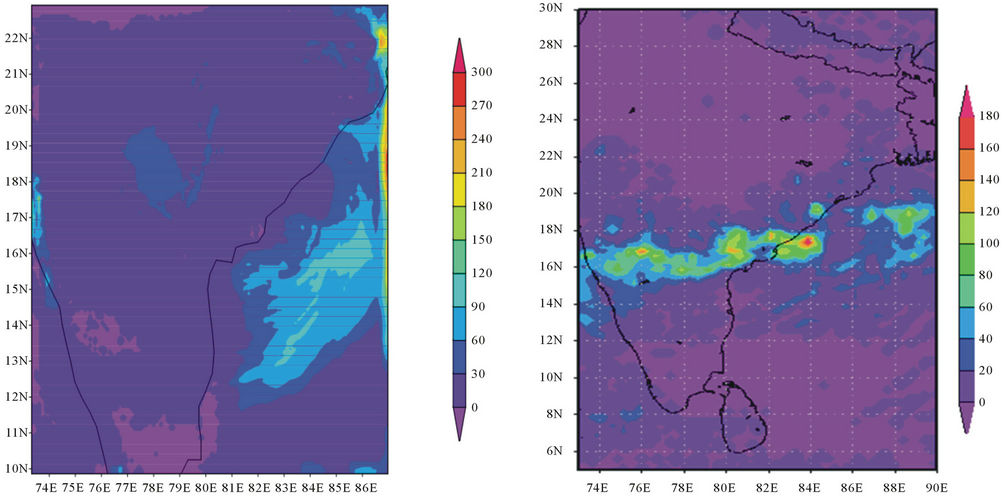
In this sensitive experiment authors made use of KF, BMJ and GD schemes to simulate heavy precipitation events over the study region during 29th September through 2nd October, 2009. Figure 8(a) shows model simulated rainfall using different schemes and TRMM rainfall over the study region on 29th September, 2009when the heavy rainfall events occurred over some parts of AP. Of the above three cumulus parameterization schemes KF scheme simulates heavy precipitation episodes like in the previous studies and they are very close to the observed and satellite derived TRMM 3B42RT rainfall near Amaravthi station. The Cloud Top Temperatures (CTT) derived from KALPANA-1 (−70˚C) further supports heavy precipitation episodes (Figure 8(b)). For example, the simulated accumulated rainfall amounts near Amaravathi station are 19.1 cm, 17.1 cm, 10.3 cm and 4 cm when the observed rainfall amounts were 21 cm, 19 cm, 14 cm and 11 cm respectively from 29th September to 2nd October, 2009 (Table 1). Thus the accumulated simulated rainfall is 50.5 cm whereas the IMD recorded an amount of 65 cm on four days at Amaravathi in Guntur district. Thus there is an underestimation of precipitation through this simulation study by about 9.5% on 29th September, 2009. Study is extended for the other stations nearby Amaravathi station which is presented in Table 2; it shows the simulated and observed environmental rainfall amounts at different stations in four districts namely Tiruvuru (11 cm), Nuzividu (17 cm), Achampeta (18 cm), Kurnool (26 cm) and Nagarkurnool (10.5 cm) and thus the simulated rainfall varied from 10.5 to 26 cm, and the rainfall quantities are underestimated by about 10% on 29th September. On 29th and 30th September the meso event stagnated and maintained same intensity which results in closeness of observed and simulated rainfall quantities. Later, the difference between them is enhanced. This may be due to the fact that there is a difference in the updraft and downdraft cumulus congestus clouds associated with the low pressure system. This study clearly demonstrates that monsoon heavy precipitation episodes can be better simulated using WRF-ARW model in the retreating phase of the southwest monsoon season over Andhra Pradesh state in this case study.
5. Summary and Conclusions
Heavy precipitation episodes are very frequent over AP State during withdrawal phase of the southwest monsoon season. In the present case study, strong low-level convergence of moist air in the presence of convectively unstable stratification is responsible for the environmental heavy rainfall observed over the study region on 29th September through 2nd October, 2009.
In this CNTRL simulation of WRF analysis of convective instability, latent heat flux and equivalent potential temperature showed maximum quantities at the palaces of heavy rainfall episodes.
The above results may be further improved by downscaling technique with a combination of statistical and
(a) (b) (c) (d)
Figure 7. Accumulated rainfall for 24 hours over the study region on by (a) KF; (b)BMJ; (c) GD; (d) TRMM 3B42RT rainfall on 29th Septemebr 2009.
dynamical methods for obtaining the extreme heavy precipitation episodes. Further, the implementation of sophisticated assimilation technique like three dimensional variational assimilation system would produce even more realistic initial conditions for mesoscale model integrations in future.
6. Acknowledgements
The first and third authors are thankful to Department of Science and Technology, Government of India, New Delhi for their financial support through research projects (No. HR/UR/07/2010) and (SR/FTP/ES-31/2008, dt. 21st May, 2009) respectively. The authors are grateful to
 (a)
(a)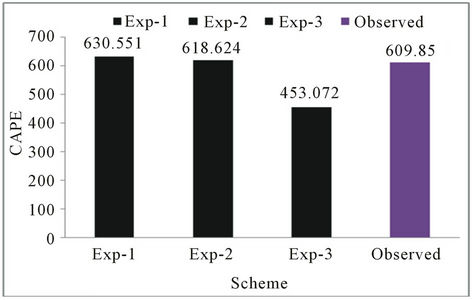 (b)
(b)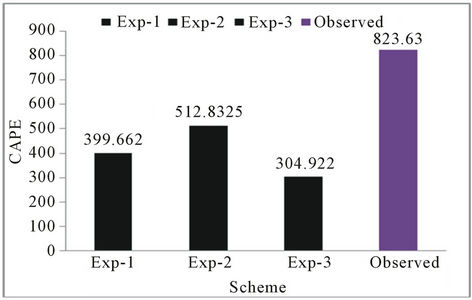 (c)
(c)
Figure 8. Intercomaparison of the simulated (a)-(c) by KF, BMJ and GD schemes and Uwoyming university observed CAPE (J/Kg) values over study region on 29th September, 2009.
NCAR, USA team for providing the source code of WRF model (www. wrf-model.org). The authors are also thankful to NCEP/NCAR team for providing reanalysis and FNL datasets.
REFERENCES
- O. S. R. U. B. Kumar, K. M. Krishna and S. R. Rao, “Simulation of Environmental Heavy Rainfall Episodes during June and July 2006—A Case Study,” Canadian Journal of Pure & Applied Sciences, Vol. 2, No. 1, 2008, pp. 211-220.
- O. S. R. U. B. Kumar, S. R. Rao and K. M. Krishna, “Study of Intra-Seasonal Oscillation and Circulation Changes during Summer Monsoon Season over India,” First International Workshop on the Frontiers of Atmospheric Physics and Technology, Yogi Vemana University, Kadapa, February 20-22, 2008.
- O. S. R. U. B. Kumar, S. R. Rao, S. Ranganathan and S. S. Raju, “Role of Intra-Seasonal Oscillations on Monsoon Floods and Droughts over India,” Asia Pacific Journal of Atmospheric Sciences, Vol. 46, No. 1, 2010, pp. 21-28.
- O. S. R. U. B. Kumar, S. R. Rao, and S. S. Raju, “Study of Interannual and Intra-Seasonal Variability of Summer Monsoon Circulation over India,” Canadian Journal of Pure and Applied Sciences, Vol. 4, No. 2, 2010, pp. 1199- 1206.
- I. Subbaramayya and O. S. R. U. B. Kumar, “The Onset and the Northern Limit of the South-West Monsoon over India,” The Meteorological Magazine, Vol. 107, 1978, pp. 37-48.
- I. Subbaramayya and O. S. R. U. B. Kumar, “Variations of the Onset of Summer Monsoon over India,” The Meteorological Magazine, Vol. 116, No. 1383, 1987, pp. 309- 317.
- B. Dey and O. S. R. U. B. Kumar, “Himalayan Winter Snow Cover Area and Summer Monsoon Rainfall over India,” Journal of Geophysical Research, Vol. 88, No. C9, 1983, pp. 5471-5474. doi:10.1029/JC088iC09p05471
- B. Dey and O. S. R. U. B. Kumar, “Himalayan Summer Snow Cover and Withdrawal of the Indian Summer Monsoon,” Journal of Climate and Applied Meteorology, Vol. 14, No. 8, 1985, pp. 865-868. doi:10.1175/1520-0450(1985)024<0865:HSSCAW>2.0.CO;2
- P. A. Francis and S. Gadgil, “Intense Rainfall Events over the West Coast of India,” Meteorology and Atmospheric Physics, Vol. 94, No. 1-4, 2006, pp. 27-42. doi:10.1007/s00703-005-0167-2
- S. Taraphdar, J. Sanjay and P. Mukhopadhyay, “On Northward Movement of Convergencezones along West Coast of India in a Real Time Forecast,” Meteorology and Atmospheric Physics, Vol. 104, No. 3-4, 2009, pp. 177- 189. doi:10.1007/s00703-009-0025-8
- A. J. Litta, B. Chakrapani and K. Mohankumar, “Mesoscale Simulation of an Extreme Rainfall Event over Mumbai, India, Using a High-Resolution MM5 Model,” Meteorological Applications, Vol. 14, No. 3, 2007, pp. 291-295. doi:10.1002/met.31
- O. S. R. U. B. Kumar, S. R. Rao and K. M. Krishna, “Role of Cumulus Parameterization Schemes in Simulating Heavy Rainfall Episodes off the Coast of Maharashtra Coast during 28th June-4th July, 2007,” Meteorology and Atmospheric Physics, Vol. 105, 2009, pp. 167-179.
- D. V. B. Rao and S. B. Ratna, “Mesoscale Characteristics and Prediction of an Unusual Extreme Heavy Precipitation Event over India Using a High Resolution Meso Scale Model,” Atmospheric Research, Vol. 95, No. 2-3, 2010, pp. 259-269.
- A. Routray, U. C. Mohanty, K. Das Ananda and N. V. Sam, “Study of Heavy Rainfall Event over West Coast of India Using Analysis Nudging in MM5 during ARMEX-I,” Mausam, Vol. 56, No. 1, Special Issue on ARMEX, 2005, p. 107.
- A. Routray, U. C. Mohanty, D. Niyogi, S. R. H. Rizvi and K. K. Osuri, “Simulation of Heavy Rainfall Events over Indian Monsoon Region Using WRF-3DVAR Data Assimilation System,” Meteorology and Atmospheric Physics, Vol. 106, No. 1-2, 2010, p. 20.
- M. Mohapatra and U. C. Mohanty, “Some Characteristics of Very Heavy Rainfall over Orissa during Summer Monsoon Season,” Journal of Earth System Science, Vol. 114, 2005, pp. 17-36.
- C. V. Srinivas, R. Venkatesan, D. V. B. Rao and D. Hariprasad, “Numerical Simulation of Andhra Severe Cyclone (2003): Model Sensitivity to Boundary Layer and Convection Parameterization,” Pure and Applied Geophysics, Vol. 164, No. 8-9, 2007, pp. 1-23. doi:10.1007/s00024-007-0228-1
- A. K. Bohra, S. Basu, E. N. Rajgopal, G. R. Iyengar, M. Das Gupta, R. Ashrit and B. Athiyaman, “Heavy Rainfall Episode over Mumbai on 26 July 2005: Assessment of NWP Guidance,” Current Science, Vol. 90, No. 9, 2006, pp. 1188-1194.
- V. F. Xavier, A. Chandrasekar, R. Singh and B. Simon, “The Impact of Assimilation of MODIS Data for the Prediction of a Tropical Low Pressure System over India Using a Mesoscale Model,” International Journal of Remote Sensing, Vol. 27, No. 20, 2006, pp. 4655-4676.
- V. G. Rakesh, R. Singh, P. K. Pal and P. C. Joshi, “Quantitative Evaluation of PSU-NCAR MM5 Forecasts over Indian Region during Monsoon 1998,” Proceedings of SPIE: Remote Sensing and Modeling of the Atmosphere, Oceans, and Interactions, Vol. 64040N, 2006. doi:10.1117/12.693963
- W. C. Skamarock, J. B. Klemp, J. Dudhia, D. O. Gill, D. M. Barker, W. Wang and J. G. Powers, “A Descriptive of the Advanced Research WRF Version 3.1,” NCAR Tech Note NCAR/TN-468_STR, 2005, p. 88.
- J. S. Kain and J. M. Fritsch, “Convective Parameterization for Mesoscale Models: The Kain-Fritsch Scheme, the Representation of Cumulus Convection in Numerical Models,” In: K. A. Emanueal and D. J., Raymond, Eds., American Meteor Society, 1993, p. 246.
- A. K. Betts and M. J. Miller, “A New Convective Adjustment Scheme, Part II; Single Column Tests Using GATE Wave, BOMEX, and Arctic Air-Mss Data Sets,” Quarterly Journal of the Royal Meteorological Society, Vol. 112, 1986, pp. 693-709. doi:10.1256/smsqj.47307
- Z. I. Janjic, “The Step-Mountain eta Coordinate Model: Further Developments of the Convection, Viscous Sub Layer, and Turbulence Closure Schemes,” Monthly Weather Review, Vol. 122, No. 5, 1994, pp. 928-945. doi:10.1175/1520-0493(1994)122<0927:TSMECM>2.0.CO;2
- G. A. Grell, and D. Deveneyi, “A Generalized Approach to Parameterizing Convection Combining Ensemble and Data Assimilation Techniques,” Geophysical Research Letters, Vol. 29, No. 140, 2002, pp. 1693-1696.
- E. J. Mlaqwer, S. J. Taubman, P. D. Brown, M. J. Lacono and S. A. Clough, “Radiative Transfer for Inhomogeneous Atmosphere: RRTM, a Validated Correlated k Model for the Long Wave,” Journal of Geophysical Research, Vol. 102. No. 14, 1997, pp. 16663-16682. doi:10.1029/97JD00237
- S. H. Chen and W. Y. Sun, “A One-Dimensional Time Dependent Cloud Model,” Journal of the Meteorological Society of Japan, Vol. 80, No. 1, 2002, pp. 99-118.
- Y. Noh, W. G. Cheon, S. Y. Hong and S. Raasch, “Improvement of the K-Profile Model for the Planetary Boundary Layer Based on Large Eddy Simulation Data,” Boundary-Layer Meteorology, Vol. 107, No. 2, 2003, pp. 401-427. doi:10.1023/A:1022146015946
- J. Sanjay, S. Joshi and S. Taraphdar, “Numerical Simulation of Heavy Rainfall over Ratnagiri on May 30, 2006 using WRF,” Vayu Mandal, Vol. 33, No. 1-4, Special Issue on TROPMET-2006, 2007, pp. 39-50.
- D. L. Zhang and R. A. Anthes, “A High-Resolution Model for Planetary Boundary Layer Sensitivity Tests and Comparisons with SESAME-79 Data,” Journal of Applied Meteorology, Vol. 21, No. 11, 1982, pp. 1594-1609. doi:10.1175/1520-0450(1982)021<1594:AHRMOT>2.0.CO;2
- J. Dudhia, “Numerical Study of Convection Observed during the Winter Monsoon Experiment Using a Mesoscale Two-Dimensional Model,” Journal of the Atmospheric Sciences, Vol. 46, No. 20, 1989, pp. 3077-3107. doi:10.1175/1520-0469(1989)046<3077:NSOCOD>2.0.CO;2
- J. Dudhia, “A Multi-Layer Soil Temperature Model for MM5,” Preprints of the 6th PSU/NCAR Meso Scale Model Users’ Workshop, Boulder, 22-24 July 1996, pp. 49-50.