Food and Nutrition Sciences
Vol.10 No.01(2019), Article ID:89982,8 pages
10.4236/fns.2019.101009
Temporal Sequence of Sweetness Perception in Fruit-Flavored Tea: A Descriptive Report on the Influence of Sucrose Concentrations on the Sensation
Suzuka Akemura, Nomo Hasebe, Madoka Kasahara, Honami Sakai, Eri Sanada, Yozo Miyaoka*
Department of Health and Nutrition, Niigata University of Health and Welfare, Niigata, Japan

Copyright © 2019 by author(s) and Scientific Research Publishing Inc.
This work is licensed under the Creative Commons Attribution International License (CC BY 4.0).
http://creativecommons.org/licenses/by/4.0/


Received: December 27, 2018; Accepted: January 15, 2019; Published: January 18, 2019
ABSTRACT
The goals of this study were to examine, using the temporal dominance of sensations (TDS) method, the effects of 1) the sucrose concentration on the temporal sequence of sweetness perception in four fruit-flavored (lemon, peach, strawberry, and vanilla) teas with 0.05, 0.15, and 0.25 M sucrose; and 2) participants’ sex on this temporal sequence. Twenty-four healthy young adults were assigned to female (n = 12) and male (n = 12) groups. Both groups evaluated five sensory attributes in 12 samples (four fruit-flavored teas, each with three sucrose concentrations). As in our preceding study [1], two sensations, sweetness and fruitiness, were dominant after ingesting the 12 teas in both groups, but the temporal sequence of sweetness perception differed between the two groups. On average, the male group reported the first appearance of sweetness earlier in the samples with 0.05 M sucrose compared with the female group, with the samples containing 0.15 and 0.25 M sucrose. The average durations of the sweetness sensation were different between the male and female groups as well as among the sucrose concentrations and the four flavors tested.
Keywords:
Tea, Sweetness, Flavor, Sucrose Concentration, Temporal Dominance of Sensations, Sex Differences

1. Introduction
The temporal dominance of sensations (TDS) method has been used mainly to discriminate the quality of drinks and foods that are similar to each other by understanding the temporal sequence of the perception of their sensory attributes, such as sweetness and fruitiness [2] . Drinks and foods consumed in everyday life usually have flavors perceived as a result of interactions between taste, smell (aroma), and trigeminal sensations [3] [4] . Previous studies have shown that similar samples can elicit different TDS curves [5] [6] . One study [6] that contributed to establishing the TDS method examined 12 sensory attributes in samples made using five different recipes of the same kind of dairy product. The other study [5] used samples of blackcurrant squash composed of different sweeteners and ingredients, and examined nine sensory attributes. These studies illustrated specific TDS curves for each sample: for example, a couple of sensory attributes (pasty and diacetyl in [6] and natural sweetness and acidic in [5] ) were dominant in the curves and differed in the times taken to be first perceived and in the durations of the sensations. However, these studies, and others, focused on the differences among samples rather than on the perception of sensory attributes themselves [5] . Besides, these studies paid little attention to the influence of participants’ sex on the results (e.g., 10 females and one male [5] ). Our recent study documented sex-based differences in the temporal sequence of sweetness and fruitiness in sweetened and strawberry-flavored teas with the TDS method [1] . This study suggested that the sucrose concentration plays an important role in determining the temporal sequence of sensations. Here, we examine the influence of sucrose concentrations on the temporal sequence of sweetness perception in fruit-flavored tea with the TDS method, taking into account the participants’ sex.
2. Materials and Methods
2.1. Participants
Twenty-four healthy young adults (12 males and 12 females; 20.5 ± 1.3 years (mean age ± standard deviation)) participated in this study after providing informed consent. All the volunteers were recruited from students of Niigata University of Health and Welfare. The participants were assigned to female and male groups according to their sex. None of the participants had subjective problems in gustatory or olfactory functions and passed both gustatory and olfactory (Five Standard Odors for selection of panel members set of center concentrations, Daiichi Yakuhin Sangyo Co., Ltd., Tokyo, Japan) acuity tests. The solutions used for the gustatory test were prepared based on the recognition thresholds of the five fundamental tastes for young Japanese adults [7] [8] . The Ethics Committee of Niigata University of Health and Welfare approved the experiments (#18021-180710). The experiment was conducted from July, 2018 to September.
2.2. Samples
Based on our preceding study [1], four fruit-flavored teas were used as samples in this study. A non-flavored and sugarless tea (Mutou koucha, Kirin Beverage Company, Ltd., Tokyo, Japan) was used as a starting material for flavored teas. Sucrose was added to all samples at three concentrations: 0.05, 0.15, and 0.25 M. The three concentrations were determined by preliminary experiments. A 0.5-M sucrose sample that was used at the early stages of study was not used at the later stages as the participants reported that it was too sweet. A concentration, 3.0 µl/ml, of four commercially available flavors (lemon, strawberry, peach, and vanilla) was added to the samples.
2.3. Recording Tools
A TDS system (J-SEMS TDS&TI, MediaEye, Tokyo, Japan) was used participants and analyze sensory evaluation data. The recording system consisted of a base unit and four cordless extension units of tablet devices, so a maximum of four participants could use the system at the same time. As in our previous study [1], four items that elicit four different and active sensations, that is, sweetness, sourness, astringency, and fruitiness, were utilized for sensory evaluation. The passive sensation of “flavorlessness” was also utilized to clarify the sensation when a participant selected none of the four items.
2.4. Procedures
After training on the TDS system, each participant was instructed to properly rinse their mouth with tap water. For practice purposes, they were presented a non-flavored sample (10 ml). This was followed by 12 (four flavors × three sucrose concentrations) flavored samples (10 ml each). The 12 samples were presented in a random order, but each sample was presented in an increasing concentration of sucrose from 0.05 to 0.15 and 0.25 M. Each sample was served at 31˚C. The participants were instructed to drink, taste, and swallow each sample and to press one of the five item evaluation buttons on a tablet device that recorded their responses. The command of swallowing was issued to participants 3 s after ingestion. An interval of 30 s was set from the start to the end of each evaluation, and the participants were instructed to rinse their mouths with tap water after the end of each trial. A 1-min interval was allowed between trials. Participants were asked not to discuss their evaluations with each other.
2.5. Data and Statistical Analyses
Comma separated values formatted data were obtained from the TDS system and processed using the R programming language to calculate basic statistics, such as averages and standard deviations. Only one sensation, sweetness, was subjected to the following analysis in this study. First, the TDS curves of the female and male groups were obtained, as in our previous paper [1] . Second, the average times from the start of ingestion of each sample to the reported sensation of sweetness exceeding the significant level were calculated in each group, and then differences in the times between the two groups were calculated by subtracting the average time in the female group from that in the male group. The same calculations were repeated 12 times (four flavors × three sucrose concentrations). Finally, the average durations of the sensation exceeding a significant level were calculated in each group, and then 12 differences in the durations between the two groups were calculated by subtracting the average duration in the female group from that in the male group. Since this study aimed to describe the temporal sequence of sweetness perception, we applied no particular statistical tests to the obtained data.
3. Results
Only two of the five sensations evaluated in this study, sweetness and fruitiness, showed consistent and significant responses in the samples used (Figure 1). The sensation of sweetness appeared first and was followed by that of fruitiness, as shown in the curves obtained from the combined data of the female and male groups. The other sensations were not perceived at a significant level, except the sensation of flavorlessness, which was reported for about 3 s in the last stage of the 30-s interval.
The times from the start of ingestion to reporting a significant level of sweetness differed between the two groups and among the three sucrose concentrations (Figure 2). The overall average times across the four flavors for each sucrose concentration were −2.7 s (0.05 M sucrose), +2.7 s (0.15 M sucrose), and +0.3 s (0.25 M sucrose). At the concentration of 0.05 M sucrose, the male group reported the sensation of sweetness earlier than the female group in all four flavors used (i.e., negative values in Figure 2). By contrast, at concentrations of 0.15 M and 0.25 M sucrose, the female group reported the sensation of sweetness earlier than the male group in all flavors, except vanilla flavor at 0.15 M (i.e., positive values). Additionally, the absolute largest times reduced clearly at the highest sucrose concentration: that is, the values were 4.0 s (0.05 M) and 6.2 s (0.15 M) at lower sucrose concentrations, and that was 0.49 s at the concentration of 0.25 M sucrose.
The average durations of the sweetness sensation varied among the three sucrose concentrations and among the four flavors (Figure 3). The overall average durations for the three sucrose concentrations across the flavors were −1.6 s (0.05 M sucrose), −1.9 s (0.15 M sucrose), and +1.4 s (0.25 M sucrose). The situations of the durations related to sucrose concentrations were more complicated and less consistent than the times mentioned above: for example, the duration for the strawberry-flavored sample showed a positive value at a 0.05-M sucrose concentration, but the other three samples showed negative values, whereas a completely opposite situation occurred at a 0.25-M sucrose concentration (Figure 3).
4. Discussion
A previous study using the TDS method showed temporal changes in six sensations, including sweetness (by sucrose) and fruitiness (by strawberry flavor), 100 s
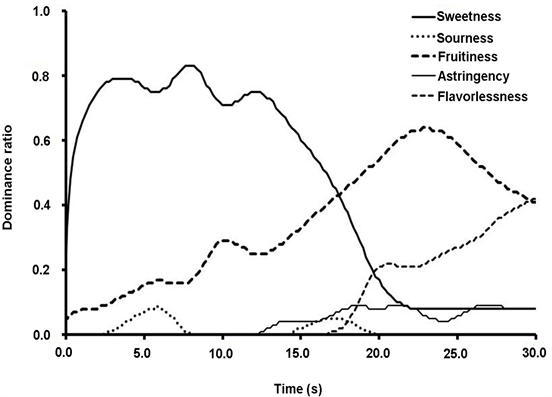
Figure 1. Sample TDS curves of sweetened flavored teas. Average TDS curves of the five sensory items reported from the beginning of sample ingestion (tea with 0.25 M sucrose and strawberry flavor) to the end of the 30-s evaluation, showing the combined data from the female and male groups. A horizontal dotted line indicates the significant level (0.33). Note that sweetness exceeded the significant level before fruitiness.
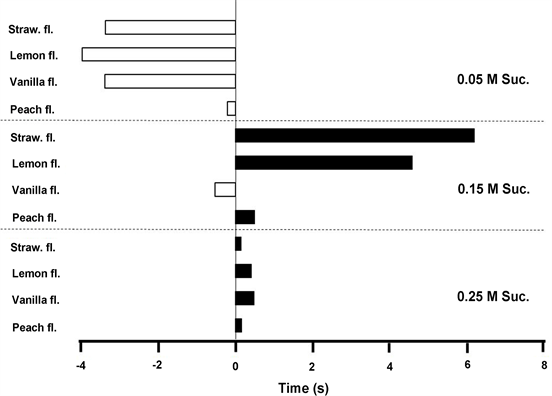
Figure 2. Differences in times for exceeding the significant level between the female and male groups. Each horizontal bar indicates a value that is the result of subtracting an average time from the start of ingestion of a sample to exceeding the significant level for the female group from that for the male group. Closed and open bars indicate positive (the male group exceeded the significant level earlier than the female group) and negative (the male group exceeded the level later than the female group) values, respectively. See the text for the details.

Figure 3. Differences in durations for exceeding the significant level between the female and male groups. Each horizontal bar indicates a value that is the result of subtracting an average sweetness sensation duration for the female group from that for the male group. Closed and open bars indicate positive (the male group took a longer duration than the female group) and negative (the male group took a shorter duration than the female group) values, respectively. See the text for the details.
after ingestion of the tea sample [9] . It demonstrated that of the six sensations, only sweetness and fruitiness reached a significant level, similar to the present study (Figure 1). The results of both studies are similar, but there is a slight difference between them: that is, both sweetness and fruitiness reached the significant level at the beginning of the ingestion in the previous study (Figure 3 in [9] ), whereas sweetness reached a significant level before fruitiness in this study (Figure 1). Differences in the concentrations of both sucrose and strawberry flavor may explain the differences between these studies. The previous study, like most others in the field [2], used a mixed group consisting of female and male participants. This could be one reason for the similarity between the results in the previous study [9] and this one; the TDS curves shown (Figure 1) were derived from both female and male participants.
Since sweetened black teas commercially available in Japan contain 0.05-M sucrose on average [10], our preceding study [1] used that concentration of sucrose to match the commercial teas. This study suggested that the sex of participants could affect the temporal sequence of the two major sensations, sweetness and fruitiness, elicited by flavored teas. In the female group, sweetness appeared earlier than in the male group in a strawberry-flavored sample [1] . However, the present study showed an opposite result (Figure 2). The discrepancy really surprised us, and at least two possibilities could explain it. One could be the difference in the numbers of participants: there were fewer in the preceding [1] and in this study (n = 12 and 24, respectively) than in [6] (n = 32). Also, a much lower concentration of sucrose (0.05 M) was used in comparison to previous studies [11] [12], which could make it difficult for participants to properly evaluate the sensations elicited by such a weak solution.
The TDS method is qualitative rather than quantitative [2] . The present study did not carry out statistical analysis of the collected data, but aimed to demonstrate sex-based differences in the temporal sequence of sweetness perception elicited by fruit-flavored teas containing three different sucrose concentrations. We found that sweetness appeared earlier in the male group than in the female group at the lowest sucrose concentration, whereas the reverse was true at the highest concentration (Figure 2). With regard to the durational data (Figure 3), the sex-based differences were less clear and seemed dependent not only on the sucrose concentrations but also on the flavors. It is necessary to conduct more experiments and precise statistical analyses to establish if there are sex-based differences in the duration of sweetness sensation elicited by fruit-flavored teas.
5. Conclusion
In conclusion, two sensations, sweetness and fruitiness, appeared dominantly after ingesting four sweetened fruit-flavored teas (lemon, peach, strawberry, and vanilla) as determined by the TDS method in both female and male groups. The times of appearance and the durations of the sensation of sweetness were different between the female and male groups as well as among the concentrations (0.05, 0.15, and 0.25 M) of sucrose and among the four flavors tested.
Acknowledgements
This study was partially supported by a Grant-in-Aid for Scientific Research from the Ministry of Education, Science and Culture of Japan (No. 16K00830 to YM). The authors thank Dr. Satomi Miyaoka for her kind lend of the TDS/TI system and also Dr. Ichiro Ashida for his help in analyzing the data of this study. The authors would like to thank Enago (http://www.enago.jp/) for the English language review.
Conflicts of Interest
The authors declare no conflicts of interest regarding the publication of this paper.
Cite this paper
Akemura, S., Hasebe, N., Kasahara, M., Sakai, H., Sanada, E. and Miyaoka, Y. (2019) Temporal Sequence of Sweetness Perception in Fruit-Flavored Tea: A Descriptive Report on the Influence of Sucrose Concentrations on the Sensation. Food and Nutrition Sciences, 10, 110-117. https://doi.org/10.4236/fns.2019.101009
References
- 1. Sato, E., Tamagawa, E., Naito, K., Nirasawa, M., Ashida, I., Miyaoka, S. and Miyaoka, Y. (2018) Influence of Sex Differences on Temporal Sequence of Sensations after Ingesting Fruit-Flavored Tea—A Preliminary Study. Food and Nutrition Sciences, 9, 676-682. https://doi.org/10.4236/fns.2018.96051
- 2. Di Monaco, R., Su, C., Masi, P. and Cavella, S. (2014) Temporal Dominance of Sensations: A Review. Trends in Food Science & Technology, 38, 104-112. https://doi.org/10.1016/j.tifs.2014.04.007
- 3. Prescott, J. (1999) Flavour as a Psychological Construct: Implications for Perceiving and Measuring the Sensory Qualities of Foods. Food Quality and Preference, 10, 349-356. https://doi.org/10.1016/S0950-3293(98)00048-2
- 4. Small, D.M. and Prescott, J. (2005) Odor/Taste Integration and the Perception of Flavor. Experimental Brain Research, 166, 345-357. https://doi.org/10.1007/s00221-005-2376-9
- 5. Ng, M., Lawlor, J.B., Chandra, S., Chaya, C., Hewson, L. and Hort, J. (2012) Using Quantitative Descriptive Analysis and Temporal Dominance of Sensations Analysis as Complementary Methods for Profiling Commercial Blackcurrant Squashes. Food Quality and Preference, 25, 121-134. https://doi.org/10.1016/j.foodqual.2012.02.004
- 6. Pineau, N., Schlich, P., Cordelle, S., Mathonniere, C., Issanchou, S., Imbert, A., Rogeaux, M., Etievant, P. and Koster, E. (2009) Temporal Dominance of Sensations: Construction of the TDS Curves and Comparison with Time-Intensity. Food Quality and Preference, 20, 450-455. https://doi.org/10.1016/j.foodqual.2009.04.005
- 7. Toyota, Y., Okutsu, F., Matsukawa, T., Kusano, T., Negoro, R., Hamasaka, H., Maki, S., Endo, M., Matsui, A. and Ohkawa, S. (2014) Construction of a Screening Test for Gustatory Function in Four Basic Tastes (In Japanese with English Abstract). The Journal of Japanese Society of Stomatognathic Function, 20, 115-129. https://doi.org/10.7144/sgf.20.115
- 8. Matsumoto, M., Nakaya, S. and Ueda, F. (1973) On the Sensitivity of the Taste of the Students at Joshi Eiyo Daigaku, Part III: On the Set of the Standard Solution of Five Primary Tastes at Joshi Eiyo Daigaku. The Journal of Kagawa Nutrition University, 4, 69-72.
- 9. Di Monaco, R., Miele, N.A., Volpe, S., Picone, D. and Cavella, S. (2014) Temporal Sweetness Profile of MNEI and Comparison with Commercial Sweeteners. Journal of Sensory Studies, 29, 385-394. https://doi.org/10.1111/joss.12119
- 10. Yamamoto, S., Taniguchi, H., Sarukura, N., Tsao, H., Tseng, A. and Takeichi, H. (2009) Development of a Food Composition Database of Monosaccharides and Disaccharides in Sweet Snacks and Beverages (In Japanese with English Abstract). Journal of the Japan Dietetic Association, 52, 22-25.
- 11. Frank, R.A. and Byram, J. (1988) Taste-Smell Interactions Are Tastant and Odorant Dependent. Chemical Senses, 13, 445-455. https://doi.org/10.1093/chemse/13.3.445
- 12. Green, B.G. and Nachtigal, D. (2012) Somatosensory Factors in Taste Perception: Effects of Active Tasting and Solution Temperature. Physiology & Behavior, 107, 488-495. https://doi.org/10.1016/j.physbeh.2012.05.010