Food and Nutrition Sciences
Vol. 4 No. 11 (2013) , Article ID: 37634 , 10 pages DOI:10.4236/fns.2013.411148
Consumption of Oriental Plums Improved the Cognitive Performance and Modulated the Cerebral Neurodegeneration-Related Protein Expressions in Rats with Nicotinamide/Streptozotocin-Induced Diabetes
![]()
1School of Healthcare Management, Kainan University, Taoyuan, Taiwan; 2School of Nutrition and Health Sciences, Taipei Medical University, Taipei, Taiwan.
Email: lin5611@tmu.edu.tw
Copyright © 2013 Kao-Ting Lee et al. This is an open access article distributed under the Creative Commons Attribution License, which permits unrestricted use, distribution, and reproduction in any medium, provided the original work is properly cited.
Received May 20th, 2013; revised June 20th, 2013; accepted June 27th, 2013
Keywords: Neurodegeneration; Diabetes; Beta-Amyloid; Alzheimer’s; Polyphenols
ABSTRACT
To examine the effect of consuming polyphenol-rich Oriental plum (Prunus salicina Lindl) on the cognitive performance and the expressions of cerebral neurodegeneration-related proteins in diabetic rats, Wistar rats were assigned into 4 groups: control (C, n = 14), nicotinamide/streptozotocin-induced DM rats (DM, n = 13), DM rats fed metformin (0.05% w/w in the diet, MT, n = 18), and DM rats fed freeze-dried oriental plum powder (2% w/w in the diet, OP, n = 16) for 2 months. The cognitive performance was evaluated by testing in a Morris water maze. The insulin resistance, serum lipid peroxidation, expressions of pathological proteins of AD, beta-amyloid (Aβ) and phosphorylated tau protein were also measured. Consumption of plums significantly improved the spatial learning ability, reduced the insulin resistance, lipid peroxidation, Aβ and phosphorylated tau protein expressions in the cerebral cortex (all P < 0.05), and decreased Aβ deposition in the hippocampus of diabetic rats. In conclusion, polyphenol-rich Oriental plums ameliorated the cognitive decline and reduced the expressions of pathological proteins of AD by possibly reducing hyperglycemia, insulin resistance, and oxidative stress in diabetic rats.
1. Introduction
Alzheimer’s disease (AD) is the most common form of dementia among older people and the most-prevalent neurodegenerative disease, a disease with progressive impairment of the structures and functions of neurons [1-3]. The major features of AD are progressive memory loss, cognitive impairment, and abnormal expressions of proteins in the brain, such as accumulation of β-amyloid (Aβ) and hyperphosphorylation of tau proteins [3]. As the aging population increases, the prevalence of AD is increasing year by year in the US [4]. In addition, more than 95% of AD patients have sporadic AD (sAD) [5]. Evidence demonstrated that type 2 diabetes is one of the main risk factors for sAD [2]. One study suggested that over 80% of cases of AD had either type 2 diabetes or impaired fasting glucose [6]. Furthermore, diabetes patients have a 50% - 75% increased risk of developing AD compared to non-diabetes patients [7].
Currently, the most prevailing hypothesis proposes that insulin resistance and impaired glucose metabolism in the brain play important roles in diabetes-caused AD [8]. Review studies suggested that systemic insulin resistance is accompanied by central insulin resistance, and such impaired insulin signaling results in abnormal protein expressions in the brain and cognitive decline [2,9]. However, the pathogenesis of diabetes-caused AD is still not yet fully understood. Only a few studies were reported in a review using animal models with type 2 diabetes to investigate the possible pathogenesis of AD [1].
Pharmacological treatments can only presently slow down the symptoms, but cannot cure or stop the progression of AD [8]. Thus, prevention of AD has become very important. Polyphenols, such as flavonoids, are widely distributed in fruits and vegetables. One review study suggested a role of polyphenols in preventing diabetes and neurodegenerative diseases [10]. In addition, previous animal and human studies indicated the beneficial effects of flavonoid-rich fruits, such as berries, on agerelated cognitive decline and neurodegeneration [11-14]. In addition to berries, plums are also rich in flavonoids, especially in anthocyanins, and may be a good source of natural antioxidants [15]. One study reported that plum juice is effective in mitigating cognitive deficits in aged rats [16]. However, studies related to preventing diabetes-caused cognitive declines, including learning and memory, with flavonoid-rich fruits are still limited. Therefore, we investigated whether supplementation with the anthocyanin-rich Oriental plum (Prunus salicina Lindl), which is abundant in central and northern Taiwan, could ameliorate cognitive declines cerebral neurodegeneration-related protein expressions in rats with nicotinamide/streptozotocin-induced type 2 diabetes.
2. Materials and Methods
2.1. Diet Preparation
Fresh mature Oriental plums (P. salicina) were purchased from a local market in Taipei, Taiwan. Plums were carefully cut and pitted. Pitted plums were lyophilized and ground to a powder. Plum powder was then combined (at 2% w/w) with the basal diet, the AIN-93M diet. This volume of plum powder in the plum diet is similar to that used in previous studies in which beneficial effects on cognitive decline were found [16,17]. The amount of corn starch in the basal diet was accordingly adjusted when plum powder was added (Table 1). The diabetes medication, metformin hydrochloride (Sigma, St. Louis, MO, USA), was additionally added and combined with the basal diet (0.05% w/w; Table 1). This volume of metformin powder in the metformin diet was the same as that used in a previous study in which beneficial effects on peripheral nerve function in rats with streptozotocin-induced diabetes were found [18].
First, confirm that you have the correct template for your paper size. This template has been tailored for output on the custom paper size (21 cm * 28.5 cm).
2.2. Extraction of Polyphenols
Polyphenols in the plums were extracted by an ultrasound-assisted method [19]. Briefly, a mixture of 10 g of lyophilized plum powder and 100 mL of 80% aqueous methanol with 0.01% (v/v) HCl was sonicated for 20 min, and then filtered through Whatman no. 2 filter paper (Whatman International, Kent, UK). Extraction of the residue was repeated using the same conditions. The two filtrates were combined, and the solvent was removed using a rotary evaporator at 40˚C. The remaining phenolic
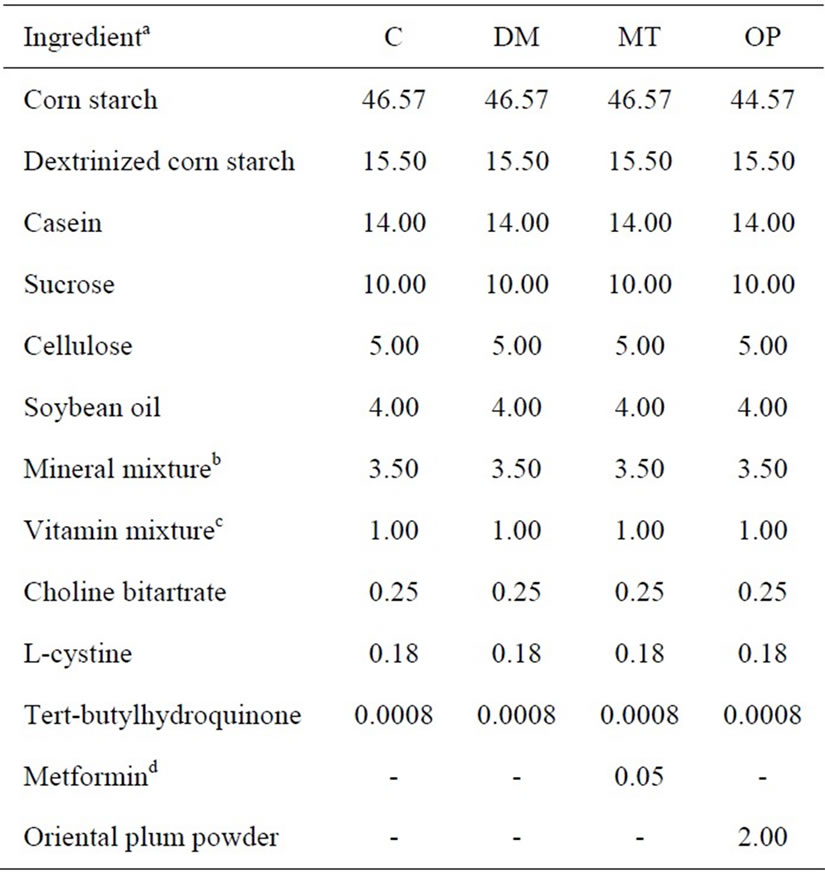
Table 1. Composition of the diets (%).
concentrate was dissolved in 100 mL of distilled deionized water (ddH2O) with 0.01% (v/v) HCl and stored at −30˚C until being analyzed.
2.3. Determination of Total Polyphenols
Total polyphenols were evaluated using the microplateadapted colorimetric method with Folin-Ciocalteu’s reagent [20]. Briefly, 100 μL of each diluted extract, a gallic acid standard solution (0 - 0.2 mg/mL), and a blank were added to 2-mL microtubes. Folin-Ciocalteu’s phenol reagent (200 μL of 10% (v/v)) was added to each mixture and thoroughly mixed. Then 800 μL of 700 mM Na2CO3 was added to each tube with mixing, and this was incubated at room temperature for 2 h. The absorbance was read against a prepared blank in a 96-well microplate at 765 nm. Total polyphenols in plums were expressed as milligrams of gallic acid equivalents (GAE) per 100 g of the fresh edible portion.
2.4. Determination of Total Anthocyanins
Total anthocyanins were measured according to the pHdifferential method [21]. Briefly, 50 μL of diluted extracts were each diluted to a final volume of 5 mL by 0.025 M potassium chloride buffer at pH 1.0 and 0.4 M sodium acetate buffer at pH 4.5. After allowing the mixture to sit for 15 min to equilibrate, the absorbance of the two dilutions of each sample was measured against the ddH2O blank at 520 and 700 nm. Cyanidin-3-glucoside was used as a standard compound to quantify total anthocyanins; the amount which plums contained was expressed as milligrams of cyanidin-3-glucoside equivalents (CGE) per 100 g of the fresh edible portion.
2.5. Animals
Male Wistar rats (BioLasco Taiwan, Taipei, Taiwan) aged 16 weeks were housed in an air-conditioned room (23˚C ± 2˚C; 50% - 60% relatively humidity) with a 12-h light/dark cycle and ad libitum access to food and water. Food intake and weights were recorded during the course of the study. All animal experimental procedures followed published guidelines, Guide for the Care and Use of Laboratory Animals, and were approved by the Institutional Animal Care and Use Committee of Taipei Medical University, Taipei, Taiwan.
2.6. Experimental Procedures
Rats were matched by body weight (BW) and then randomly assigned to a control or diabetic group. Diabetes was induced by an intraperitoneal (i.p.) injection of streptozotocin (STZ; 45 mg/kg BW; Sigma, St. Louis, MO, USA) followed 15 min later by an i.p. injection of nicotinamide (200 mg/kg BW; Acros Organics, Geel, Belgium). The control group received an injection of an equivalent volume of normal saline. After 2 days, this step was repeated as with a previously reported method [22]. A rat was considered to be diabetic by the presence of hyperglycemia (a fasting blood glucose level of >180 mg/dL), polyphagia, polydipsia, and polyuria 14 days after the last induction date. Baseline blood samples were collected 1 month after the day diabetes was confirmed. Diabetic rats were then divided into three groups: an untreated group, a metformin group, and an Oriental plum group. The control and untreated groups were maintained on the basal diet. The metformin and Oriental plum groups were respectively given metformin or the plum diet. Rats in the four groups consumed the experimental diets for 2 months. Rats were starved for 12 h and sacrificed under anesthesia by an i.p. injection of a Zoletil 50 (Virbac, Carros cedex, France) and 2% Rompun (Bayer, Leverkusen, Germany) solution (1:1 ratio, 1 mL/kg BW) after behavioral tests had been performed at 0 and 2 month of treatments. Blood was collected via cardiac puncture. Following transcardial perfusion with ice-cold 0.1 M phosphate-buffered saline (PBS, pH 7.4), the brains were quickly removed. Some brains were fixed with 4% paraformaldehyde in PBS for a histological analysis, and others were dissected, snap-frozen in liquid nitrogen, and stored at −80˚C until being analyzed.
2.7. Blood Analysis
Fasting blood glucose (FBG) levels were measured using a blood glucose meter (Easicheck, Pharmaco Industries Limited, Trinidad & Tobago, WI, USA). The fasting plasma insulin (FPI) concentration was measured using a rat insulin enzyme-linked immunosorbent assay (ELISA) kit (Mercodia, Uppsala, Sweden). The homeostasis model assessment-insulin resistance (HOMA-IR) level, a marker of insulin resistance, was calculated as previously described [23]. The serum thiobarbituric acid-reactive substance (TBARS) level, a marker of oxidative stress, was measured using a fluorometric assay as previously reported [24].
2.8. Morris Water Maze (MWM)
The MWM was used according to previously described procedures for assessing spatial learning and memory [25]. Briefly, the apparatus (TSE Systems, Bad Homburg vor der Höhe, Germany) consisted of a circular, 1.5-mdiameter, 30-cm-deep water pool (23˚C ± 1˚C) and a 2-cm submerged and hidden 14-cm-diameter platform in one quadrant. The walls of the test room were marked with distal cues, and the position of the platform remained unchanged throughout the testing. Rats were allowed to habituate in the test room for 1 h prior to the experiments. An acquisition session was performed by gently immersing a rat in the water starting at four locations randomly assigned for 3 consecutive days with four trials per day (2 min/trial). A probe trial was performed once (30 s) on day 4 with the platform removed. Performances were evaluated and analyzed with image tracking software (FG34PATH, HaSoTec, Rostock, Germany) which allowed measurements of the latency time and path length to find the platform.
2.9. Westerm Bolt Analysis
Tissue homogenates were lysed in RIPA buffer (50 mM Tris-HCl, pH 7.6; 150 mM NaCl; 0.1% sodium dodecylsulfate; 0.5% sodium deoxycholate; and 1% Triton X- 100) with protease and a phosphatase inhibitor cocktail (Thermo Fisher Scientific, Hanover Park, IL, USA). The protein yield was quantified and then processed for Western blotting. Primary antibodies against Aβ 1-40/42 (rabbit, 1:1000, Millipore), pS396-tau (rabbit, 1:1,000, Millipore), tau (mouse, 1:500, Millipore), and β-actin (mouse, 1:5000, Sigma) were used.
2.10. Immunohistochemistry
Brains were fixed and embedded in paraffin. Coronal sections of 6 μm were obtained and dewaxed in xylene, hydrated through graded alcohol and ddH2O, and washed with 1× PBS (pH 7.4). An immunohistochemical staining method was modified according to a previously described procedure [26]. Briefly, slides were treated with 0.5% H2O2 in methanol to inhibit endogenous peroxidase activity, followed by blocking with 5% non-fat milk in PBS. Sections were incubated overnight with a primary antibody against Aβ 1-40/42 (rabbit, 1:100) or pS396-tau (rabbit, 1:300) at 4˚C. After washing with PBS, sections were incubated with a biotinylated goat anti-rabbit secondary antibody at 37˚C for 1 h and horseradish peroxidase (HRP)-conjugated streptavidin at room temperature for 1 h, and developed with a 5% 3,3’-diaminobenzidine DAB solution. For pS396-tau staining, sections were washed in water and counterstained with hematoxylin (Muto Pure Chemicals, Tokyo, Japan) before being dehydrated and mounted.
2.11. Statistical Analysis
Data are presented as the percent or mean ± standard error of the mean (SEM). Mean values obtained for more than two groups were compared by a one-way analysis of variance (ANOVA). Dunnett’s t-test was used to determine p values, and p < 0.05 was considered statistically significant.
3. Results
Total polyphenol and anthocyanin contents in Oriental plums are shown in Table 2. Total polyphenol and anthocyanin contents of the plum powder were 24.09 ± 0.11 mg GAE/g and 2.28 ± 0.01 mg CGE/g, respectively. Total polyphenol and anthocyanin contents of the edible portion of fresh plums were 238.51 ± 1.09 mg GAE/100 g and 22.53 ± 0.14 mg CGE/100 g, respectively.
Figure 1 shows changes in rat BWs before (−1 - 0 month) and after (1 - 2 months) treatment. There were no significant differences in BWs between the control and diabetic rats on the day (−1 month) diabetes was initially confirmed. BWs of diabetic rats significantly decreased compared to control rats at 0, 1, and 2 months (p < 0.001). Treatment of diabetic rats with metformin or Oriental plum for 1 month significantly increased BWs (p < 0.001 and 0.05, respectively) relative to the untreated diabetes (DM) group. At 2 months, the BW of the metformin (MT) group had significantly increased (p < 0.05), and that of the Oriental plum (OP) group had increased but not sig-
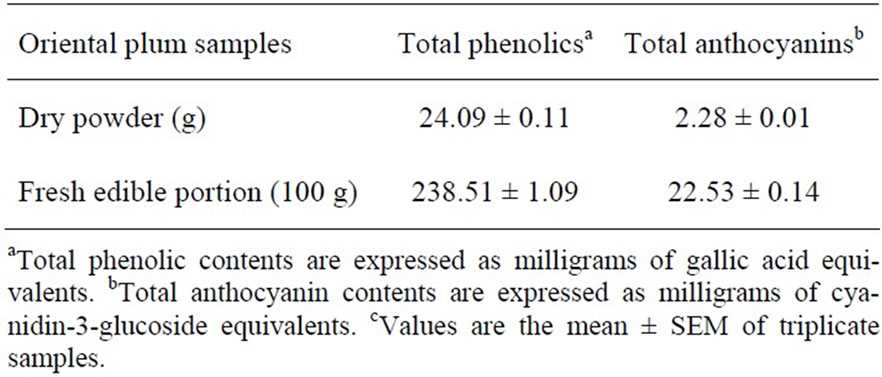
Table 2. Total phenolic and anthocyanin contents in the oriental plumc.
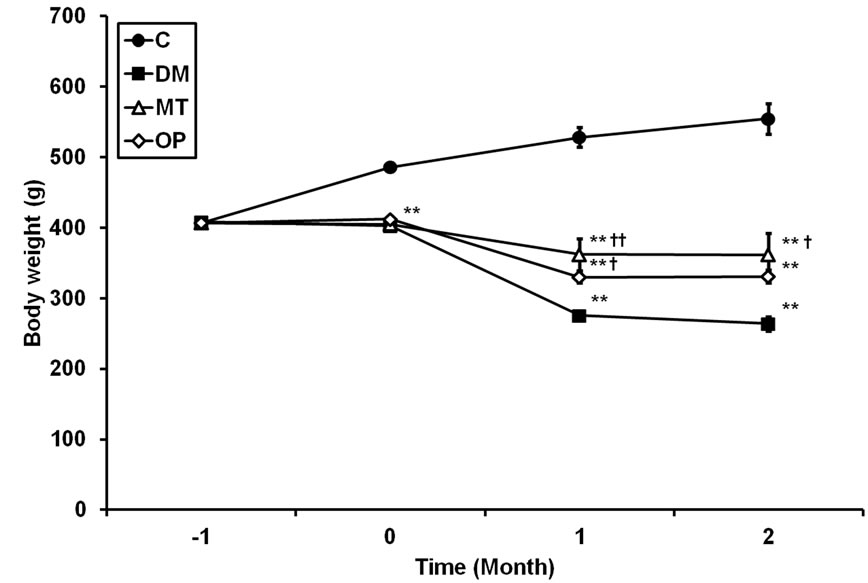
Figure 1. Rat body weights before (−1 - 0 month) and after (1 - 2 month) treatment. Values are the mean ± SEM (n = 5 for groups with 2 months of treatment; n = 10 for other groups). C, control; DM, untreated diabetes; MT, metformin; OP, Oriental plum. All data were analyzed by a one-way ANOVA, followed by Dunnett’s t-test. **p < 0.001 vs. the C group. †p < 0.05; ††p < 0.001 vs. the DM group.
nificantly (p = 0.079) compared to the DM group. Average food intake levels of rats for 2 months are shown in Table 3. Food intake levels of diabetic rats significantly increased compared to control rats (p < 0.001); however, there were no significant differences in food intake levels between treated and untreated diabetic rats.
Changes in FBG, FPI, and HOMA-IR levels of rats at 0 and 2 month are shown in Table 3. FBG levels of diabetic rats were significantly higher than those of control rats at 0 and 2 months (p < 0.001). After 2 months of treatment, FBG levels in the MT and OP groups were significantly lower relative to those of the DM group (p < 0.001). FPI levels of diabetic rats were significantly lower than those of control rats at 0 and 2 months (p < 0.001 and 0.05, respectively). There were no significant differences in FPI levels between treated and untreated diabetic rats at 2 months. HOMA-IR levels of diabetic rats were significantly higher than those of control rats at 0 and 2 months (p < 0.001). After 2 months of treatment, HOMA-IR levels in the MT and OP groups were significantly lower compared to those of the DM group (p < 0.001).
Changes in TBARS levels of rats at 0 and 2 month are shown in Table 3. The TBARS level of diabetic rats was slightly higher than that of control rats at 0 month. In addition, TBARS levels of the DM and MT group were significantly higher than that of control rats at 2 month (p < 0.001).Meanwhile, the TBARS level of the OP group significantly decreased (p < 0.001), but there was no significant difference in the MT group compared to the DM group.
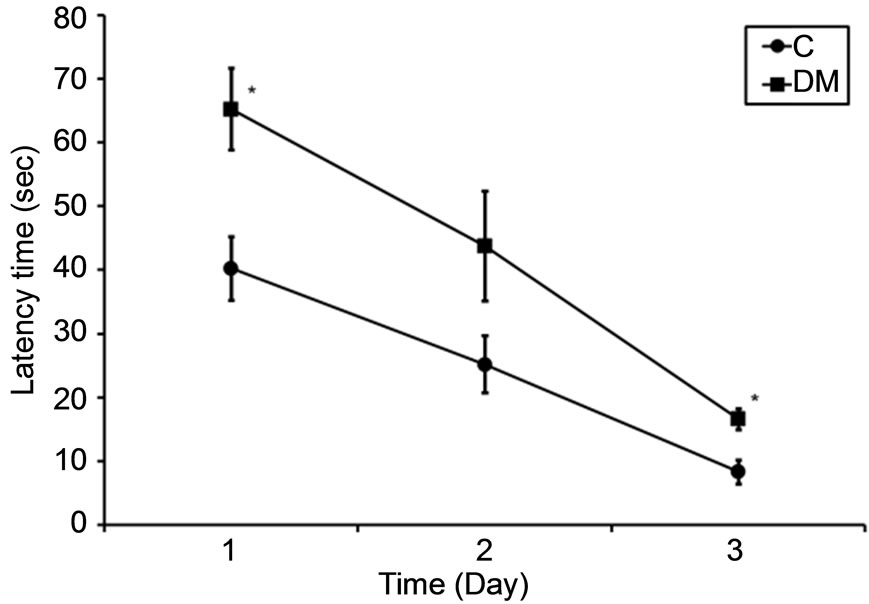
Figure 2 shows the performances of rats in the MWM at 0 and 2 months, in which spatial learning and memory
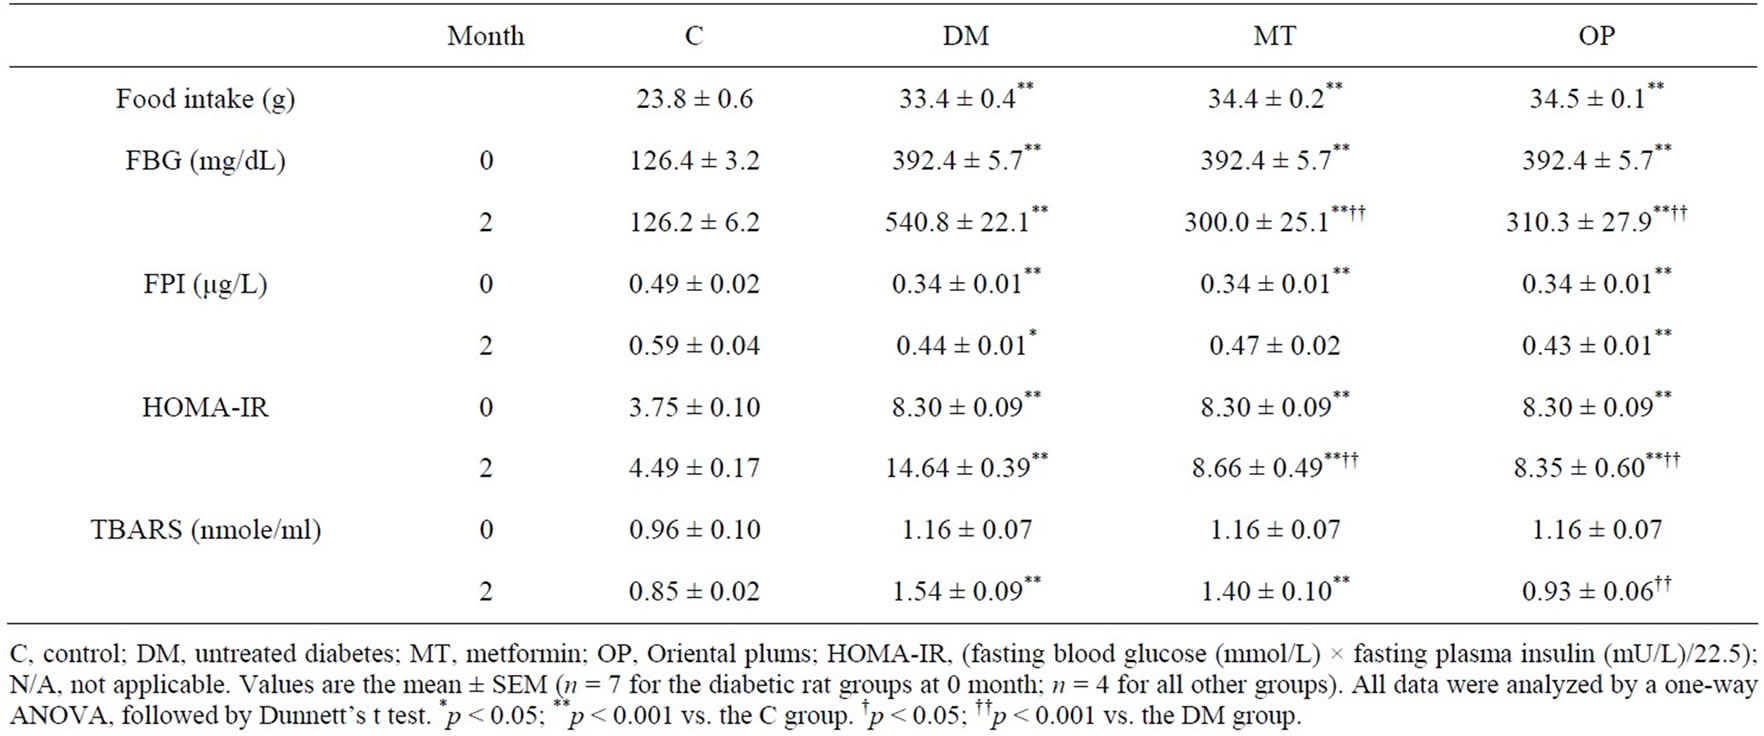
Table 3. Effects of treatments on food intake, fasting blood glucose (FBG), insulin, homeostasis model assessment-insulin resistance (HOMA-IR) and thiobarbituric acid-substance (TBARS) levels at 0 and 2 months.
were examined. The latency time and path length to find a hidden platform during a 3-day acquisition session, which were considered an index of spatial learning ability, in diabetic rats were higher than those of control rats at 0 months (Figures 2(a) and (b)). Meanwhile, the percent time in the target quadrant in the probe trial, which was considered an index of reference memory, in diabetic rats was significantly lower than that of control rats (p < 0.05; Figure 2(c)). In addition, the latency time and path length in the MT and OP groups were lower compared to those of the DM group after treatment for 2 months (Figures 2(d) and (e)). However, there were no significant differences in the percent time between treated and untreated diabetic rats (Figure 2(f)).
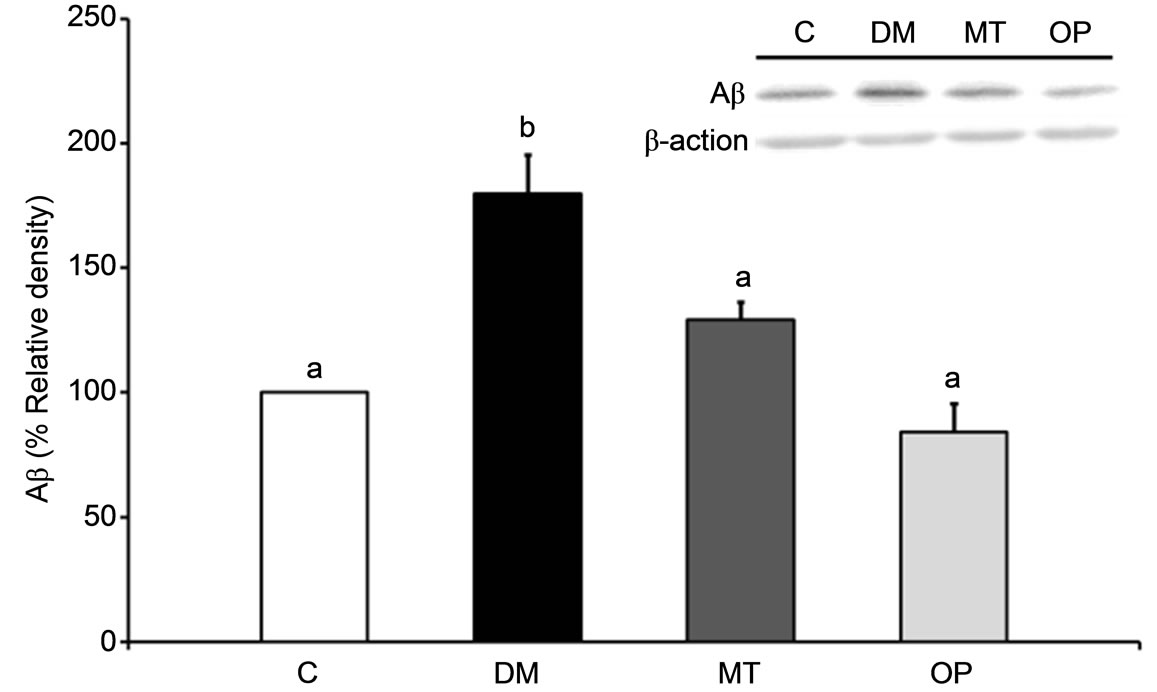
Figure 3 shows the Aβ expression and tau phosphory lation at Ser396 in rat brains after 2 months of treatment. The Aβ expression level in the cerebral cortex of the DM group was significantly increased after diabetes for 3 months compared to that of the control group (p < 0.05; Figure 3(a)), and those in the MT and OP groups were significantly lower relative to that of the DM group (p < 0.05; Figure 3(a)). In addition, phospho-tau expression in the cerebral cortex of the DM group was significantly higher compared to that of the control group (p < 0.001; Figure 3(b)), and those in the MT and OP groups were significantly lower relative to that of the DM group (p < 0.05).
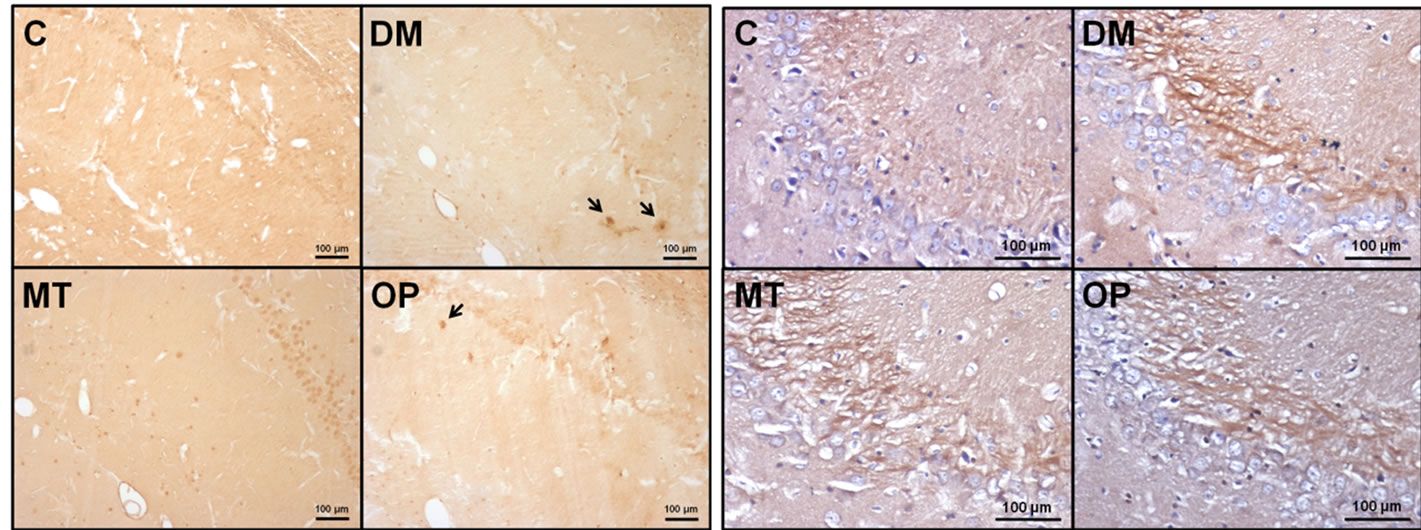
Immunohistochemical staining results of Aβ and phospho-tau in the hippocampus of rats after 2 months of treatment are shown in Figure 4. There were Aβ depositions in the hippocampal CA1 region of DM rats, as indicated by arrows in Figure 4(a). No Aβ deposition in control or MT rats was observed, but there was mild Aβ deposition in OP rats (Figure 4(a)). In addition, phospho-tau, which mainly was localized in mossy fibers, in the hippocampal CA3 region of diabetic rats had increased compared to those of the control group (Figure 4(b)).
4. Discussion
Nicotinamide can protect pancreatic β-cells against cytotoxic effects of STZ so that diabetic syndrome can be induced with reduced pancreatic insulin stores in adult rats, which mimics some features of type 2 diabetes [27]. In the present study, more than 1 month of nicotinamide/ STZ-induced diabetes caused deterioration of cognitive performance in the MWM, including spatial learning and memory. In addition, Aβ and phospho-tau levels in the cerebral cortex and hippocampus of diabetic rats had increased after 3 months of diabetes compared to normal rats. Meanwhile, 2 months of treatment with Oriental plums improved spatial learning performance and decreased Aβ and phospho-tau levels in the cerebral cortex of diabetic rats.
Although the pathogenesis of cognitive impairment in diabetes is not completely understood, diabetes-caused factors such as increased oxidative stress, impaired glucose metabolism, and insulin resistance have been linked [1]. Animal and clinical studies found that diabetes led to a significant increase in serum TBARS levels [28,29], which is considered a marker of lipid peroxidation and oxidative stress [30]. Imbalances of oxidative homeostasis leading to increased lipid peroxidation were revealed to be important factors involved in neurodegenerative diseases such as AD [31].
 (a)
(a)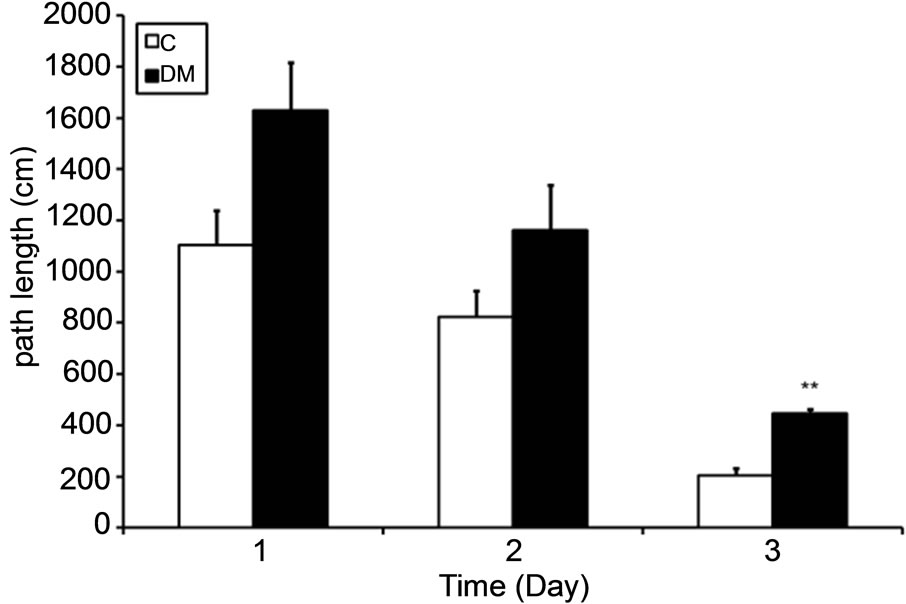 (b)
(b)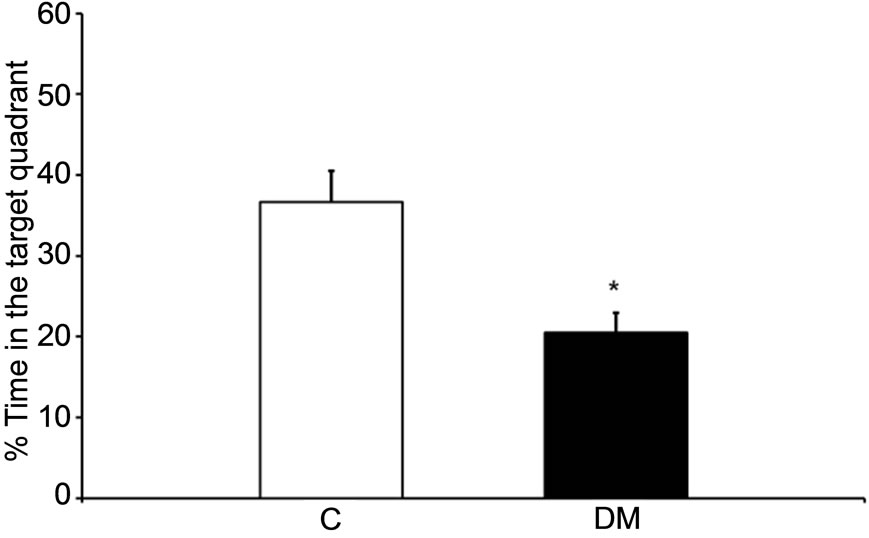 (c)
(c)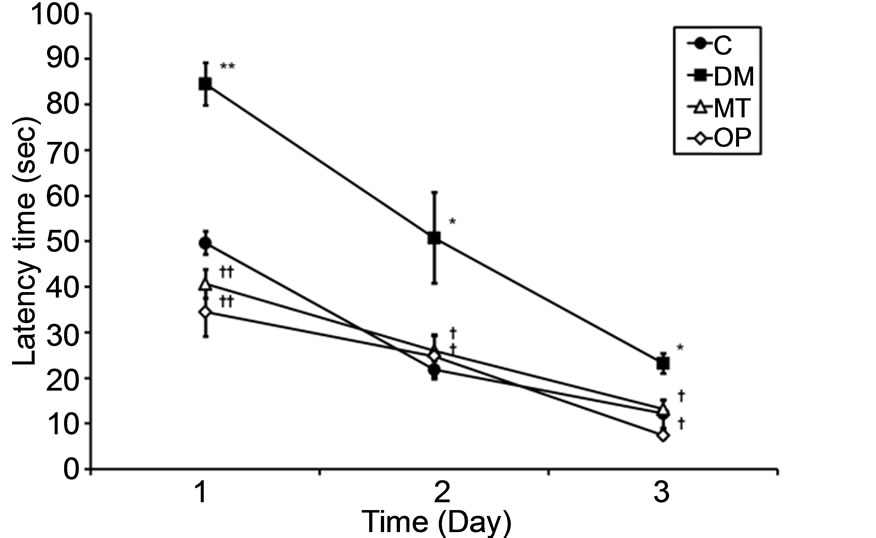 (d)
(d)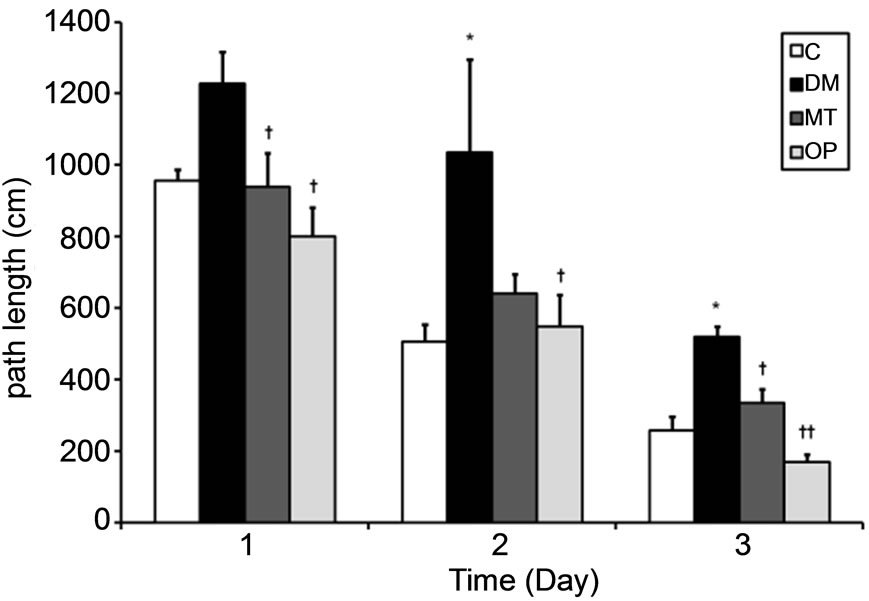 (e)
(e)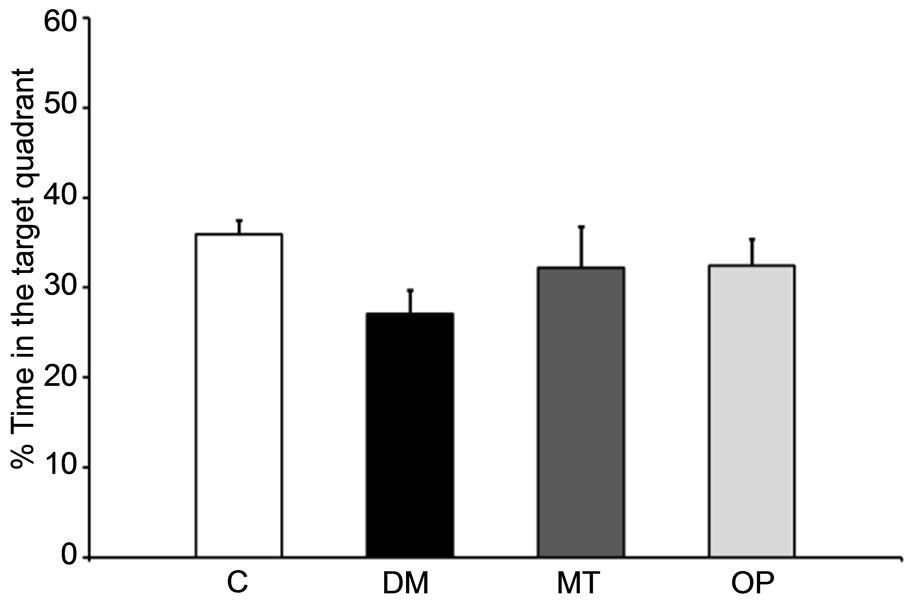 (f)
(f)
Figure 2. Spatial learning and reference memory in control and diabetic rats before (0 months; (a)-(c)) and after treatment (2 months; (d)-(f)). Values are the mean ± SEM (n = 4 per group) of the latency time ((a) and (d)) and path length ((b) and (e)) to find a hidden platform during a 3-day acquisition session in four-trial blocks, and of percent time ((c) and (f)) in the target quadrant in the probe trial. All data were analyzed by a one-way ANOVA. *p < 0.05; **p < 0.001 vs. the C group. †p < 0.05; ††p < 0.001 vs. the DM group.
In addition, oxidative stress is thought to play an important role in the development of cognitive impairments in diabetes [32]. In this study, the serum TBARS level in DM rats was higher than that in control rats at 2 months (Table 3), suggesting that the cognitive decline in DM rats may have partly been caused by oxidative stress. Furthermore, after consuming Oriental plums for 2 months, the TBARS level had decreased in diabetic rats, suggesting that the improvement in cognitive performance may have been due to the antioxidant property of
 (a)
(a)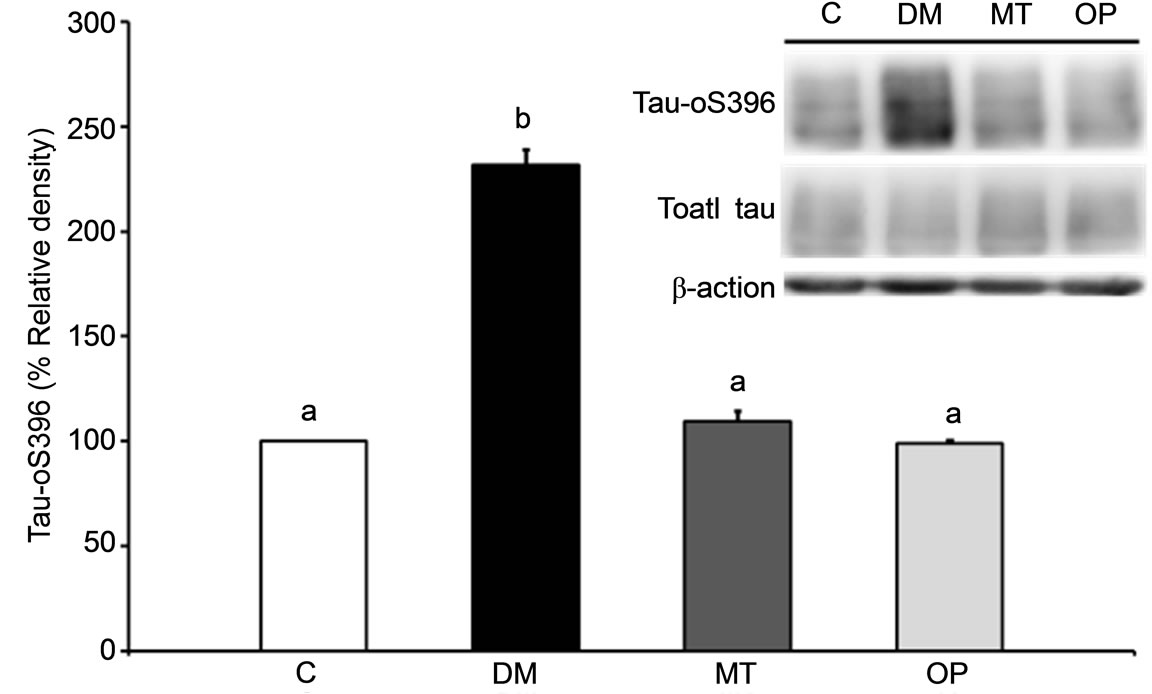 (b)
(b)
Figure 3. Effects of 2 months of treatment on β amyloid (Aβ) (a) and phospho-tau (Ser396) (b) expressions in the cerebral cortex of rats. Values are the mean ± SEM (n = 3 per group) of the percent relative density (control set to 100%). All data were analyzed by a one-way ANOVA, followed by Dunnett’s t-test. Bars with different letters indicate a significant difference (p < 0.05).
 (a) (b)
Figure 4. Immunohistochemical staining of β amyloid (Aβ) and phosphorylated tau in the hippocampus of rats after 2 months of treatment. (a) Photographs of the hippocampal CA1 region in rats. Arrows indicate Aβ deposition; (b) Photographs of the hippocampal CA3 region in rats. Hyperphosphorylated tau was mainly localized in mossy fibers. All scale bars, 100 μm.
the plums. Compared to plums, there were no significant differences in serum TBARS levels after treatment with metformin for 2 months, suggesting that metformin possibly ameliorated the cognitive decline through other mechanisms. In addition, while a cognitive decline was observed in diabetic rats at 0 months (Figure 2(a)), there were no significant differences in serum TBARS levels between control and diabetic rats (Table 3). This result suggests that other factors related to cognitive impairment exist. Chronic hyperglycemia is thought to be associated with cognitive impairment in diabetes [33,34]. In this study, hyperglycemia was observed in diabetic rats, and the FBG level in the OP group decreased after 2 months of treatment (Table 3), suggesting that consuming Oriental plums ameliorated the cognitive decline in diabetic rats by possibly reducing hyperglycemia. Previous studies suggested that systemic insulin resistance is accompanied by central insulin resistance, and such impaired insulin signaling results in Aβ deposition and tau phosphorylation in the brain leading to cognitive decline [2,9,35,36]. In the present study, increased HOMA-IR, Aβ, and phospho-tau levels were observed in diabetic rats and were reduced in the OP group after 2 months of treatment, suggesting that consuming Oriental plums ameliorated the cognitive decline and reduced Aβ and phospho-tau expressions in diabetic rats by possibly reducing insulin resistance. Indeed, hyperglycemia was also associated with oxidative stress, and increased levels of reactive oxygen species were proposed as leading to insulin resistance [37]. In this regard, these underlying mechanisms such as oxidative stress, hyperglycemia, and insulin resistance linking diabetes and cognitive impairments could interact.
5. Conclusion
2 months of treatment with Oriental plums reduced the expressions of cerebral Aβ and phospho-tau, while ameliorated cognitive impairments by possibly reducing hyperglycemia, insulin resistance, and oxidative stress in rats with nicotinamide/STZ-induced diabetes. These changes contributed to the beneficial effects of Oriental plums against AD pathology in diabetes.
6. Acknowledgements
We thank ZespriÒ in New Zealand for supporting part of this research and the following publication.
REFERENCES
- S. A. Park, “A Common Pathogenic Mechanism Linking Type-2 Diabetes and Alzheimer’s Disease: Evidence from Animal Models,” Journal of Clinical Neurology, Vol. 7, No. 1, 2011, pp. 10-18. http://dx.doi.org/10.3988/jcn.2011.7.1.10
- S. C. Correia, R. X. Santos, G. Perry, X. Zhu, P. I. Moreira and M. A. Smith, “Insulin-Resistant Brain State: The Culprit in Sporadic Alzheimer’s Disease?” Ageing Research Reviews, Vol. 10, No. 2, 2011, pp. 264-273. http://dx.doi.org/10.1016/j.arr.2011.01.001
- H. W. Querfurth and F. M. LaFerla, “Alzheimer’s Disease,” New England Journal of Medicine, Vol. 362, 2010, pp. 329-344. http://dx.doi.org/10.1056/NEJMra0909142
- D. Hirtz, D. J. Thurman, K. Gwinn-Hardy, M. Mohamed, A. R. Chaudhuri and R. Zalutsky, “How Common Are the ‘Common’ Neurologic Disorders?” Neurology, Vol. 68, No. 5, 2007, pp. 326-337. http://dx.doi.org/10.1212/01.wnl.0000252807.38124.a3
- A. Rocchi, S. Pellegrini, G. Siciliano and L. Murri, “Causative and Susceptibility Genes for Alzheimer’s Disease: A Review,” Brain Research Bulletin, Vol. 61, No. 1, 2003, pp. 1-24. http://dx.doi.org/10.1016/S0361-9230(03)00067-4
- J. Janson, T. Laedtke, J. E. Parisi, P. O’Brien, R. C. Petersen and P. C. Butler, “Increased Risk of Type 2 Diabetes in Alzheimer Disease,” Diabetes, Vol. 53, No. 2, 2004, pp. 474-481. http://dx.doi.org/10.2337/diabetes.53.2.474
- B. Kim, C. Backus, S. Oh, J. M. Hayes and E. L. Feldman, “Increased Tau Phosphorylation and Cleavage in Mouse Models of Type 1 and Type 2 Diabetes,” Endocrinology, Vol. 150, No. 12, 2009, pp. 5294-5301. http://dx.doi.org/10.1210/en.2009-0695
- A. Gupta, B. Bisht and C. S. Dey, “Peripheral InsulinSensitizer Drug Metformin Ameliorates Neuronal Insulin Resistance and Alzheimer’s-Like Changes,” Neuropharmacology, Vol. 60, No. 6, 2011, pp. 910-920. http://dx.doi.org/10.1016/j.neuropharm.2011.01.033
- E. C. McNay and A. K. Recknagel, “Brain Insulin Signaling: A Key Component of Cognitive Processes and a Potential Basis for Cognitive Impairment in Type 2 Diabetes,” Neurobiology of Learning and Memory, Vol. 96, No. 3, 2011, pp. 432-442. http://dx.doi.org/10.1016/j.nlm.2011.08.005
- A. Scalbert, C. Manach, C. Morand, C. Remesy and L. Jimenez, “Dietary Polyphenols and the Prevention of Diseases,” Critical Reviews in Food Science and Nutrition, Vol. 45, No. 4, 2005, pp. 287-306. http://dx.doi.org/10.1080/1040869059096
- R. J. Williams and J. P. Spencer, “Flavonoids, Cognition, and Dementia: Actions, Mechanisms, and Potential Therapeutic Utility for Alzheimer Disease,” Free Radical Biology and Medicine, Vol. 52, No. 1, 2012, pp. 35-45. http://dx.doi.org/10.1016/j.freeradbiomed.2011.09.010
- J. P. Pencer, “The Impact of Fruit Flavonoids on Memory and Cognition,” British Journal of Nutrition, Vol. 104, Suppl. 3, 2010, pp. S40-S47. http://dx.doi.org/10.1017/S0007114510003934
- R. Krikorian, M. D. Shidler, T. A. Nash, W. Kalt, M. R. Vinqvist-Tymchuk, B. Shukitt-Hale and J. A. Joseph, “Blueberry Supplementation Improves Memory in Older Adults,” Journal of Agricultural and Food Chemistry, Vol. 58, No. 7, 2010, pp. 3996-4000. http://dx.doi.org/10.1021/jf9029332
- F. C. Lau, B. Shukitt-Hale and J. A. Joseph, “The Beneficial Effects of Fruit Polyphenols on Brain Aging,” Neurobiol Aging, Vol. 26, Suppl. 1, 2005, pp. 128-132. http://dx.doi.org/10.1016/j.neurobiolaging.2005.08.007
- D.-O. Kim, O. K. Chun, Y. J. Kim, H.-Y. Moon and C. Y. Lee, “Quantification of Polyphenolics and Their Antioxidant Capacity in Fresh Plums,” Journal of Agricultural and Food Chemistry, Vol. 51, No. 22, 2003, pp. 6509- 6515. http://dx.doi.org/10.1021/jf0343074
- B. Shukitt-Hale, W. Kalt, A. N. Carey, M. VinqvistTymchuk, J. McDonald and J. A. Joseph, “Plum Juice, but Not Dried Plum Powder, Is Effective in Mitigating Cognitive Deficits in Aged Rats,” Nutrition, Vol. 25, No. 5, 2009, pp. 567-573. http://dx.doi.org/10.1016/j.nut.2008.10.018
- B. Shukitt-Hale, V. Cheng and J. A. Joseph, “Effects of Blackberries on Motor and Cognitive Function in Aged Rats,” Nutritional Neuroscience, Vol. 12, No. 3, 2009, pp. 135-140. http://dx.doi.org/10.1179/147683009X423292
- Y. Tanaka, H. Uchino, T. Shimizu, H. Yoshii, M. Niwa, C. Ohmura, N. Mitsuhashi, T. Onuma and R. Kawamori, “Effect of Metformin on Advanced Glycation Endproduct Formation and Peripheral Nerve Function in Streptozotocin-Induced Diabetic Rats,” European Journal of Pharmacology, Vol. 376, No. 1-2, 1999, pp. 17-22. http://dx.doi.org/10.1016/S0014-2999(99)00342-8
- D.-O. Kim and C. Lee, “Extraction and Isolation of Polyphenolics,” Current Protocols in Food Analytical Chemistry, Vol. 6, 2003, pp. I1.2.1-I1.2.12.
- E. A. Ainsworth and K. M. Gillespie, “Estimation of Total Phenolic Content and Other Oxidation Substrates in Plant Tissues Using Folin-Ciocalteu Reagent,” Nature Protocols, Vol. 2, 2007, pp. 875-877. http://dx.doi.org/10.1038/nprot.2007.102
- M. M. Giusti and R. E. Wrolstad, “Characterization and Measurement of Anthocyanins by UV-Visible Spectroscopy in Current Protocols in Food Analytical Chemistry,” John Wiley & Sons, Inc., 2001.
- C. W. Chen and H. H. Cheng, “A Rice Bran Oil Diet Increases LDL-Receptor and HMG-CoA Reductase mRNA Expressions and Insulin Sensitivity in Rats with Streptozotocin/Nicotinamide-Induced Type 2 Diabetes,” Journal of Nutrition, Vol. 136, 2006, pp. 1472-1476.
- D. R. Matthews, J. P. Hosker, A. S. Rudenski, B. A. Naylor, D. F. Treacher and R. C. Turner, “Homeostasis Model Assessment: Insulin Resistance and Beta-Cell Function from Fasting Plasma Glucose and Insulin Concentrations in Man,” Diabetologia, Vol. 28, No. 7, 1985, pp. 412-419. http://dx.doi.org/10.1007/BF00280883
- K. Yagi, “Simple Assay for the Level of Total Lipid Peroxides in Serum or Plasma,” Methods in Molecular Biology, Vol. 108, 1998, pp. 101-106.
- C. V. Vorhees and M. T. Williams, “Morris Water Maze: Procedures for Assessing Spatial and Related Forms of Learning and Memory,” Nature Protocols, Vol. 1, 2006, pp. 848-858. http://dx.doi.org/10.1038/nprot.2006.116
- L. Escribano, A. M. Simon, E. Gimeno, M. CuadradoTejedor, R. Lopez de Maturana, A. Garcia-Osta, A. Ricobaraza, A. Perez-Mediavilla, J. Del Rio and D. Frechilla, “Rosiglitazone Rescues Memory Impairment in Alzheimer’s Transgenic Mice: Mechanisms Involving a Reduced Amyloid and Tau Pathology,” Neuropsychopharmacology, Vol. 35, 2010, pp. 1593-1604. http://dx.doi.org/10.1038/npp.2010.32
- P. Masiello, C. Broca, R. Gross, M. Roye, M. Manteghetti, D. Hillaire-Buys, M. Novelli and G. Ribes, “Experimental NIDDM: Development of a New Model in Adult Rats Administered Streptozotocin and Nicotinamide,” Diabetes, Vol. 47, No. 2, 1998, pp. 224-229. http://dx.doi.org/10.2337/diab.47.2.224
- A. Griesmacher, M. Kindhauser, S. E. Andert, W. Schreiner, C. Toma, P. Knoebl, P. Pietschmann, R. Prager, C. Schnack, G. Schernthaner, et al., “Enhanced Serum Levels of Thiobarbituric-Acid-Reactive Substances in Diabetes Mellitus,” American Journal of Medicine, Vol. 98, No. 5, 1995, pp. 469-475. http://dx.doi.org/10.1016/S0002-9343(99)80347-7
- T. Tsuda, F. Horio and T. Osawa, “Dietary Cyanidin 3-OBeta-D-Glucoside Increases ex Vivo Oxidation Resistance of Serum in Rats,” Lipids, Vol. 33, No. 6, 1998, pp. 583-588. http://dx.doi.org/10.1007/s11745-998-0243-5
- A. R. Collins, “Assays for Oxidative Stress and Antioxidant Status: Applications to Research into the Biological Effectiveness of Polyphenols,” American Journal of Clinical Nutrition, Vol. 81, No. 1, 2005, pp. 261S-267S.
- V. Chauhan and A. Chauhan, “Oxidative Stress in Alzheimer’s Disease,” Pathophysiology, Vol. 13, No. 3, 2006, pp. 195-208. http://dx.doi.org/10.1016/j.pathophys.2006.05.004
- V. Kucukatay, A. Agar, S. Gumuslu and P. Yargicoglu, “Effect of Sulfur Dioxide on Active and Passive Avoidance in Experimental Diabetes Mellitus: Relation to Oxidant Stress and Antioxidant Enzymes,” International Journal of Neuroscience, Vol. 117, No. 8, 2007, pp. 1091-1107. http://dx.doi.org/10.1080/00207450600934531
- G. J. Biessels, A. Kamal, G. M. Ramakers, I. J. Urban, B. M. Spruijt, D. W. Erkelens and W. H. Gispen, “Place Learning and Hippocampal Synaptic Plasticity in Streptozotocin-Induced Diabetic Rats,” Diabetes, Vol. 45, No. 9, 1996, pp. 1259-1266. http://dx.doi.org/10.2337/diab.45.9.1259
- A. Kamal, G. J. Biessels, I. J. Urban and W. H. Gispen, “Hippocampal Synaptic Plasticity in Streptozotocin-Diabetic Rats: Impairment of Long-Term Potentiation and Facilitation of Long-Term Depression,” Neuroscience, Vol. 90, No. 3, 1999, pp. 737-745. http://dx.doi.org/10.1016/S0306-4522(98)00485-0
- C. G. Jolivalt, C. A. Lee, K. K. Beiswenger, J. L. Smith, M. Orlov, M. A. Torrance and E. Masliah, “Defective Insulin Signaling Pathway and Increased Glycogen Synthase Kinase-3 Activity in the Brain of Diabetic Mice: Parallels with Alzheimer’s Disease and Correction by Insulin,” Journal of Neuroscience Research, Vol. 86, No. 15, 2008, pp. 3265-3274. http://dx.doi.org/10.1002/jnr.21787
- A. F. Schuh, C. M. Rieder, L. Rizzi, M. Chaves and M. Roriz-Cruz, “Mechanisms of Brain Aging Regulation by Insulin: Implications for Neurodegeneration in Late-Onset Alzheimer’s Disease,” ISRN Neurology, Vol. 2011, 2011, Article ID: 306905.
- K. Maiese, S. D. Morhan and Z. Z. Chong, “Oxidative Stress Biology and Cell Injury during Type 1 and Type 2 Diabetes Mellitus,” Current Neurovascular Research, Vol. 4, No. 1, 2007, pp. 63-71. http://dx.doi.org/10.2174/156720207779940653