Food and Nutrition Sciences
Vol. 4 No. 4 (2013) , Article ID: 30002 , 10 pages DOI:10.4236/fns.2013.44054
Body Composition and Metabolic Risk Factors in Postmenopausal Women: Effects of a Dietary Weight Loss Program
![]()
International Center for the Assessment of Nutritional Status (ICANS), Università degli Studi di Milano, Milan, Italy.
Email: *angela.spadafranca@unimi.it
Copyright © 2013 Angela Spadafranca et al. This is an open access article distributed under the Creative Commons Attribution License, which permits unrestricted use, distribution, and reproduction in any medium, provided the original work is properly cited.
Received November 27th, 2012; revised December 27th, 2012; accepted January 4th, 2013
Keywords: Menopause; Weight Gain; Metabolic Syndrome; Visceral Adipose Tissue (VAT); Hypocaloric Diet; Weight Loss
ABSTRACT
Epidemiological studies showed an association between menopause, weight gain and risk factors that identify the metabolic syndrome (MS). We evaluated body composition and metabolic risk factors in postmenopausal women addressed to a center for the assessment of nutritional status to lose weight by hypocaloric balanced diet. 161 postmenopausal women were enrolled. MS diagnosis was made applying IDF (International Diabetes Foundation) criteria. After the prescription of hypocaloric diet all subjects were controlled every 2 months. In patients suffering from MS (MS+) at the first visit, diagnosis of MS was reassessed when 10% weight loss was achieved. 70 women were MS+. Years since menopause, low instruction level, obesity and Visceral Adipose Tissue (VAT) were each associated with MS. Particularly, BMI ≥ 30 Kg/m2 (OR: 2.61; 95% CI, 1.76 - 3.46) and VAT > 6.6 cm (OR: 3.49; 95% CI, 2.52 - 4.46) resulted independent risk factors. The 30% of the whole sample dropped out, the reminders significantly reduced weight, waist circumference (Wc) and Fat Mass (p < 0.01). The 35% of MS+ women achieved the 10% weight loss with significant reduction of VAT, Wc, fasting glucose, tryglicerides, blood pressure and resolution of MS in the 78% of them. The 43.5% of postmenopausal women addressed in one center for the assessment of nutritional status to follow a weight-loss nutritional program had the MS; visceral obesity was the strongest independent risk factor and hypocaloric balanced diet resulted a good strategy to lose weight and treat MS.
1. Introduction
Menopause is one of the critical periods of a woman’s life during which weight gain is favored [1] and obesity prevalence is the highest across lifespan [2-4].
Epidemiological data suggest that weight gain during the menopausal transition is due to aging, decreased leisure-time physical activity, and hormonal changes [1,5]. Aging and reduced physical activity were associated to a gradual decrease of FFM (Fat-Free Mass) with consequent reduction on RMR (Resting Metabolic Rate) and increased body fat [6]. Furthermore the decline of endogenous estrogens induces the increase of visceral adiposity [7].
There is increasing evidence that weight gain and in particular visceral obesity are predictors of metabolic alterations including insulin resistance, glucose intolerance, lipid disorders and high blood pressure [8]. This cluster of risk factors identifies the metabolic syndrome (MS).
Data in literature showed that both nutritional status and postmenopausal status play an important role as determinant of MS. Case CC et al. [9] showed that MS was prevalent in 68% of a cohort of 185 obese individuals. Dietary patterns are associated with glucose intolerance, insulin resistance and other features of the metabolic syndrome. In particular scientific evidences recommended a healthy balanced diet, with Mediterranean diet characteristics (fruit and vegetables, legumes, whole grains, dietary fiber, fish, vegetable protein and vegetable fat from olive oil) as the main components of metabolic syndrome and chronic diseases prevention [10,11].
Studies performed on postmenopausal women showed that 13.7% to 41.5% had the MS [12-14]; moreover postmenopausal status according to years since menopause was identified as an independent risk factor for MS [15]. Finally epidemiological studies showed that prevalence of MS tended to increase steadily in parallel with a marked rise in BMI and waist circumference through the menopausal transition [16].
MS is associated to an increased cardiovascular risk. Epidemiological studies have shown that individuals with the MS have a three fold increase in cardiovascular diseases and a significant increase in cardiovascular mortality [17].
The management of MS is thus a necessary strategy to improve cardiovascular risk. At this purpose current guidelines (International Diabetes Foundation, 2005) propose weight loss as one of the first therapeutic goal to achieve [18]. For instance, Case CC et al. (2002) [9] showed that moderate weight loss with a very low calorie diet markedly improved all aspects of MS in obese individuals.
Although the relationship between nutritional status and MS [8,9] and between menopause and MS has been documented [7,19], no study focused on MS in postmenopausal women who seek a weight-loss program, nor the effects of a structured dietary intervention in this kind of individuals has been reported.
Therefore in this study we observed the prevalence of MS among postmenopausal in one center for the assessment of nutritional status and we examined the efficacy of a hypocaloric balanced diet on the improvement of nutritional status and on management of MS.
2. Methods
2.1. Study Subjects
The study was performed at the International Center for the Assessment of Nutritional Status (ICANS), University of Milan (Italy). Study subjects were recruited among Caucasian postmenopausal women who spontaneously came to ICANS for weight loses. Menopausal status was identified as the absence of menses for at least 12 consecutive months or as current hormonal replacement therapy after menopause diagnosis by a gynaecologist or as surgical menopause. Exclusion criteria comprised psychiatric disorders, cancer, severe cardiovascular events and chronic illness affecting nutritional status. The present study was carried out according to the guidelines of the Declaration of Helsinki and written informed consent was obtained from every patient before measurements were made. The institutional review board approved the study procedures.
2.2. Experimental Design
At the beginning of the study every woman underwent a clinical and nutritional status evaluation composed by medical examination, body composition assessment (anthropometry and ultrasonography of visceral abdominal fat), lifestyle and dietary habits investigation, indirect calorimetry for resting energy expenditure measurement, blood pressure measurement, examination of biomedical parameters related to MS.
Patients underwent check up every two months in order to evaluate the compliance to dietary intervention (by an interview with the dietician), and the effects on nutriational status (by anthropometry and blood pressure measurement).
In patients resulted affected by MS at the first visit, the diagnosis of MS was reassessed when 10% weight loss was achieved and visceral abdominal fat (VAT) and biochemical parameters were reassessed.
2.3. Anthropometry
Anthropometric measurements were taken by the same operator, according to standard criteria and measuring procedures [20].
With a subject wearing only underwear, weight (to the nearest 0.1 kg) and standing height (SH; to the nearest 0.1 cm) were measured using the same calibrated scale that had a telescopic vertical steel stadiometer (SECA 711, Hamburg, Germany).
BMI (Body Mass Index) was calculated as weight (kg)/stature (m)2. Waist circumference (Wc) was measured as proposed by Lohman et al. [20].
To measure Wc, the top of iliac crest and the end of the last rib were located. A measuring tape was placed in a horizontal plane around abdomen at level of the mean point between iliac crest and last rib. Before reading tape measure, we ensured that tape is snug but did not compress the skin and was parallel to floor. Measurement was made at the end of a normal expiration.
Skinfold thickness was measured as proposed by Lohman et al. [20] using a Holtain LTD calliper. Biceps, triceps, subscapular and soprailiac skinfolds were considered in analysis of body density and fat mass (FM) (%), which were calculated by the Durnin and Womersley method and by Siri’s formula, respectively [21].
Visceral adipose tissue (VAT) was measured by a physician using ultrasonography (US). All ultrasonographic procedures were performed by the same examiner using a 3.5-MHz probe located 1 cm from the umbilicus. Two US measurements of intraabdominal (“visceral”) and subcutaneous fat were taken. US-determined subcutaneous fat was defined as the distance between the skin and external face of the rectus abdominal muscle, and visceral fat was defined as the distance between the internal face of the same muscle and the anterior wall of the aorta [22].
2.4. Indirect Calorimetry
Resting Energy Expenditure (REE) was estimated by an open-circuit ventilated-hood system (Sensor Medics Wmax29, Anaheim, CA). All measurements were made in the post-absorptive state (12 - 14 h fasting) in a thermo neutral environment (24˚C - 26˚C) and with no external stimulations. The subjects were allowed to rest awake in the supine position for at least 20 min prior to the measurement. About 30 min of respiratory gas exchange data were then collected. The first 5 - 10 min of data were discarded, as recommended by Isbell et al. [23] This allowed the subjects to acclimate to the canopy and to the instrument noise. The average of the last 20 min of measurements was used to determine REE for 24 h according to standard abbreviated Weir equation [24]. The measured REE was compared with the predicted REE, according to the equations of Harris and Benedict [25].
2.5. Blood Pressure Measurement
Blood pressure (BP) was measured with a random-zero mercury sphygmomanometer by a physician after at least a 10-min rest.
2.6. Definition of Metabolic Syndrome
The Metabolic Syndrome was defined using criteria proposed by the International Diabetes Foundation (IDF) (2005). The IDF clinical definition makes the presence of abdominal obesity necessary for diagnosis: for women of European origin, such as the subjects of this study, the IDF specified thresholds for abdominal obesity to be waist circumference ≥80 cm. When such is present, two additional factors of the following listed are sufficient for diagnosis: triglycerides ≥150 mg/dl or drug therapy for elevated triglycerides, HDL cholesterol <50 mg/dl or drug therapy for reduced HDL, systolic pressure ≥130 mmHg or diastolic pressure ≥85 mmHg or antihypertensive drug treatment, fasting glucose ≥100 mg/dl or drug treatment for elevated glucose. On the basis of the presence or not of MS, the sample was divided in two groups: MS+ and MS−.
2.7. Dietary Intervention
After the first visit all women received a dietary program providing at least the 90% of resting energy expenditure and structured on the indications from Guides Lines for an Healthy Nutrition [26] and Recommended Assumption Levels of Energy and Nutrients for Italian Population [27]. The macronutrient composition of the dietary programs were balanced in macronutrient composition as indicated in Table 1. Three-five servings of fruit and vegetables were daily advised; the source of protein intake was dependent on the frequencies of consumption of meat (2 times/weeks), fish (4 times/week), legumes (4 times/week), eggs (1 time/week), low-fat cheese (1 - 2 time/week), low-fat ham (1 - 2 time/week). Olive oil is indicated as the main culinary lipid. Dietary cholesterol was lower than 200 mg/die and fibre intake was about 30 g, in agreement with Guide Lines for a Healthy Nutrition.
2.8. Statistical Analysis
Statistical analysis was performed using Statistix V. 7.0.
All data were expressed as mean ± sd for continuous variables and as % for categorical variables. Variable continuous and categorical in MS+ and MS− women were compared using Student’s t test and the X2 test respectively. Quartiles of VAT were indicated as median and range.
Univariate and multivariate logistic regression analysis were used to calculate the crude and adjusted odds ratios (ORs) considering age, years since menopause, surgical menopause, instruction level, obesity and VAT as potential risk factors associated with MS in menopause. ORs were expressed with 95% confidence intervals (CI).
All comparisons were made two-sided, and a p value < 0.05 (two-tailed) was considered significant.
3. Results
Between November 2010 and March 2011, 677 subjects spontaneously referred to ICANS to obtain dietary treatment. Among them, 161 were postmenopausal women, of which 10% normal weight (18.5 ≤ BMI ≤ 24.9 Kg/m2), 45% overweight (25 ≤ BMI ≤ 29.9 Kg/m2) and 45% obese (BMI ≥ 30 Kg/m2). One hundred fifty-five postmenopausal women showed a Wc ≥ 80 cm and among these, 70 showed at least two additional factors to make diagnosis of MS. Therefore the 43.5% of postmenopausal sample was suffering from MS.
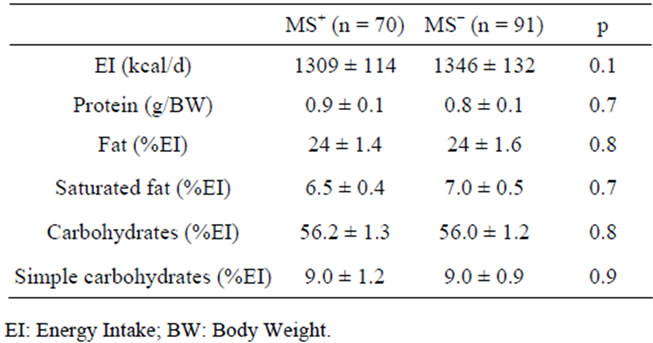
Table 1. Energy and Macronutrient composition of dietary protocols.
The distribution of MS in relation to BMI resulted: 67% among obese woman, 26% among overweight and 29% among normal weight.
3.1. Characteristics of the Study Sample at Baseline
The characteristics of the study sample at baseline, divided in MS+ and MS− groups, are presented in Table 2.
The MS+ sample resulted slightly older and with a greater duration of menopause than MS− sample. Moreover we observed in MS+ women a greater prevalence of surgical menopause and of low instruction level. Compared with MS− women, MS+ women had a greater weight, BMI, Wc, FM, VAT, BP, fasting glucose and a lower HDL cholesterol. REE, but not REE/BW, resulted greater in MS+ women (1392 ± 167 kcal vs 1452 ± 180 kcal, p = 0.01; 18.4 ± 1.9 kcal/kg vs 18 ± 1.8 kcal/kg, p = 0.1). No significance difference was observed between measured REE and predicted REE in both groups (MS+: +2% ± 8%, p = 0.1; MS−: −1% ± 7.5%, p = 0.1).
With respect MS−, MS+ women were more frequently obese (67% vs 27%, p = 0.01), less frequently overweight (24% vs 59%, p = 0.04) and similarly normal weight (9% vs 13%, p = 0.3).
VAT thickness was categorized in quartiles and related to relative MS frequency as shown in Table 3. Only the subjects in the highest quartile had significantly higher MS prevalence than subjects in the lowest quartiles.
Results of multiple logistic regression are summarized in Table 4.
Univariate analysis showed age, postmenopausal status since at least 5 years, low instruction level, obesity (BMI ≥ 30 Kg/m2) and VAT > 6.6 cm as predictors of MS in menopause; multivariate analysis showed the BMI ≥ 30 Kg/m2 and VAT > 6.6 cm as independent risk factors.
Table 5 describes the prevalence of individual components of MS at baseline. Among criteria for MS diagnosis, hypertension was the most frequently met followed by hypertriglyceridemia, altered fasting glucose and low HDL cholesterol. Although Wc ≥ 80 cm is the main and essential criterion for MS, however the difference between MS+ women and MS− women was marginally significant (p = 0.05).
3.2. Dietary Intervention: Compliance and Effects on the Study Sample
The 30% (n = 48) of the whole sample dropped out just after two months of diet therapy. No significant difference was observed in the frequency of drop-out between MS+ and MS− groups (33%, n = 18 vs 26%, n = 30, p = 0.3).
The subjects that complied with dietary program (n = 113) followed it on average for 4 months without significant differences between MS+ (n = 52) and MS− (n = 61) women (3.8 ± 1.7 vs 4.0 ± 2.1 months, p = 0.5).
As shown in Table 6 a significant reduction of weight, Wc and FM was observed after the dietary intervention (p < 0.001) in the whole sample. In particular MS+ women achieved a significantly greater reduction in BMI and Wc than MS− women (p < 0.05).
An improvement of BP such as diastolic values (−1.6 ± 7.9 mmHg, p = 0.01) than sistolic values (−3.2 ± 4.7 mmHg, p = 0.03) was reported in MS+ women. In particular we observed a normalization of blood pressure on the basis of IDF criteria in 34.3% (n = 12) of MS+ women completers that at begin of the study had alterated blood pressure (n = 35).
No significant BP change was reported in MS− women.
3.3. Effects of 10% Weight Loss in MS+ Women
The therapeutic goal of 10% weight loss in presence of MS was achieved by 18 women (35% of the compliant MS+ sample).
The mean time of dietary intervention to achieve this therapeutic goal was 5.1 ± 1.5 months (range 3 - 9 months).
In Table 7 are summarized results about effects of 10% weight loss on body composition and individual components of MS. Significant reductions were observed in BMI, FM% and VAT (p < 0.01). The prevalence of obesity in MS+ sample reduced significantly (−54%, p = 0.01). Significant changes are obtained as mean value of Wc, basal glucose and blood pressure (p < 0.01).
On the basis of IDF criteria for MS diagnosis we observed significant reduction in the frequency of altered basal glucose, hypertrigliceridemia and hypertension. No significant difference was observed in the frequency of Wc ≥ 80 cm. The 10% weight loss was associated to the resolution of MS in the 78% of the MS+ cases (p = 0.001).
4. Discussion
We reported data extracted from an observational study carried out on postmenopausal women that spontaneously underwent a structured weight loss program in one center for the assessment of nutritional status. We focused our attention on body composition and metabolic risk factors and on effects of a hypocaloric balanced diet on the improvement of nutritional status and on management of MS.
The 43.5% of our sample had the MS; since we included women who wanted to lose weight because un-
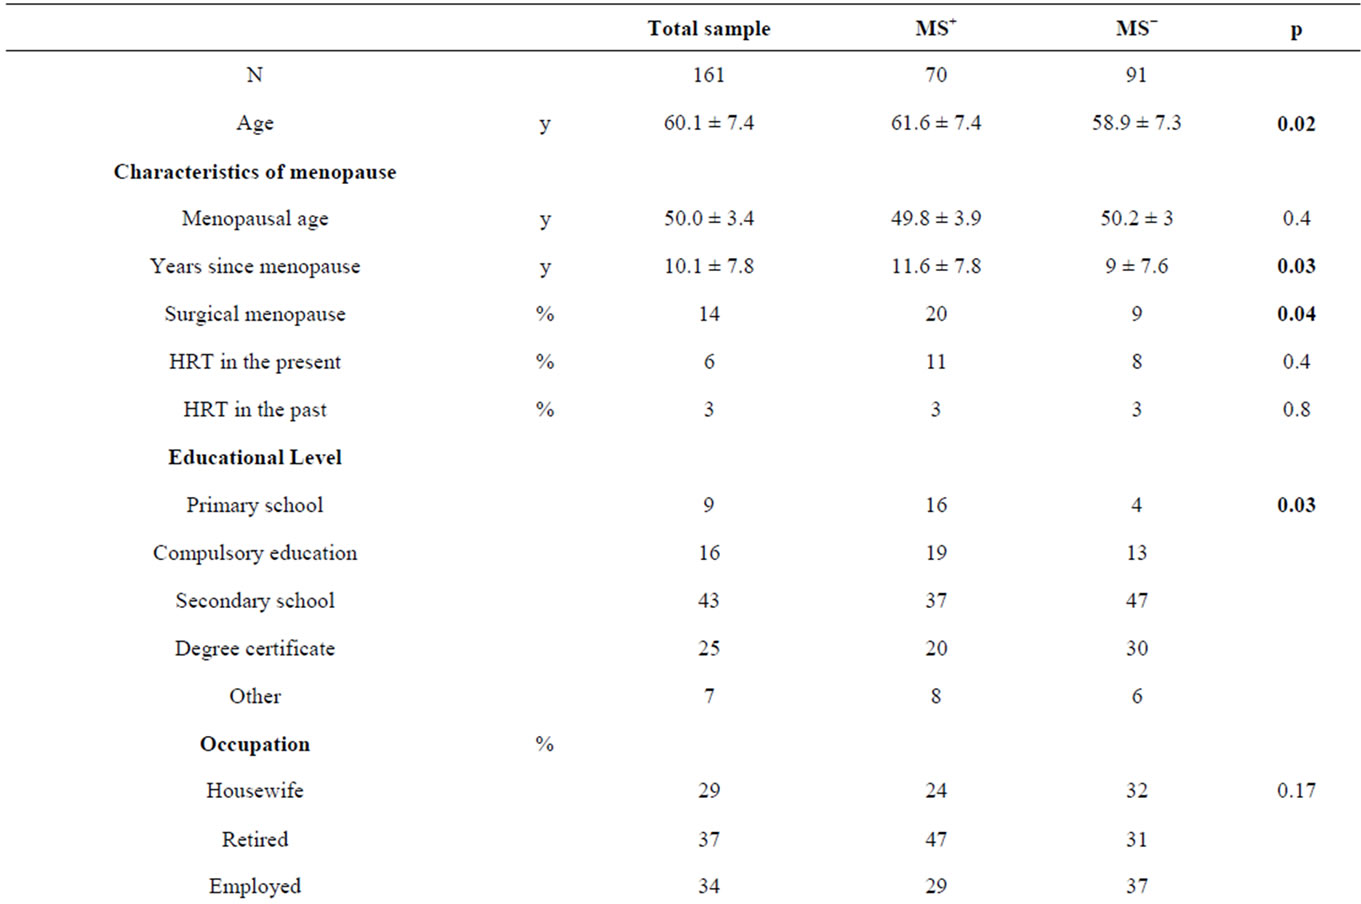
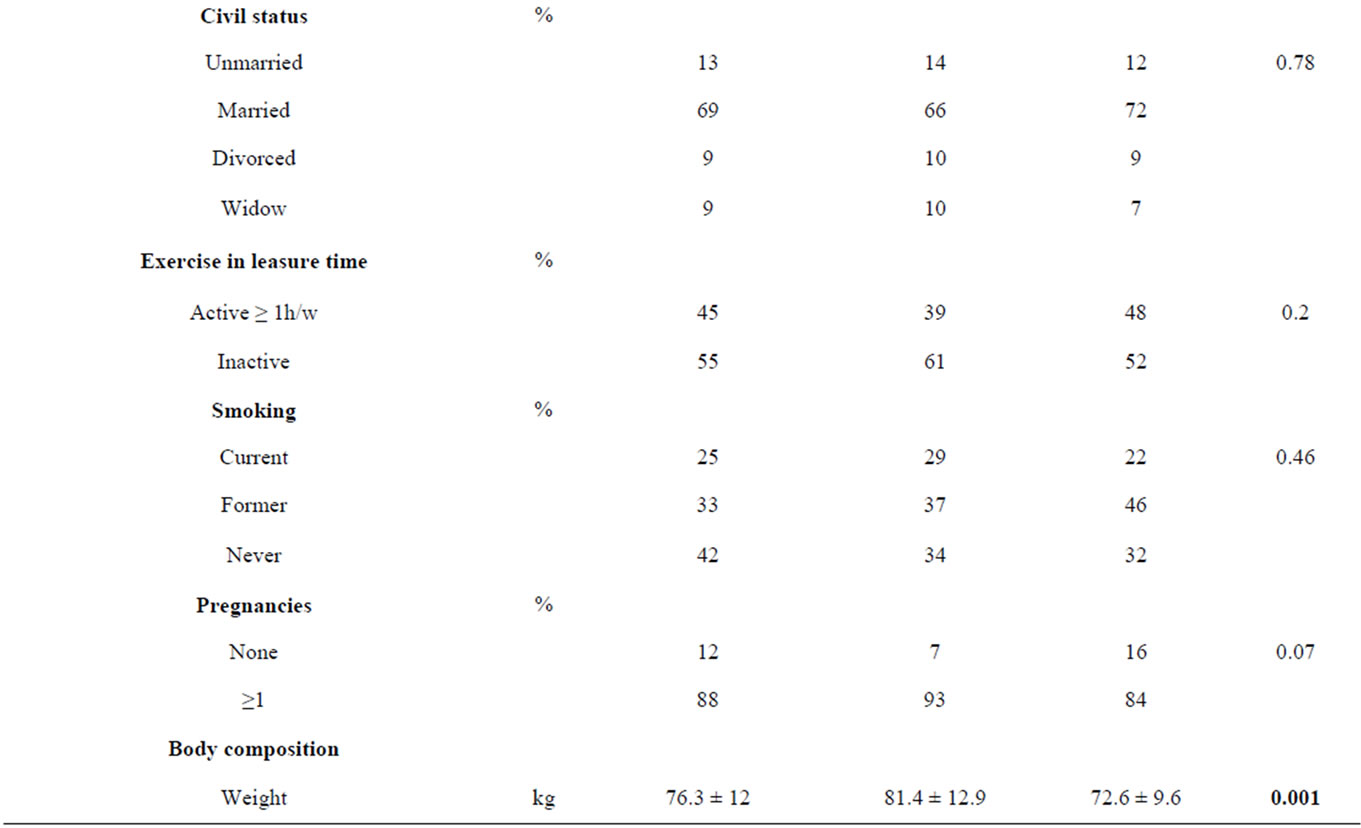

Table 2. Characteristics of the study sample at baseline.
Table 3. Quartiles of VAT thickness and relative frequency of MS.
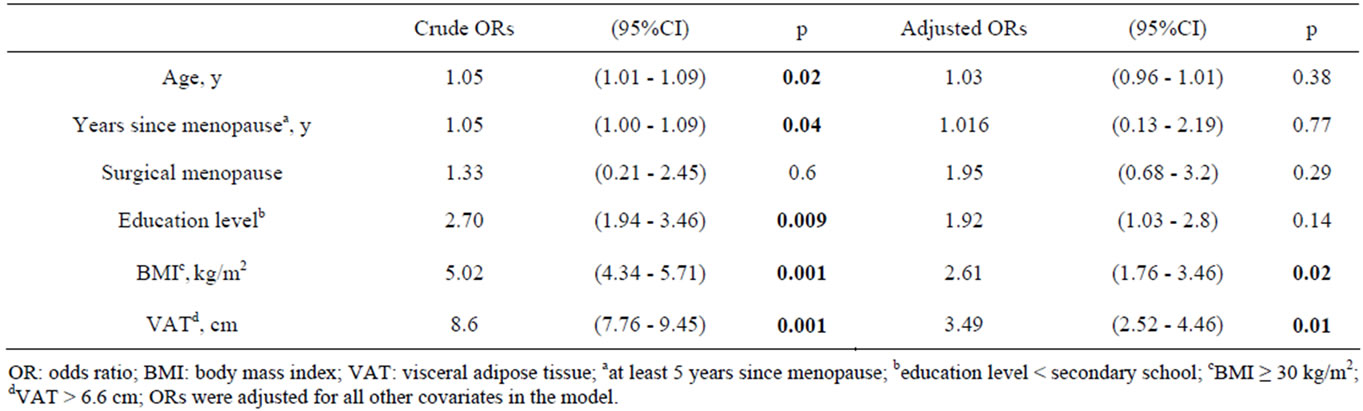
Table 4. Univariate and multivariate ORs for the metabolic syndrome.
easy or worried about their inadequate nutritional status, this date suggests a good agreement between the perception of an alteration of nutritional status and the effective presence of metabolic risk factors. Thus, to awaken the postmenopausal population to weight control could be a good strategy in order to individuate health risk conditions such as the MS.
Epidemiological studies showed that MS is largely determined by overweight status and obesity [28].
Case et al. (2002) [9] reported that MS is prevalent in

Table 5. Prevalence (%) of individual components of the metabolic syndrome.
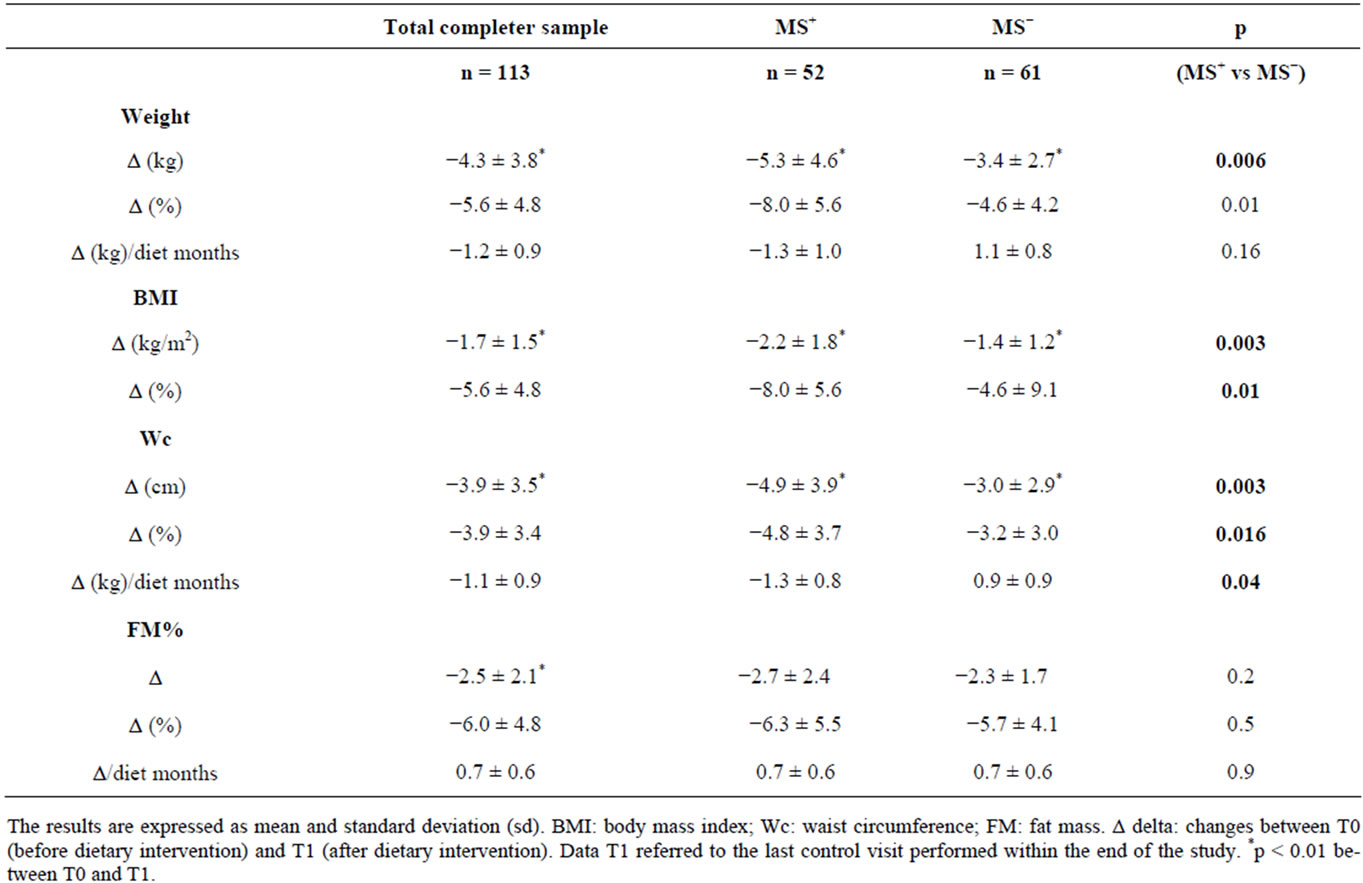
Table 6. Effects of dietary intervention on body composition.
two-thirds of obese individuals enrolling in a structured weight loss. In our study, the obesity condition was present in the 45% of total sample; among obese women the 67% met the IDF definition of MS. Although the two studies are different for criteria used (IDF vs ATP III), age and sex of the subjects, however both identified a similar prevalence of MS associated to obesity, confirming obesity as the predictor and the central feature of MS. Univariate and multivariate ORs for metabolic syndrome identified obesity as independent risk factor and one of the strongest predictor for the MS in menopause.
Wc is an anthropometric index of abdominal VAT and an important predictor of the lipid and non-lipid abnormalities associated with MS [29]. In our sample we measured the thickness of VAT by ultrasonography and we confirmed a direct and significant correlation with Wc (r2 = 0.5, p = 0.001). However Wc ≥ 80 cm recommended by IDF criteria as necessary risk factor to make diagnosis of MS was not a discriminating factor in our sample between MS+ and MS−: this was probably due to the high prevalence of overweight and obesity. Contrarily, the measurement of VAT resulted a valid method to identify patients with MS; in particular we identified that, independently by BMI, the subjects with VAT > 6.6 cm have an increased risk of 4 fold for MS; this confirms the important role of visceral fat in the aetiology of MS.

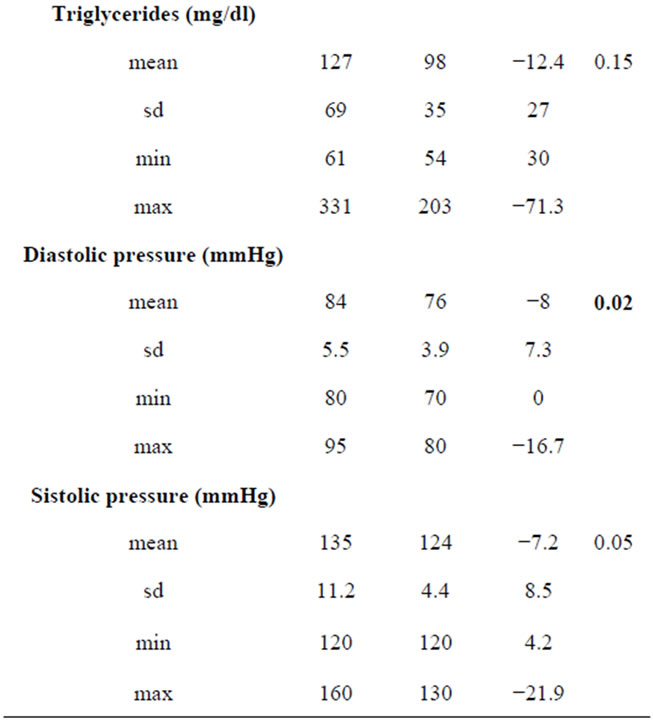
Table 7. Individual components of MS and prevalence of MS in subjects MS+ at T0 that achieved the therapeutic goal of 10% weight loss (n = 18).
Moreover it was interesting to observe as pregnancy could predispose to VAT deposition: in our sample women who had at least one pregnancy showed, with respect women who did not have, a significant greater VAT (5.5 ± 2.4 cm vs 3.9 ± 1.9 cm, p = 0.03) and a greater prevalence of MS (46% vs 25%, p = 0.002).
Concerning other risk factors investigated, education level resulted determinant of MS in univariate analysis; however multivariate analysis, adjusted for BMI, VAT and other confounding variables, showed that it is not an independent risk factor for MS. To explain this result we must consider that in our sample the 70% of subjects with a low level school was obese and among these the 87% met IDF criteria for MS. Then, our results showed that prevalence of MS in women with low level school is probably a consequence of obesity condition. This is in agreement with epidemiological data that show that low education level, hampering the knowledge of health risk associated to wrong dietary habits, is associated at higher risk of obesity, independently by the age and sex [30].
As other investigators reported [31], in this study, postmenopausal status, according to years since menopause, resulted a determinant for MS suggesting that the prevention of the risk factor for MS should begin in premenopausal age.
In addition the surgical menopause was more frequent in MS+ sample with respect MS− sample, however it did not result a direct predictor for MS, in according with previous studies [32]. The difference observed thus is probably related to the effect of years since menopause: in fact surgical menopause usually occurs before than physiological menopause.
Beyond to focus on body composition and metabolic risk factors in postmenopausal women, we examined the efficacy of a hypocaloric balanced diet on the improvement of nutritional status and on management of MS.
Drop-out rate found in our study was in according with drop-out rates reported in literature in obesity and overweight trials [33-35]. In compliant subjects the hypocaloric balanced diet resulted an effective method to lose weight and to modulate components of the metabolic syndrome.
Although we observed a significant reduction in BMI, Wc and FM both in women MS+ than MS−, however it is interesting to observe that MS+ women achieved a better reduction in BMI and Wc than MS− in the same period time. Moreover the therapeutic goal of the 10% weight loss was achieved by 35% of MS+ subjects with respect the 23% of MS− (p = 0.03). This suggest that the communication from a phisician of a diagnosis of MS and of related health risks could have induced a stronger motivation in MS+ women to comply with dietary program. We were surprised to observe that despite this result, both MS+ and MS− showed a similar FM reduction. This depends on values of single skinfolds measured by plicometry: in fact, we observed a greater reduction in MS+ with respect MS− women only for the biceps skinfold (p = 0.004), but not for triceps, subscapular and soprailiac skinfolds. In particular it was interesting to observe a significantly greater reduction of Wc (p = 0.003), despite a similar reduction of sovrailiac skinfold (p = 0.2). Since skinfolds measured subcutaneous fat stores [20], while Wc was related to VAT, our results suggest that the better weight loss obtained by MS+ group was associated more to a reduction of visceral than of subcutaneous fat.
We showed that the 10% weight loss induced by the hypocaloric balanced diet in MS+ postmenopausal women resulted in substantial reduction of systolic and diastolic pressure, fasting glucose and triglycerides, inducing a resolution of MS in the 78% of the sample. This result is in according with Case et al. [9] that studied the impact of weight loss by a moderate very low calorie diet on the metabolic syndrome in obese individuals. Moreover it is interesting to note that in our study the 10% weight loss was associated with a significant reduction of visceral obesity, even if there was not a significant reduction of the prevalence of Wc ≥ 80 cm; this result confirms the important role of visceral obesity as determinant of MS and underscores the usefulness of ultrasonography method to measure and follow up VAT reduction overcoming the potential limitation of Wc as determinant of MS.
In agreement with other studies [36], the main limitation of dietary intervention performed in free living people was the compliance at mid and long term. Although we confirmed that the 10% weight loss is an important therapeutical goal to achieve, because it is associated to the improvement and the resolution of MS, it is bewildering to note that only the 35% of the MS+ women obtained it. This result suggests the usefulness of strategies to increase the motivation and compliance of the patients, such as check-up at least every month with a dietician and psycological support when necessary, especially considering that menopause is a phase of the life associated to psychological distress and emotional symptoms [37], that could affect eating behaviour and compliance to nutritional programs.
In conclusion this study showed a consistent occurrence of MS in postmenopausal women that decide voluntary to follow a weight-loss program, an important role played by VAT as predictor of MS and a good efficacy of the hypocaloric balanced diet to lose weight and to improve the main aspects of MS, with a significant reduction of its prevalence.
REFERENCES
- R. R. Wing, K. A. Matthews, L. H. Kuller, E. N. Meilahn and P. L. Plantinga, “Weight Gain at the Time of Menopause,” Archives of Internal Medicine, Vol. 151, No. 1, 1991, pp. 97-102. doi:10.1001/archinte.1991.00400010111016
- A. J. Cameron, T. A. Welborn, P. Z. Zimet, et al., “OverWeight and Obesity in Australia: The 1999-2000 Australian Diabetes, Obesity and Lifestyles Study (AusDiab),” The Medical Journal of Australia, Vol. 178, No. 9, 2003, pp. 427-432.
- D. A. M. Kim, C. W. Ahn and S. Y. Nam, “Prevalence of Obesity in Korea,” Obesity Reviews, Vol. 6, No. 2, 2005, pp. 117-121. doi:10.1111/j.1467-789X.2005.00173.x
- C. L. Ogden, M. D. Carroll, L. R. Curtin, et al., “Prevalence of Overweight and Obesity in the United States, 1999-2004,” The Journal of the American Medical Association, Vol. 295, No. 13, 2006, pp. 1549-1555. doi:10.1001/jama.295.13.1549
- L. R. Simkin-Silverman and R. R. Wing, “Weight Gain during Menopause. Is It Inevitable or Can It Be Prevented?” Postgraduate Medicine, Vol. 108, No. 3, 2000, pp. 47-50. doi:10.3810/pgm.2000.09.1.1204
- L. R. Simkin-Silverman, R. R. Wing, M. A. Boraz and L. H. Kuller, “Lifestyle Intervention Can Prevent Weight Gain during Menopause: Results from a 5-Year Randomized Clinical Trial,” Annals of Behavioural Medicine, Vol. 26, No. 3, 2003, pp. 212-220. doi:10.1207/S15324796ABM2603_06
- I. Janssen, L. H. Powell, S. Crawford, B. Lasley and K. Sutton-Tyrrell, “Menopause and the Metabolic Syndrome: The Study of Women’s Health across the Nation,” Archives of Internal Medicine, Vol. 168, No. 14, 2008, pp. 1568-1575. doi:10.1001/archinte.168.14.1568
- O. Bosello and M. Zamboni, “Visceral Obesity and Metabolic Syndrome,” Obesity Reviews, Vol. 1, No. 1, 2000, pp. 47-56. doi:10.1046/j.1467-789x.2000.00008.x
- C. C. Case, P. H. Jones, K. Nelson, S. O’Brian Smith and C. M. Ballantyne, “Impact of Weight Loss on the Metabolic Syndrome,” Diabetes, Obesity and Metabolism, Vol. 4, No. 6, 2002, pp. 407-414. doi:10.1046/j.1463-1326.2002.00236.x
- D. E. M. Williams, A. T. Prevost, M. J. Whichelow, et al., “A Cross-Sectional Study of Dietary Patterns with Glucose Intolerance and Other Features of the Metabolic Syndrome,” British Journal of Nutrition, Vol. 83, No. 3, 2000, pp. 257-266. doi:10.1017/S0007114500000337
- T. M. A. Martínez-González, A. García-Arellano, E. Toledo, et al., “A 14-Item Mediterranean Diet Assessment Tool and Obesity Indexes among High-Risk Subjects: The PREDIMED,” Plos One, Vol. 7, No. 8, 2012, pp. 1-10.
- L. A. Hidalgo, P. A. Chedraui, N. Morocho, M. Alvarado, D. Chavez and A. Huc, “The Metabolic Syndrome among Postmenopausal Women in Ecuador,” Gynecological Endocrinology, Vol. 22, No. 8, 2006, pp. 447-454. doi:10.1080/09513590600890272
- W. Y. Lyn, W. S. Yang, L. T. Lee, et al., “Insulin Resistance, Obesity, and Metabolic Syndrome among Nondiabetic Preand Post-Menopausal Women in North Taiwan,” International Journal of Obesity, Vol. 30, No. 1, 2006, pp. 912-917. doi:10.1038/sj.ijo.0803240
- E. S. Ford, W. H. Giles and W. H. Dietz, “Prevalence of the Metabolic Syndrome among US Adults: Findings from the Third National Health and Nutrition Examination Survey,” The Journal of the American Medical Association, Vol. 287, No. 3, 2002, pp. 356-359. doi:10.1001/jama.287.3.356
- G. J. Cho, J. H. Lee, H. T. Park, et al., “Postmenopausal Status According to Years since Menopause as an Independent Risk Factor for the Metabolic Syndrome,” Menopause, Vol. 15, No. 3, 2008, pp. 524-529. doi:10.1097/gme.0b013e3181559860
- H. S. Park, Y. M. Lee and G. Y. Cho, “A Study on Climacteric Symptoms, Knowledge of Menopause, Menopausal Management in Middle-Aged Women,” Korean Journal of Women Health Nursing, Vol. 8, No. 4, 2002, pp. 521-528.
- B. Isomaa, M. Henricsson, P. Almgren, T. Tuomi, M. R. Taskinen and L. Groop, “The Metabolic Syndrome Influences the Risk of Chronic Complications in Patients with Type II Diabetes,” Diabetologia, Vol. 44, No. 9, 2001, pp. 1148-1154. doi:10.1007/s001250100615
- R. H. Eckel, S. M. Grundy and P. Z. Zimmet, “The Metabolic Syndrome,” Lancet, Vol. 365, No. 9468, 2205, pp. 1415-1428.
- M. C. Carr, “The Emergence of the Metabolic Syndrome with Menopause,” The Journal of Clinical Endocrinology and Metabolism, Vol. 88, No. 6, 2003, pp. 2404-2411.
- T. G. Lohman, A. F. Roche and R. Martorel, “Anthropometric Standardization Reference Manual,” Human Kinetics Books, Champagne, 1988.
- J. V. Durnin and J. Womersley, “Body Fat Assessed from Total Body Density and Its Estimation from Skinfold Thickness: Measurements on 481 Men and Women Aged from 16 to 72 Years,” British Journal of Nutrition, Vol. 32, No. 1, 1974, pp. 77-97. doi:10.1079/BJN19740060
- F. Armellini, M. Zamboni, L. Rigo, et al., “The Contribution of Sonography to the Measurement of Intra-Abdominal Fat,” Journal of Clinical Ultrasound, Vol. 18, No. 7, 1990, pp. 563-567. doi:10.1002/jcu.1870180707
- T. R. Isbell, R. C. Klesges, A. W. Meyers and L. M. Klesges, “Measurement Reliability and Reactivity Using Repeated Measurements of Resting Energy Expenditure with a Face Mask, Mouthpiece, and Ventilated Canopy,” Journal of Parenteral & Enteral Nutrition, Vol. 15, No. 2, 1991, pp.165-168. doi:10.1177/0148607191015002165
- J. B. V. de Weir, “New Methods for Calculatong Metabolic Rate with Special to Protein Metabolism,” The Journal of Physiology, Vol. 109, No. 1, 1949, pp. 1-9.
- J. A. Harris and F. G. Benedict, “A Biometric Study of Basal Metabolism in Man,” Carnegie Institute of Washington Publication, Washington, 1919.
- Istituto Nazionale di Ricerca per gli Alimenti e la Nutrizione (INRAN), “Guides Lines for an Healthy Nutrition,” 2003.
- Società Italiana di Nutrizione (SINU), “Recommended Assumption Levels of Energy and Nutrients for Italian Population—Livelli di Assunzione Raccomandata di Nutrienti per la Popolazione Italiana (L.A.R.N),” 1996.
- R. A. Lobo, “Syndrome after Menopause and the Role of Hormones,” Maturitas, Vol. 60, No. 1, 2008, pp. 10-18.
- M. C. Pouliot, J. P. Després, S. Lemieux, et al., “Waist Circumference and Abdominal Sagittal Diameter: Best Simple Anthropometric Indexes of Abdominal Visceral Adipose Tissue Accumulation and Related Cardiovascular Risk in Men and Women,” The American Journal of Cardiology, Vol. 73, No. 7, 1994, pp. 460-468. doi:10.1016/0002-9149(94)90676-9
- E. M. Inelmen, G. Sergi and A. Coin, “Can Obesity Be a Risk Factor in Elderly People?” Obesity Reviews, Vol. 4, No. 3, 2003, pp. 147-155. doi:10.1046/j.1467-789X.2003.00107.x
- G. J. Cho, J. H. Lee, H. T. Park, et al., “Postmenopausal Status According to Years since Menopause as an Independent Risk Factor for the Metabolic Syndrome,” Menopause, Vol. 15, No. 3, 2008, pp. 524-529. doi:10.1097/gme.0b013e3181559860
- S. Özdemir, C. Çelik, H. Görkemli, A. Kiyicib and B. Kayac, “Compared Effects of Surgical and Natural Menopause on Climacteric Symptoms, Osteoporosis, and Metabolic Syndrome,” International Journal of Gynaecology and Obstetrics, Vol. 106, No. 1, 2009, pp. 57-61.
- E. M. Inelmen, E. D. Toffanello, G. Enzi, et al., “Predictors of Drop-Out in Overweight and Obese Outpatients,” International Journal of Obesity, Vol. 29, 2005, pp. 122- 128. doi:10.1038/sj.ijo.0802846
- M. K. Mattfeldt-beman, S. A. Corrigan, V. J. Stevens, et al., “Participants’ Evaluation of a Weight-Loss Program,” Journal of the American Dietetic Association, Vol. 99, No. 1, 1999, pp. 66-71. doi:10.1016/S0002-8223(99)00018-8
- M. G. Perri, S. F. Sears and J. E. Clark, “Strategies for Improving Maintenance of Weight Loss,” Diabetes Care, Vol. 16, No. 1, 1993, pp. 200-209. doi:10.2337/diacare.16.1.200
- I. Strychar, “Diet in the Management of Weight Loss,” Canadian Medical Association Journal, Vol. 174, No. 1, 2006, pp. 56-63.
- K. A. Matthews, R. R. Wing, L. H. Kuller, et al., “Influences of Natural Menopause on Psychological Characteristics and Symptoms of Middle-Aged Healthy Women,” Journal of Consulting and Clinical Psychology, Vol. 58, No. 3, 1990, pp. 345-351.
NOTES
*Corresponding author.