Food and Nutrition Sciences
Vol.4 No.1(2013), Article ID:26642,10 pages DOI:10.4236/fns.2013.41009
Consumption of Dairy and Metabolic Syndrome Risk in a Convenient Sample of Mexican College Applicants
![]()
1Department of Food Science and Human Nutrition, University of Illinois, Urbana, USA; 2Department of Kinesiology and Community Health, University of Illinois, Urbana, USA; 3 Facultad de Medicina, Universidad Autónoma de San Luis Potosi, San Luis Potosí, Mexico.
Email: *teranmd@illinois.edu
Received November 27th, 2012; revised December 27th, 2012; accepted January 5th, 2013
Keywords: Dairy Intake; Young Adults; Metabolic Syndrome Risk; Obesity Prevention
ABSTRACT
The rise in metabolic syndrome (MetS) is accompanied by a decrease in milk and dairy consumption and an increase in sugar-sweetened beverage (SSB) consumption, with SSB possibly displacing dairy products in the diet. Our main objective was to determine whether young individuals not meeting the dairy recommendations of 3 servings per day were at greater risk for MetS. In a cross-sectional design, a food frequency questionnaire was answered by Mexican college applicants (n = 339). Medical examination at a primary health care center and evaluation for presence of MetS risk factors was completed as part of an ongoing collaborative project. Relative risk analyses were used to assess the impact of meeting or not the dairy recommendations for the presence of MetS. The MetS prevalence was 10. Three-fourths (76%) of participants were not meeting the daily recommendations. Individuals who failed to meet dairy recommendations were at 2.9 times greater risk for MetS when controlling for age, sex, family history of cardiovascular disease and type 2 diabetes, and physical activity. We did not found that SSB were displacing dairy products in the diet. Still, our data support the importance of meeting daily dairy recommendations for the prevention of MetS in young adults.
1. Introduction
Over the last decade, Mexico experienced the fastest rates of change for obesity globally, with overall prevalence of overweight and obesity approaching that of the United States [1]. Obesity rates are not only increasing in adults, but in children as well, causing a subsequent increase in obesity-related medical complications [2]. Obese individuals often exhibit abdominal obesity, insulin resistance, dyslipidemia, and hypertension, a cluster of risk factors known as metabolic syndrome (MetS). MetS is becoming increasingly prevalent in children and adolescents, with some reports estimating anywhere from 9.3% to 29% of Mexican and Latino individuals affected [3-5]. The alarming prevalence rates of MetS in this population have increased awareness of the contribution of dietary habits to the disease.
A fast nutritional transition is underway in Mexico, where the consumption of high-calorie beverages (not including milk) more than doubled for adolescents aged 12 to 18 years and tripled for adult women aged 19 to 48 years from 1999 to 2006 [1]. Several studies have shown that the increased consumption of high-calorie beverages is associated with overweight and obesity in adults, adolescents, and children [6,7]. Dairy products provide most of the daily requirement for dietary calcium, however daily intake of calcium and dairy declines during the transition from adolescence to young adulthood [8,9]. Regular consumption of milk seems to be replaced with greater consumption of other high-energy beverages that often do not provide any nutritional benefits.
Inverse relationships between dairy intake and its composite nutrients with central adiposity have been observed in all age groups [8-11]. Higher consumption of dairy has even been associated with lower body fat in children as young as 2 to 5 years [12]. Increased dietary calcium intake may be beneficial to blood pressure, insulin levels, and HDL-cholesterol (HDL-C) [13]. Additionally, the risk of developing type 2 diabetes mellitus (T2DM) can be reduced by long-term consumption of dairy products [14,15]. Overall, higher dairy intake has been related to decreased odds of impaired fasting glucose (IFG), hypertriglyceridemia, and seems to elicit a protective effect on MetS development [16-18]. However, some studies have shown that dairy consumption has no effect on MetS risk factors [9,17,19]. Given the heterogeneous nature of MetS and the diversity of dietary patterns, it is important to investigate the contribution of dairy consumption to risk of metabolic disease.
This study aims to determine 1) the prevalence of MetS risk factors in college age individuals who were meeting or not meeting the recommended 3 daily servings of dairy; 2) the contribution of sugar-sweetened beverages (SSB) on the displacement of dairy products; and 3) the contribution of dairy consumption to the relative risk of individual or combined components of MetS.
2. Materials and Methods
2.1. Study Population and Procedures
Participants were selected from the 2009 UP AMIGOS cohort (Universities of San Luis Potosí and Illinois: A Multidisciplinary Investigation on Genetics, Obesity, and Social-Environment) of college applicants aged 18 to 25 years to the Autonomous University of San Luis Potosí (Universidad Autónoma de San Luis Potosí, UASLP) who were seeking admission for the 2010 school cycle between February and July of 2009. As part of the UASLP application process, all participants were submitted to a health screen at the university clinic. The health screen consisted of: 1) anthropometric measurements, including height, weight, waist circumference (WC), and blood pressure; 2) a medical interview and physical exam executed by a physician; 3) a blood draw following an overnight fast for biological markers; and 4) a food frequency questionnaire (FFQ) based upon the Willett FFQ adapted for the Mexican population (FFQMx) [20]. Individuals willing to participate were apprised of study goals and their rights for our ongoing collaborative project before signing the informed consent form. The protocol was reviewed and approved by both Institutional Review Boards at UASLP and at the University of Illinois at Urbana-Champaign.
2.2. Participant Selection
Participants for this convenient cross-sectional study subset were selected based upon the degree of completion of data available from the health clinic assessment, including a complete lipid profile, and completion of 90% or more from the FFQ-Mx. Individuals with calorie consumption ± 4 SD were excluded (n = 4). Individuals with a Body Mass Index (BMI) ≤ 18.49 kg/m2 and ≥ 40.00 kg/m2 were also excluded to prevent skewing results of the study. Therefore, this subset consisted of 339 individuals.
2.3. Anthropometric Measures
All measures were conducted by trained health professsionals at the UASLP health clinic. Height was measured twice in the same visit using a stadiometer and was recorded to the nearest 0.5 cm, with the final measurement representing an average of the two measures. Weight was collected twice in the same visit on a calibrated scale and recorded to the nearest 0.1 kg, with the final measurement representing an average of the two measures. BMI was calculated and classified according to the World Health Organization [21] as follows: underweight (≤ 18.49 kg/m2), normal weight (18.50 - 24.99 kg/m2), overweight (25.00 29.99 kg/m2), and obese (≥30.00 kg/ m2). WC was measured using a flexible, non-stretching nylon tape at the level of the iliac crest following normal expiration with the subject in the standing position and was recorded to the nearest 0.1 cm. WC risk level for metabolic syndrome was determined according to the International Diabetes Federation (IDF)/American Heart Association (AHA) population and sex-specific joint definition: at risk males (≥90 cm) and at risk females ≥80 cm) [22].
2.4. Blood Pressure
Blood pressure (BP) was measured by trained, certified health care providers according to a protocol adapted from AHA-recommended procedures. BP was taken on the dominant arm (right arm in most cases) in the seated position using appropriately sized Welch Allyn cuffs. According to the harmonized definition for MetS, elevated blood pressure was defined as systolic BP (SBP) ≥130 mmHg and/or diastolic BP (DBP) ≥85 mmHg [22].
2.5. Biological Markers
Following the medical examination, overnight (≥8 hours) fasting blood samples were collected. All samples were measured in the Alcyon 300 autoanalyzer (Abbott, Illinois, USA, with reagents from BioSystems, Mexico). Fasting glucose (FG) was determined according to the glucose oxidase peroxidase method. Impaired FG was defined as having FG > 100 mg/dL [22]. Serum triglycerides (TG) were determined according to the glycerol phosphate oxidase peroxidase method, based on a colorimetric enzymatic reaction. HDL-C was determined by a direct method in which a detergent solubilized the HDL-C, which was then quantified spectrophotometrically according to the cholesterol oxidase method. Hypertriglyceridemia was defined as TG ≥ 150 mg/dL, while low serum HDL-C was defined as HDL-C < 40 mg/dL (males) and <50 mg/dL (females) [22].
2.6. Metabolic Syndrome Definition
MetS was defined according to the IDF/AHA joint criteria of having three or more of the following: 1) increased WC, at risk males ≥ 90 cm and at risk females ≥ 80 cm; 2) elevated blood pressure (EBP); 3) IFG; 4) hypertriglyceridemia, and 5) low HDL-C [22].
2.7. Dietary Assessment
Participants completed the validated FFQ-Mx that includes commonly consumed foods and beverages in Mexico [20]. The FFQ-Mx was administered in a group setting with a facilitator to ensure clarity of instructions. Questionnaire responses were entered into the SNUT (Sistema de Evaluacion de Habitos Nutricionales y Consumos de Nutrimientos; developed by the National Institute of Public Health, Mexico) nutrition software for nutrient analysis. Results from the nutrient analysis were calculated by the SNUT software and exported to SAS software, version 9.2, for further data analysis. Frequency of consumption estimates were determined by using the following weights that correspond to survey responses: 1) 6 for reported frequencies of 6 or more per day; 2) 4.5 for 4 - 5 per day; 3) 2.5 for 2 - 3 per day; 4) 1 for 1 per day; 5) 0.8 for 5-6 per week; 6) 0.43 for 2 - 4 per week; 7) 0.08 for 2 - 3 per month and 8) 0.016 for 1 or less per month [20]. In order to calculate weekly consumption serving frequencies, the values obtained for daily consumption were multiplied by 7. Portion sizes of the foods included in the current study are shown in Table 1.
Table 1. List of food categories evaluated from the adapted Willet-food frequency questtionarie and portion sizes.
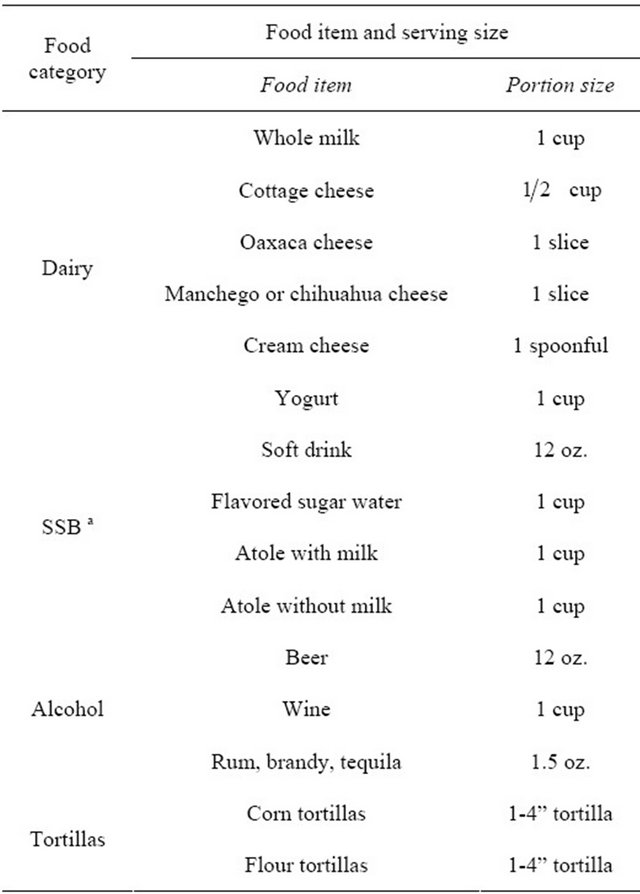
a. SSB, sugar-sweetened beverages.
Participants were categorized into two groups based upon the United States Department of Agriculture (USDA) recommendations: 1) meeting or 2) not meeting dairy recommendations if their total reported daily servings (s) were ≥3 s/day or <3 s/day, respectively. Dairy items on the questionnaire constituted the following milk-based foods: cottage cheese, Oaxaca cheese, Manchego or Chihuahua cheese, cream cheese, yogurt, and ice cream. Sugar-sweetened beverage (SSB) items on the questionnaire included: soft drinks, flavored sugar water, atole with milk, and atole without milk. (Atole is a traditional cornstarch-based drink that typically consists of a mixture of cornstarch, water, sugar, cinnamon, and sometimes milk).
2.8. Physical Activity
Physical activity (PA) was assessed by administering the long version of the International Physical Activity Questionnaire (IPAQ) [23]. Responses were categorized into three groups based on ever having engaged in PA: 1) low or no PA; 2) moderate PA; and 3) high or vigorous PA. Exercise duration was not included in this analysis.
3. Statistical Analysis
The SAS package version 9.2 (SAS Institute, Cary, NC, USA) was used for all statistical analyses. All continuous variables were assessed for normality and log-transformed (log10), if needed, before performing any statistical analyses. Except for BMI, WC, SBP, DBP, FG, total energy and calcium intake, the remaining variables were log-transformed in order to perform the analysis. Oneway ANOVA tests were performed to compare differences between individuals meeting and not meeting daily dairy recommendations. Differences were considered significant at the level of a < 0.05. Total weekly dairy serving(s) was calculated as the sum of servings of cheese (cottage, Oaxaca, Manchego or Chihuahua, cream cheese), yogurt, and ice cream. Total SSB was calculated as the sum of servings consumed from soft drinks, flavored sugar water, atole with milk, and atole without milk. Relative risk (RR) ratios to assess individual or combined components of MetS were estimated using modified Poisson logistic regressions and various adjustment models [24]. Here, we report on three main models: 1) adjusted for age and sex; 2) adjusted for age, sex, and energy intake; and 3) adjusted for age, sex, energy intake, family history of cardiovascular disease and T2DM, and PA. Categorizations used in the Poisson logistic regressions were: 1) consumption of <7 whole milk s/week; 2) consumption of <7 cheese s/week, to represent consumption below 1 s/day; and 3) not meeting dairy requirements of 21 dairy s/week, or 3 s/day.
4. Results
Overall, MetS was present in 10.5% of the individuals (n= 36). The prevalence of MetS and individual risk factors are shown in Table 2. Low HDL-C was the most common risk factor observed (51.3%), followed by increased WC (45.2%). The prevalence of EBP, IFG, and hypertriglyceridemia were 19.5%, 12.5%, and 19.8%, respectively. The prevalence of MetS and individual MetS risk factors between individuals who were not meeting the daily recommendations was 2.6 to 4.1 times higher compared to those meeting the recommendations (Table 2).
Table 2. Prevalence of metabolic syndrome and individual risk factors in young Mexicans, according to dairy intake categories (meeting or not-meeting recommendations).
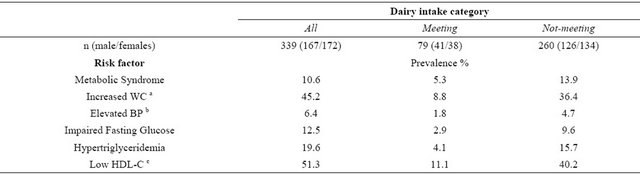
a. WC, waist circumference; b. BP, blood pressure; c. HDL-C, high-density lipoprotein cholesterol.
Table 3. Comparision of serving intake on selected food groups, including dairy products, between individuals meeting or not meeting daily dairy recommendations.
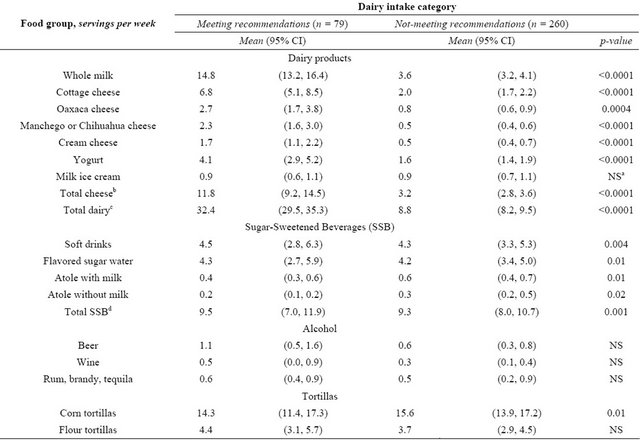
aNS, not-significant differences; bTotal cheese is the sum of cottage, Oaxaca and Manchego or Chihuahua cheeses; cTotal dairy is the sum of total cheese plus whole milk, yogurt, and ice cream; dTotal SSB is the sum of soft drinks, flavored sugar water, atole with milk, and atole without milk.
Seventy-six percent of participants (n = 260) were not meeting the dairy recommendations of at least 3 s/day. Individuals meeting dairy recommendations consumed more energy per day (2880 vs. 2016 kcal, p < 0.0001) and total calcium (1145 vs. 600 mg, p < 0.0001), as well as all dairy products, except for ice cream (Table 3). Differences in weekly beverage consumption were small. Participants meeting dairy recommendations consumed slightly more flavored sugar water (4.3 vs. 4.2 s/week, p = 0.01) and total SSB overall (9.5 vs. 9.3 s/week, p = 0.001). Individuals who were not meeting dairy recommendations consumed more atole with milk (0.6 vs. 0.4 s/week, p = 0.01) and atole without milk (0.3 vs. 0.2 s/week, p = 0.02). Corn tortillas, a source of dietary calcium aside from dairy and other traditional dietary calcium sources, were consumed more frequently by individuals not meeting dairy recommendations (15.6 vs. 14.3 s/week, p = 0.01). There were no differences in alcohol consumption. There were no differences in BMI or any absolute values of the individual components of MetS when comparing individuals who were meeting or not meeting daily dairy recommendations (Table 4).
The two most common MetS risk factors observed in this study were low HDL-C and increased WC. These two factors combined were present in 26.0% (n = 88) of the population, while 28.6% (n = 97) individuals had none of the MetS risk factors. When contrasting the two groups, individuals with increased WC and low HDL-C had also higher BMI and serum TG but no differences in SBP, DBP, or FG. There were no differences in energy, calcium or total dairy intake, and consumption of SSB, alcohol, or tortillas between the two groups (data not shown).
We evaluated the contribution of three dairy consumption patterns to the relative risk of presenting individual or combined components of MetS. The reference patterns included: consumption of <7 s/week of 1) whole milk or 2) cheese; and 3) not meeting daily dairy recommendations. The first two patterns did not show differences in risk for presenting individual or combined components of MetS. However, individuals not meeting dairy recommendations were at 3.7 times (95% CI 1.2 - 11.7, p = 0.02) greater risk for MetS than those meeting the recommendations, after controlling for age, sex, and total calorie intake (Table 5). This risk remains high, 2.9 (95% CI 1.0 - 8.3, p = 0.05), when further adjustment for potential confounders were included in the model (same as above, plus family history of cardiovascular disease or T2DM, and physical activity).
5. Discussion
The current study aimed to determine the prevalence of MetS and individual risk factors and to assess the potential risk for MetS when not meeting daily dairy recommendations. The young adults participating in this study were considered “healthy”; still, almost 11% had MetS. Our prevalence was similar to the 9.3% reported in Mexican children and adolescents [4], but higher than the reported 3.7% in a subset of Mexican young adults or Caucasians of similar age range [25,26].
Notably, the prevalence of MetS was lower in individuals who were meeting dairy recommendations than in those who were not meeting recommendations (5.3% vs. 13.9%). Data from ENSANUT reported that in 2006, 49.8% of adults ages 20 years and older had MetS [27], though it is important to mention that this higher prevalence is related to the inclusion of older individuals. Indeed, increased age is associated with higher prevalence of slowly developing MetS related diseases, such as hypertension and diabetes, which are the two main causes of death in the Mexican adult population.
Table 4. Comparison of metabolic characteristics of young Mexicans according to daily dairy intake categorya.
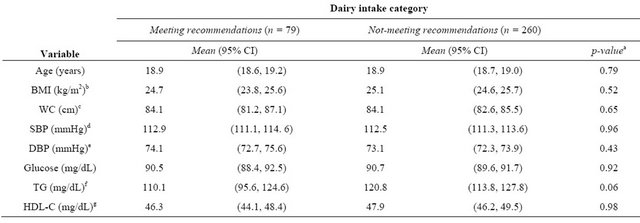
aAll variables, except age, were adjusted for age, sex, and daily calorie intake; bBMI, body mass index; cWC, waist circumference; dSBP, systolic blood pressure; eDBP, diastolic blood pressure; fTG, serum triglycerides; gHDL-C, High-density lipoprotein Cholesterol. All individuals were fasting before blood draw.
Table 5. Relative risk (RR) for individual and combined risk factors of Metabolic Syndrome (MetS) according to dairy intake in young Mexican adults (18 - 25 years).
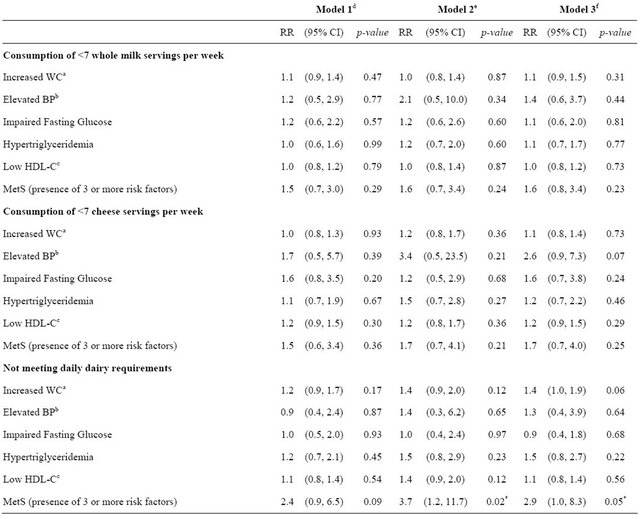
aWC, waist circumference; bBP, blood pressure; cHDL-C, high-density lipoprotein cholesterol; dModel 1, adjusted for age and sex; eModel 2, adjusted for age, sex, and total calorie intake; fModel 3, adjusted for age, sex, total total calorie intake, family history of cardiovascular disease and type 2 diabetes, and physical activity.*p-value < 0.05.
Individuals meeting dairy recommendations also had lower prevalence of all individual MetS risk factors; however, the absolute values of lipid, glucose, or other MetS parameters were not different between subjects meeting and not meeting daily dairy recommendations. Our finding of no difference in those absolute values between the two categorical groups is not unlike other observations. Some studies have shown that there is no significant relationship between dairy consumption and BMI [9,19]. Still, we did observe that individuals who were not meeting dairy recommendations were approximately 3 times more likely to be at risk for MetS. Our results concur with other reports from Middle East and European populations that have shown that individuals who consume higher amounts of dairy have a lower prevalence of MetS [28-30].
Over three-fourths (76%) of the Mexican young adults participating in this study were not meeting the recommended three daily servings of dairy foods and had higher risk of presenting MetS. This low daily intake data is comparable to a study conducted in a US representative sample of 1956 adolescents ages 12 to 19 years, which found that only 25% of these individuals were meeting daily milk consumption recommendations [31]. Our observations also held with a recent report in which Mexicans eating a Westernized dietary pattern, of which low dairy consumption is a defining characteristic, have increased odds for obesity, abdominal obesity, and high body fat percent [32].
The two most frequent MetS risk factors observed in this study were increased WC and low HDL cholesterol. The combined prevalence of those two factors has been shown to be higher in Hispanic populations than in other ethnic groups [5]. We also found that abdominal obesity was more common in females than in males. This finding concurs with reports from the National Health and Nutrition Survey 2006 (ENSANUT 2006) in Mexico, which used the same IDF/AHA MetS defining criteria. Results from ENSANUT 2006 showed that 83.8% of females versus 62.9% of males had increased WC and 52.7% of females versus 46.4% of males had MetS [27]. We investigated if greater or lower consumption of dairy was associated with the presence of these two risk factors, but we did not find an association (data not shown).
Consumption of dairy products may also be protective to some MetS risk factors. Individuals consuming higher amounts of dairy have been shown to have lower body fat [33], a relationship further supported by findings of an inverse relationship between dairy consumption and BMI in several studies [11,34,35]. Increased dairy consumption has also been shown to have a strong inverse association with insulin resistance syndrome among overweight adults and may also reduce the risk of T2DM and cardiovascular disease [36]. Although biological and molecular mechanisms remain a matter of debate, the current evidence suggests a negative association between dairy consumption and body weight [37]. Our study provides further support for the reduction of MetS risk when consuming dairy products at recommended levels.
In some populations, increased SSB consumption may be displacing the consumption of milk and contributing to adverse health conditions [1,38], while in others consumption of SSB tends to level off after adolescence [39]. Higher SSB consumption has been associated with overall cardiometabolic risk, particularly, higher risk of high WC, high LDL cholesterol, and high TG [40]. Here, we did not observe a displacement of milk by SSB in individuals not meeting dairy recommendations; in fact, individuals meeting dairy recommendations consumed slightly more SSB. It could be reasonable to speculate that individuals who did not meet dairy recommendations may have been replacing dairy products with SSB, while those meeting dairy recommendations were simply adding the extra SSB to their diet.
We observed a significant difference in energy intake between the two groups. Individuals meeting dairy recommendations consumed more daily calories (on average) that those not meeting recommendations. Despite this difference, there was no difference in BMI or any individual MetS risk factors between these groups. After further analysis to determine the source of additional energy intake (data not shown), the only foods consumed more by the group meeting dairy recommendations and substantially enough to contribute to the energy difference were the dairy foods—milk, cheese, and yogurt in particular. Additional analyses will be conducted to investigate the possible contribution of fruits, vegetables or other food groups to the difference of energy intake between the two groups.
The strengths and weaknesses of this study need to be discussed. First, this study focuses on individuals aged 18 to 25 years, which tends to be a “medically neglected” age group due to the lack of regular health screening by a physician. Individuals may begin to see a physician for a preventive care visit infrequently prior to this age and as early as the age of 13 years [41]. These findings support the need not only for more prevention and intervention programs for adolescents and young adults, but for early detection strategies as well. Young adults tend to be more self-reliant, in which lifestyle changes may be more successful in order to prevent the development of MetS and/or reverse the development of other diseases in affected individuals. Furthermore, our data support a simple public health message that is easy to deliver and yields practical, positive results.
Our limitations include the small sample size and our inability to directly measure eating patterns, precluding us to generalize our interpretation of the results. We considered the possibility of residual confounding; however, we determined that this phenomenon was unlikely due to the greater prevalence of MetS that was observed in individuals who did not meet dairy recommendations, which supports the nearly 3 times greater risk for MetS in these individuals. Similar methodology has been applied to studies with larger sample size and wide age range reporting that the MetS risk is associated with a Westernized dietary pattern [42,43]. The cross-sectional study design limits causality inferences, as individuals may have a number of reasons to restrict dairy in the diet. Aside from dietary changes, another reason for restricttion of dairy is the incidence of lactose intolerance [44], an aspect on which we did not have data. Another limitation of this study is the self-reporting nature of our data collection. It is known that individuals tend to underreport calorie intake and that overweight and obese individuals underreport more than normal weight individuals [45,46]. We also could not determine the amount of milk used to make the atole with milk that was consumed, so these quantities could not be added for group comparesons. Lastly, we did not measure or evaluate for differences in low-fat vs. high-fat dairy products due to the lack of low-fat dairy in a typical Mexican diet.
In summary, Mexican college applicants who were not meeting daily dairy recommendations triplicated their risk for presenting MetS. Our results suggest that simply meeting dairy recommendations may serve as an effecttive dietary prevention and intervention measure to reduce individual risk for MetS. Adopting the USDA daily dairy recommendation as a habit early in life is a low cost approach to have a positive impact in maintaining health and decreasing metabolic disease risk.
7. Acknowledgements
Data presented here is a subproject of the UP AMIGOS study group (Universities of San Luis Potosi and Illinois: A Multidisciplinary Investigation on Genetics, Obesity and Social-environment). We are grateful to all applicants, medical personnel, and nurses participating in the 2009 data collection in San Luis Potosí. The 2009 study group include: University of Illinois at UrbanaChampaign, USA: F.C.D.A., Marcela Raffaelli (M.R.), M.T.-G., Angela R. Wiley; Universidad Autónoma de San Luis Potosí (UASLP), Mexico: C.A.-G, Esperanza de la Cruz Mendoza, Eduardo Medina Cerda, Diana Patricia Portales Pérez, Carmen Rojas, Omar Sánchez Armáss, Sergio Rosales Mendoza, Juan Manuel Vargas Morales; and the Instituto Mexicano Del Seguro Social in Durango, Mexico: Fernando Guerrero-Romero (scientific advisor), Martha Rodríguez Moran, and Luis E. Simental-Mendia. This study was funded by 1) the UASLP, Hormones Laboratory at the School of Medicine, the Clinical Biochemistry Laboratory at the Chemical Sciences School, and the UASLP University Health Center under agreement support C09-PIFI- 030606 (to C.A.-G.) and 2) the University of Illinois at Urbana-Champaign Research Board grant #09070 (to F.C.D.A.); CHAD grant (to F.C.D.A.); and the USDA National Institute of Food and Agriculture, Hatch Projects #600108-793000-793323 (to M.R.) and #600109- 698000-698354 (to M.T.-G).
REFERENCES
- S. Barquera, L. Hernandez-Barrera, M. L. Tolentino, J. Espinosa, S. W. Ng, J. A. Rivera and B. M. Popkin, “Energy Intake from Beverages Is Increasing among Mexican Adolescents and Adults,” Journal of Nutrition, Vol. 138, No. 12, 2008, pp. 2454-2461. doi:10.3945/jn.108.092163
- S. Cook, et al., “Prevalence of a Metabolic Syndrome Phenotype in Adolescents: Findings from the Third National Healthand Nutrition Examination Survey, 1988- 1994,” Archives of Pediatrics & Adolescent Medicine, Vol. 157, No. 8, 2003, pp. 821-827. doi:10.1001/archpedi.157.8.821
- H. E. Castillo, et al., “Body Mass Index and the Prevalence of Metabolic Syndrome among Children and Adolescents in Two Mexican Populations,” Journal of Adolescent Health, Vol. 40, No. 6, 2007, pp. 521-526. doi:10.1016/j.jadohealth.2006.12.015
- F. Guerrero-Romero, et al., “Birth Weight, Family History of Diabetes, and Metabolic Syndrome in Children and Adolescents,” Journal of Pediatrics, Vol. 156, No. 5, 2010, pp. 719-723. doi:10.1016/j.jpeds.2009.11.043
- S. E. Messiah, et al., “Prevalence of Metabolic Syndrome in US-Born Latin and Caribbean Youth,” Journal of Immigrant and Minority Health, Vol. 11, No. 5, 2009, pp. 366-371. doi:10.1007/s10903-008-9219-2
- D. S. Ludwig, et al., “Relation between Consumption of Sugar-Sweetened Drinks and Childhood Obesity: A Prospective, Observational Analysis,” Lancet, Vol. 357, No. 9255, 2001, pp. 505-508. doi:10.1016/S0140-6736(00)04041-1
- J. A. Welsh, et al., “Overweight among Low-Income Preschool Children Associated with the Consumption of Sweet Drinks: Missouri, 1999-2002,” Pediatrics, Vol. 115, No. 2, 2005, pp. e223-e229. doi:10.1542/peds.2004-1148
- M. A. Beydoun, et al., “Ethnic Differences in Dairy and Related Nutrient Consumption among US Adults and Their Association with Obesity, Central Obesity, and the Metabolic Syndrome,” The American Journal of Clinical Nutrition, Vol. 87, No. 6, 2008, pp. 1914-1925.
- B. M. Brooks, et al., “Association of Calcium Intake, Dairy Product Consumption with Overweight Status in Young Adults (1995-1996): The Bogalusa Heart Study,” The American Journal of Clinical Nutrition, Vol. 25, No. 6, 2006, pp. 523-532.
- L. C. dos Santos, et al., “Calcium Intake and Its Relationship with Adiposity and Insulin Resistance in Post-Pubertal Adolescents,” The American Journal of Clinical Nutrition, Vol. 21, No. 2, 2008, pp. 109-116. doi:10.1111/j.1365-277X.2008.00848.x
- P. Mirmiran, et al., “Dairy Consumption and Body Mass Index: An Inverse Relationship,” International Journal of Obesity, Vol. 29, No. 1, 2005, pp. 115-121. doi:10.1038/sj.ijo.0802838
- B. R. Carruth and J. D. Skinner, “The Role of Dietary Calcium and Other Nutrients in Moderating Body Fat in Preschool Children,” International Journal of Obesity, Vol. 25, No. 4, 2001, pp. 559-566. doi:10.1038/sj.ijo.0801562
- P. Drouillet, et al., “Calcium Consumption and Insulin Resistance Syndrome Parameters. Data from the Epidemiological Study on the Insulin Resistance Syndrome (DESIR),” Nutrition, Metabolism and Cardiovascular Diseases, Vol. 17, No. 7, 2007, pp. 486-492. doi:10.1016/j.numecd.2007.01.006
- H. K. Choi, et al., “Dairy Consumption and Risk of Type 2 Diabetes Mellitus in Men: A Prospective Study,” Archives of Internal Medicine, Vol. 165, No. 9, 2005, pp. 997-1003. doi:10.1001/archinte.165.9.997
- P. C. Elwood, et al., “The Survival Advantage of Milk and Dairy Consumption: An Overview of Evidence from Cohort Studies of Vascular Diseases, Diabetes and Cancer,” Journal of the American College of Nutrition, Vol. 27, No. 6, 2008, pp. 723S-734S.
- S. Hong, et al., “A Fruit and Dairy Dietary Pattern Is Associated with a Reduced Risk of Metabolic Syndrome,” Metabolism, Vol. 61, No. 6, 2012, pp. 883-890. doi:10.1016/j.metabol.2011.10.018
- J. C. Louie, et al., “Dairy Consumption and Overweight and Obesity: A Systematic Review of Prospective Cohort Studies,” Obesity Reviews, Vol. 12, No. 7, 2011, pp. e582-e592. doi:10.1111/j.1467-789X.2011.00881.x
- P. L. Lutsey, et al., “Dietary Intake and the Development of the Metabolic Syndrome: The Atherosclerosis Risk in Communities Study,” Circulation, Vol. 117, No. 6, 2008, pp. 754-761. doi:10.1161/CIRCULATIONAHA.107.716159
- M. B. Snijder, et al., “Is Higher Dairy Consumption Associated with Lower Body Weight and Fewer Metabolic Disturbances? The Hoorn Study,” The American Journal of Clinical Nutrition, Vol. 85, No. 4, 2007, pp. 989-995.
- M. Hernandez-Avila, et al., “Validity and Reproducibility of a Food Frequency Questionnaire to Assess Dietary Intake of Women Living in Mexico City,” Salud Pública de México, Vol. 40, No. 2, 1998, pp. 133-140. doi:10.1590/S0036-36341998000200005
- World Health Organization, “Obesity: Preventing and Managing the Global Epidemic. Report of a WHO Consultation,” World Health Organization Technical Report Series, Vol. 894, 2000, pp. 1-253.
- K. G. Alberti, et al., “Harmonizing the Metabolic Syndrome: A Joint Interim Statement of the International Diabetes Federation Task Force on Epidemiology and Prevention; National Heart, Lung, and Blood Institute; American Heart Association; World Heart Federation; International Atherosclerosis Society; and International Association for the Study of Obesity,” Circulation, Vol. 120, No. 16, 2009, pp. 1640-1645. doi:10.1161/CIRCULATIONAHA.109.192644
- P. C. Hallal and C. G. Victora, “Reliability and Validity of the International Physical Activity Questionnaire (IPAQ),” Medicine & Science in Sports & Exercise, Vol. 36, No. 3, 2004, p. 556. doi:10.1249/01.MSS.0000117161.66394.07
- D. Spiegelman and E. Hertzmark, “Easy SAS Calculations for Risk or Prevalence Ratios and Differences,” American Journal of Epidemiology, Vol. 162, No. 3, 2005, pp. 199-200. doi:10.1093/aje/kwi188
- J. Fernandes and I. E. Lofgren, “Prevalence of Metabolic Syndrome and Individual Criteria in College Students,” The Journal of American College Health, Vol. 59, No. 4, 2011, pp. 313-321. doi:10.1080/07448481.2010.508084
- E. Gonzalez Deschamps, et al., “Metabolic Syndrome Prevalence and Its Association with the Body Mass Index in University Students,” Medicina Clínica, Vol. 129, No. 20, 2007, pp. 766-769. doi:10.1157/13113766
- R. Rojas, et al., “Metabolic Syndrome in Mexican Adults: Results from the National Health and Nutrition Survey 2006,” Salud Pública de México, Vol. 52, 2010, pp. S11- S18. doi:10.1590/S0036-36342010000700004
- L. Azadbakht, et al., “Dairy Consumption Is Inversely Associated with the Prevalence of the Metabolic Syndrome in Tehranian Adults,” The American Journal of Clinical Nutrition, Vol. 82, No. 3, 2005, pp. 523-530.
- P. C. Elwood, et al., “Milk and Dairy Consumption, Diabetes and the Metabolic Syndrome: The Caerphilly Prospective Study,” Journal of Epidemiology & Community Health, Vol. 61, No. 8, 2007, pp. 695-698. doi:10.1136/jech.2006.053157
- F. Fumeron, et al., “Dairy Consumption and the Incidence of Hyperglycemia and the Metabolic Syndrome: Results from a French Prospective Study, Data from the Epidemiological Study on the Insulin Resistance Syndrome (DESIR),” Diabetes Care, Vol. 34, No. 4, 2011, pp. 813-817. doi:10.2337/dc10-1772
- R. S. Sebastian, et al., “US Adolescents and MyPyramid: Associations between Fast-Food Consumption and Lower Likelihood of Meeting Recommendations,” Journal of the American Dietetic Association, Vol. 109, No. 2, 2009, pp. 226-235. doi:10.1016/j.jada.2008.10.053
- E. Denova-Gutierrez, et al., “Dietary Patterns Are Associated with Different Indexes of Adiposity and Obesity in an Urban Mexican Population,” Journal of Nutrition, Vol. 141, No. 5, 2011, pp. 921-927. doi:10.3945/jn.110.132332
- L. I. Mennen, et al., “Possible Protective Effect of Bread and Dairy Products on the Risk of the Metabolic Syndrome,” Nutrition Research, Vol. 20, No. 3, 2000, pp. 335-347. doi:10.1016/S0271-5317(00)00127-5
- P. Marques-Vidal, et al., “Milk Intake Is Inversely Related to Obesity in Men and in Young Women: Data from the Portuguese Health Interview Survey 1998-1999,” International Journal of Obesity, Vol. 30, No. 1, 2006, pp. 88-93. doi:10.1038/sj.ijo.0803045
- C. S. Moore, et al., “Dietary Strategy to Manipulate ad Libitum Macronutrient Intake, and Glycaemic Index, across Eight European Countries in the Diogenes Study,” Obesity Reviews, Vol. 11, No. 1, 2010, pp. 67-75. doi:10.1111/j.1467-789X.2009.00602.x
- M. Varenna, et al., “Effects of Dietary Calcium Intake on Body Weight and Prevalence of Osteoporosis in Early Postmenopausal Women,” The American Journal of Clinical Nutrition, Vol. 86, No. 3, 2007, pp. 639-644.
- M. A. Pereira, et al., “Dairy Consumption, Obesity, and the Insulin Resistance Syndrome in Young Adults: The CARDIA Study,” Journal of the American Medical Association, Vol. 287, No. 16, 2002, pp. 2081-2089. doi:10.1001/jama.287.16.2081
- A. Dougkas, et al., “Associations between Dairy Consumption and Body Weight: A Review of the Evidence and Underlying Mechanisms,” Nutrition Research Reviews, Vol. 24, No. 1, 2011, pp. 72-95. doi:10.1017/S095442241000034X
- G. C. Rampersaud, et al., “National Survey Beverage Consumption Data for Children and Adolescents Indicate the Need to Encourage a Shift toward More Nutritive Beverages,” Journal of the Academy of Nutrition and Dietetics, Vol. 103, No. 1, 2003, pp. 97-100. doi:10.1053/jada.2003.50006
- M. C. Nelson, et al., “Five-Year Longitudinal and Secular Shifts in Adolescent Beverage Intake: Findings from Project EAT (Eating among Teens)-II,” Journal of the Academy of Nutrition and Dietetics, Vol. 109, No. 2, 2009, pp. 308-312. doi:10.1016/j.jada.2008.10.043
- J. D. Nordin, et al., “Adolescent Primary Care Visit Patterns,” The Annals of Family Medicine, Vol. 8, No. 6, 2010, pp. 511-516. doi:10.1370/afm.1188
- A. A. Bremer, et al., “Differences in Male and Female Adolescents from Various Racial Groups in the Relationship between Insulin Resistance-Associated Parameters with Sugar-Sweetened Beverage Intake and Physical Activity Levels,” Clinical Pediatrics, Vol. 49, No. 12, 2010, pp. 1134-1142. doi:10.1177/0009922810379043
- K. J. Duffey, et al., “Drinking Caloric Beverages Increases the Risk of Adverse Cardiometabolic Outcomes in the Coronary Artery Risk Development in Young Adults (CARDIA) Study,” The American Journal of Clinical Nutrition, Vol. 92, No. 4, 2010, pp. 954-959. doi:10.3945/ajcn.2010.29478
- N. S. Scrimshaw and E. B. Murray, “The Acceptability of Milk and Milk Products in Populations with a High Prevalence of Lactose Intolerance,” The American Journal of Clinical Nutrition, Vol. 48, Suppl. 4, 1988, pp. 1079-1159.
- S. Voss, et al., “Obesity as a Major Determinant of Underreporting in a Self-Administered Food Frequency Questionnaire: Results from the EPIC-Potsdam Study,” Zeitschrift für Ernährungswissenschaft, Vol. 36, No. 3, 1997, pp. 229-236. doi:10.1007/BF01623369
- D. Bedard, et al., “Underreporting of Energy Intake from a Self-Administered Food-Frequency Questionnaire Completed by Adults in Montreal,” Public Health Nutrition, Vol. 7, No. 5, 2004, pp. 675-681. doi:10.1079/PHN2003578
NOTES
*Corresponding author.