American Journal of Plant Sciences
Vol.4 No.6(2013), Article ID:32905,6 pages DOI:10.4236/ajps.2013.46150
Proteomics Uncovers a Role for Enhanced Ultraviolet-B Radiation on Wheat Leaves
![]()
College of Life Science, Shanxi Normal University, Linfen, China
Email: *jiaxueshi@163.com
Copyright © 2013 Jiangyan Duan et al. This is an open access article distributed under the Creative Commons Attribution License, which permits unrestricted use, distribution, and reproduction in any medium, provided the original work is properly cited.
Received March 23rd, 2013; revised April 26th, 2013; accepted May 15th, 2013
Keywords: Wheat; Ultraviolet-B Radiation; 2-DE
ABSTRACT
Wheat (Triticum aestivum), as a kind of important economic crop cultured in the Northern China, is affected by present-day enhanced ultraviolet-B (UV-B) radiation. To get the information of the impact by UV-B radiation on it, the proteins of wheat (Jin mai NO.8) leaves, which were divided into the normal light group (CK) and UV-B radiation group (B), were extracted and ran at SDS-PAGE at different treatment days (5, 6, 7). The proteins were also analyzed by run two-dimensional gel electrophoresis (2-DE), which allowed the identification of some significantly different gel spots. The proteins spots were further verified by Matrix-Assisted Laser Desorption/lonization-time of Flight Mass Spectrometry. The results showed: 1) the enhanced UV-B affects the growth of the wheat, as the visual changes appear on the sixth day; 2) the proteins expressions between the B group and the CK group were remarkably different on the sixth day; 3) the proteins of wheat leaves of the sixth day were further analyzed by 2-DE revealed that twenty-one protein points were identificated between the B group and the CK group. Among these twenty-one proteins, six proteins of them were up-regulated and twelve proteins of them were down-regulated, three new proteins were expressed only in the B group. Three proteins among six proteins, which were up-regulated, were further verified as RuBisCo large subunit binding protein; SOD; Calmodulin. The result indicates wheat could improve genes encoding proteins in their leaves and protect themselves, when enhanced UV-B affects the growth of the wheat.
1. Introduction
With reduction of stratospheric ozone increases ultraviolet-B (UV-B) radiation at the earth’s surface, UV-B radiation has been shown to be harmful to plants [1]. UV-B can not only reduce plant growth and also has the potential to jeopardize the functionality of cellular components, such as DNA, protein [2]. But most of the studies suggest that a range of characteristics such as gene expression for growth and development, Physiological changes could increase the ability of the plants to cope with UV-B radiation [3,4]. Now, it is imperative to identify genes whose product confers UV-B radiation. Wheat (Triticum aestivum), as a kind of important economic crop cultured in the Northern China, is also sensitive to present-day enhanced UV-B radiation [5]. As the leaves not only could assimilate carbon for plants filling during the ripening phase, but also lead to the identification of candidate regulatory proteins. We focus on proteomics as a tool for the analysis of gene expression of wheat leaves in response to UV-B radiation. How UV-B radiation is transformed into biomass wheat leaves is the most important issue. Therefore, the response of wheat leaves under UV-B exposure has been observed.
2. Materials and Methods
2.1. Plant Materials and Growth Conditions
Wheat (Triticum aestivum, cv JinMai NO.79) seeds were obtained from Shanxi Wheat Research Institute of Agricultural Sciences. Seeds were selected for uniform size and sterilized for 10 min with 0.1% HgCl2 and were washed for 50 min by flowing water. The seeds were grown in Petri plates(diameter 18 cm) on cotton soaked with distilled water under continuous white fluorescent light at a fluence rate of 200 µmol/m2 at 25℃ without any external nutrient. Three replications of 30 pure seeds were used for each of the different treatment. The treatment groups were divided into normal light group (CK) and enhanced UV-B radiation group (B).
2.2. Establishment of Different Treatment Groups
When the seeds of wheat germinated, supplemental UVB radiation was provided by filtered Tai brand (Shanxi, China) 30 W sunlamps. Lamps were suspended in Table 1.
2.3. Preparation of Protein Extract [6]
A portion (200 mg) of leaves was homogenized in 1 mL of lysis buffer containing 8 M urea, 2% NP-40, 0.8% ampholine (pH 3.5 to 10), 5% 2-mercapthoethanol and 5% Polyvinyl pyrrolidne-40, using a glass mortar and pestle on ice. The homogenates were centrifuged in a RA-50JS rotor (Kubota, Tokyo, Japan) for 5 min. The supernatant was centrifuged at 30,000 g for 5 min and subjected to electrophoresis.
2.4. 2-DE [7]
Prepared samples were separated by 2-DE in the first dimension by IEF tube gels (Daiichi pure Chemicals, Tokyo, Japan) and in the second dimension by SDSPAGE. An IEF tube gel of 11 cmlength and 3 mmdiameter was prepared. IEF gel solution consisted of 8 M urea, 3.5% acrylamide, 2% NP-40, 2% Ampholines (pH 3.5 - 10.0 and pH 5.0 - 8.0), ammonium per lysis sulfate and TEMED. Electrophoresis was carried out at 200 V for30 min, followed by 400 V for 16 h and 600 V for 1 h. After IEF, SDS-PAGE in the second dimension was performed using 15% polyacrylamide gels with 5% stacking gels. The gels were stained with CBB, and image analysis was performed. 2-DE images were synthesized and the position of individual proteins on gels was evaluated automatically with Image Master 2D Elite software (Amersham Biosciences, Uppsala, Sweden). The pI and Mr of each protein was determined using 2-DE markers (Bio-Rad, Richmond, CA, USA).
2.5. Data Analysis
Different 2-DE gel spots were further verified by matrixassisted laser Desorption/lonization-time of Flight Mass Spectrometry. The amino acid sequences obtained were compared with those of known proteins in the Swiss-Prot, PIR, GenPept and PDB databases with the Web-accessible search program FastA (http://www.dna.affre.go.jpl).
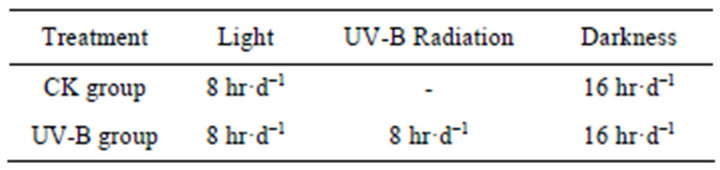
Table 1. The establishment and procedure of different treatment groups.
2.6. Identification the Proteins of Wheat Leaves by MALDI-TOF MS
The digestions were desalted by Poros R2 and eluted with 0.6 mL matrix solution consisted of CHCA (12 mg/mL) in 70% ACN with 0.1% TFA. The eluted solution was applied onto the target well, dried at room temperature and introduced into a Bruker AutoFlex MALDI-TOF MS. The mass spectrometer was operated under 19 kV accelerating voltage in the reflectron mode and a m/z range of 600 - 4000. The monoisotopic peptide masses obtained from MALDI-TOF MS were analyzed by m/z software, and interpreted with MASCOT (Matrix Science) against the NCBInr database and the nonredundant databases of the rice genome generated by the Beijing Genomics Institute. Some digestive products from 2-DE spots were carried out by LC-MS/MS using a LCQ Deca IT mass spectrometer (Thermo Finnigan, Ringoes, NJ, USA) for further confirmation of amino acid sequences. After capillary reverse phase HPLC, the separated peptides were subjected into IT MS with 3.2 kV spray voltage and 150˚C at the heated desolvation capillary. The m/z range from 400 - 2000 was scanned in 1.2 s, and the ions were detected with a high energy Conversion Dynode detector. The LC-MS/MS data were converted into DTA-format files which were further searched for proteins with MASCOT.
3. Results
3.1. Effects on Wheat Growth under Enhanced UV-B
The number of 1 and 2 represent the wheat in the CK group and 3, 4, 5 represent the wheat in the B group on the sixth day (Figure 1). In the B group, the enhanced ultraviolet-B led to dwarfism and “Root-bending” of wheat. The leaf area and number of stomata of wheat were both decreased.
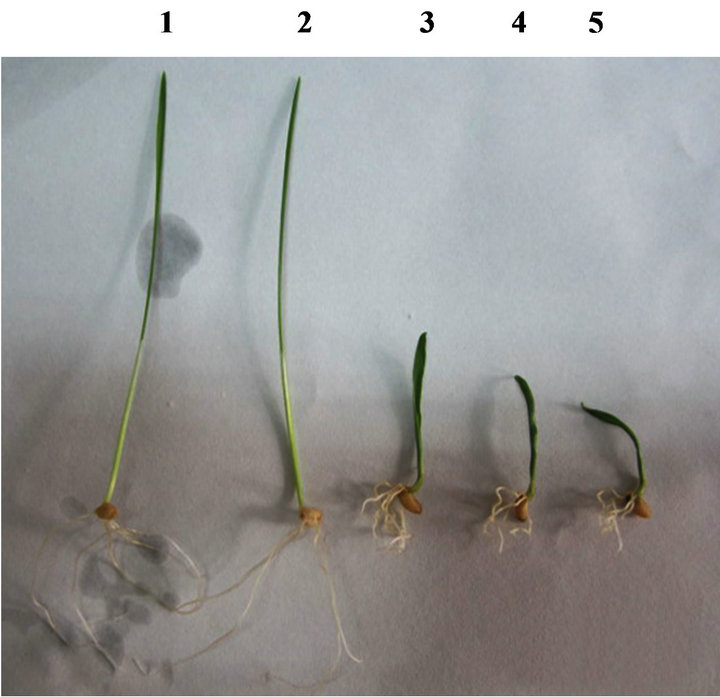
Figure 1. The wheat of the CK group and the B group on the sixth day.
3.2. Content of Proteins Extracted on Different Treatment Days
Figure 2 shows levels of proteins with molecular weight of 100, 60, 40, 25 and 20 KDa polypeptides of wheat leaves after the ultraviolet-B radiation on different treatment days. These alterations ranged in molecular weight from as low as 20 KDa to as high as 100 KDa. From the general picture of leaves proteins emerging from this work, more protein alterations were scored in 66 KDa after enhanced UV-B radiation. The synthesis of 66 KDa polypeptides was decreased on the 6 and 7 treatment days. The synthesis of 21 - 31 KDa polypeptides was increased on the 6 and 7 treatment days.
The total content of proteins extracted from control group(CK) were significantly higher than those extracted from UV-B radiation group (B) on sixth day. On fifth and seventh day, the total content of proteins extracted from control group (CK) were higher than those extracted from UV-B radiation group (B), but they were not significant (Figure 3).
3.3. 2-DE Gels of Wheat Leaves Proteins
On the basis of these images, we had an outline of the expression profile for the relatively abundant and soluble proteins in wheat leaves. The distribution patterns of most gel spots were similar on all groups. The 2-DE images indicated that the protein components in the wheat leaves were similar from the CK group and the B group through, at least for proteins with middle and high abundance.
Figure 4 showed representative image of 2-DE gels of wheat leaves proteins on the six day. Spots with differential expression among two groups were listed in the Figures 5-7. There were twenty-one different protein spots between CK group and B group. Six of twenty-one protein spots showed protein expression increased after UV-B radiation. Such as 1301, 3505, 3602 5201, 7305, 7504. Twelve of twenty-one spots showed protein expression decreased after UV-B radiation, such as1603, 2505, 2603, 3202, 3404, 4203, 4401, 5606, 5803, 6307, 6402, 8603. There were three new proteins which were expressed after UV-B radiation. Such as 2502, 4802, 5503.
3.4. Analysis of Differential Individual Protein Spots
A total of five dependent spots including 3205, 3502, 3503, 3506, 3507 were picked from differential individual protein spots. Three protein spots matched the correct protein. The results from MALDI-TOF MS were summarized in Table 2.
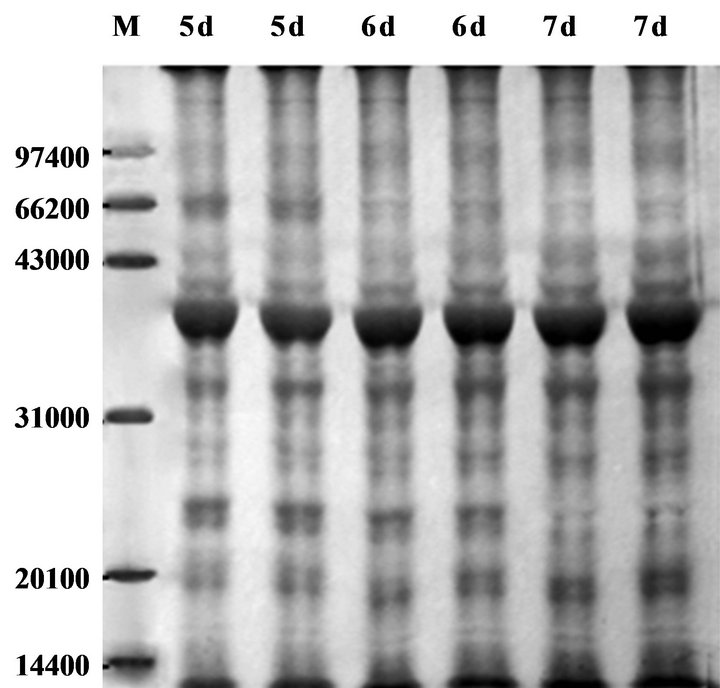
Figure 2. SDS-PAGE of protein in wheat leaves after UV-B radiation. M: Marker; 5d, 6d, 7d refer to 5d, 6d and 7d after radiation, respectively.
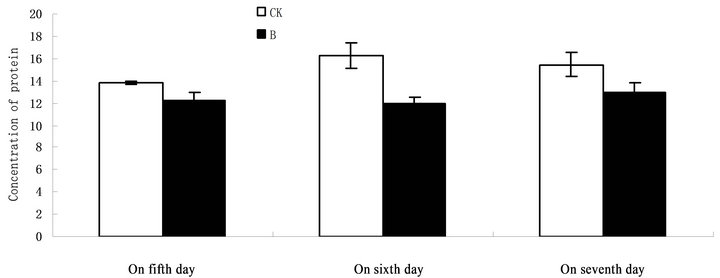
Figure 3. Changes in content of protein exposed to different treatment days.
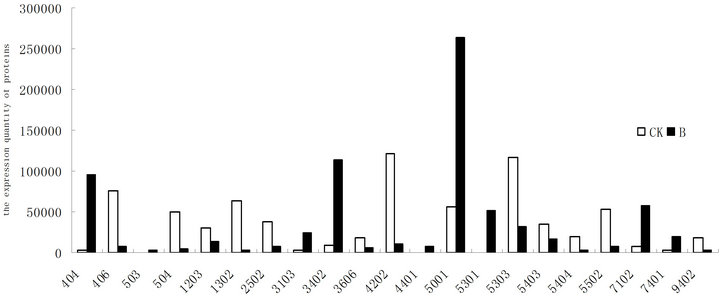
Figure 4. Changes of the differential displayed proteins in wheat leaves between UV-B radiation and CK.
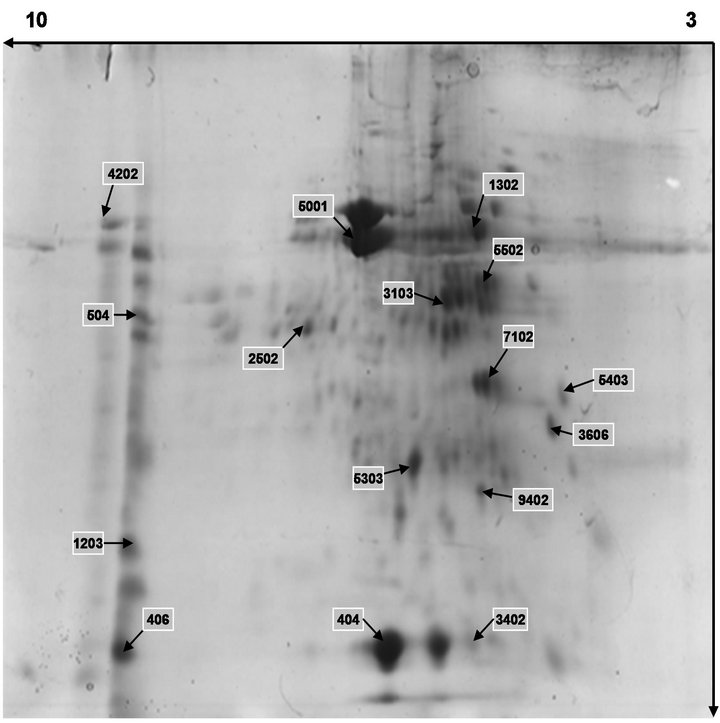
Figure 5. Separation of wheat leaves proteins by 2-DE under normal light.
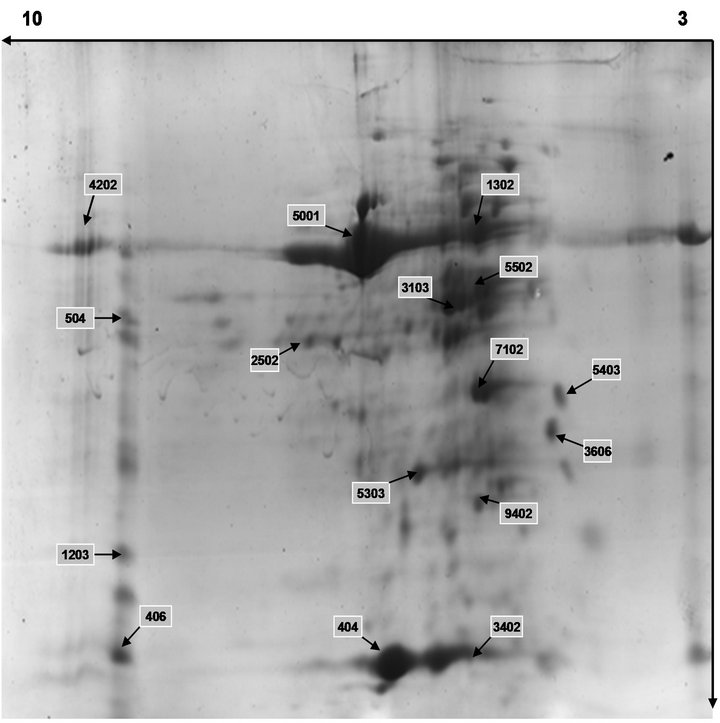
Figure 6. Separation of wheat leaves proteins by 2-DE under UV-B radiation.
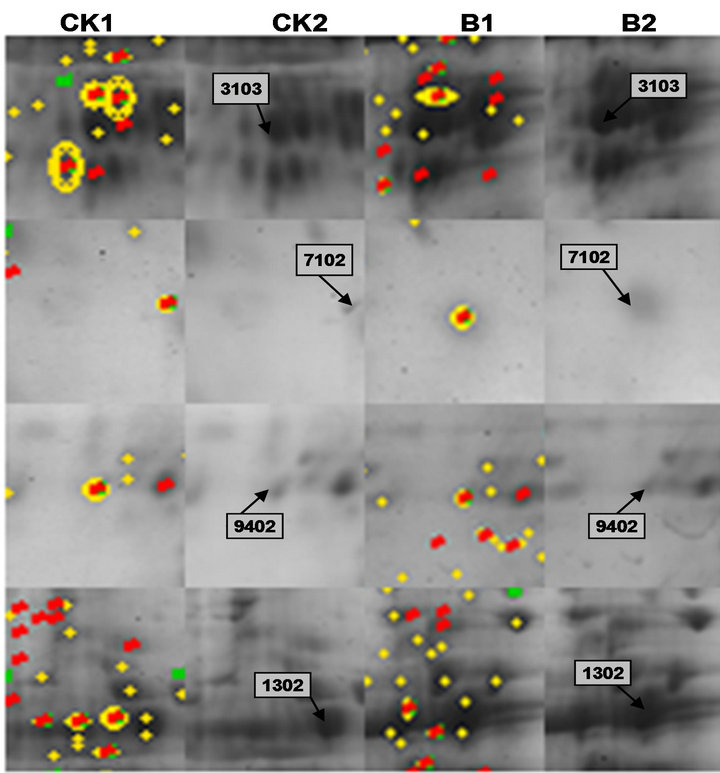
Figure 7. Enlarged portion of the representative protein points in the 2-DE gel. CK1, B1 represent the different proteins by software analysis between normal group and treatment group; CK2, B2 represent the differences of corresponding original protein points on the map of protein points.
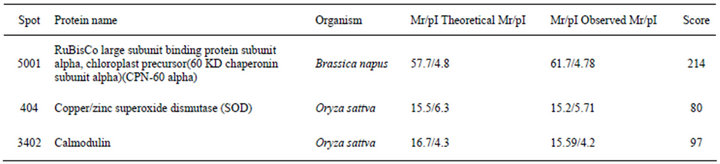
Table 2. Identification of differential protein spots by ESI-Q MS/MS and database searching.
4. Discussion
4.1. 2-DE Images
Since the process of UV-B radiation takes place in the leaf, it is natural to surmise that the response of protein of green leaves could be different [8]. The advent of proteomics has made it possible to identify a broad spectrum of proteins in living systems. To monitor the proteomic changes of wheat leaves under ultraviolet-B radiation, a fundamental consideration is reliable quantitative measurements for their proteomes. In this study, to achieve reliable quantification of 2-DE gels, we have adopted average values of spot density for quantitative comparisons. All of the samples were paralleled quadruply and the average of the spot density was estimated at least in triplicate. For image analysis: although software analysis for 2-DE imaging is not labor intensive, the results are often not dependable. As described in Section 3.2, we analyzed 2-DE images using Image Master Elite and then by manual confirmation. Through these efforts, we achieved a reliable quantification analysis for the 2-DE images.
4.2. Growth of the Wheat under the Enhanced Ultraviolet-B
UV-B that penetrates into wheat leaves tissues may affect important cellular macromolecules [9]. Some studies have been conducted the UV-B radiation could reduce the content of Rubisco in green leaves and damages the D1/D2 reaction centre proteins of photosystem II (PS II) [10,11]. As the Rubisco was the important enzyme in the photosynthesis, the enhanced content of subunit of Rubisco existed in wheat leaves after UV-B radiation. This means the UV-B radiation could damage the photosynthesis of wheat leaves. Our results also show that the enhanced ultraviolet-B leads to dwarfism and “Rootbending” of wheat. So, enhanced UV-B affected the growth of the wheat.
4.3. Responsive Proteins of Wheat Leaves
Some scholars suggest when plants are subjected to dehydration and cold and salt stress, the amount of proteins is endogenously increased [12]. Responses of plants to stress, could be regulated by growth regulators, like Calmodulin [13]. As is well known, SOD, POD and CAT could eliminate accumulation of poisonous free radicals and prevent lipid peroxidation [14]. The identification of protein spots by MS have revealed that enhanced expression of Calmodulin and SOD exist in wheat leaves after UV-B radiation. Our results suggest that enhanced expression of SOD and Calmodulin evolving complex protein is some of the protective responses of wheat to UV-B radiation. Our results also show some responsive proteins accumulated when plants are subjected to UV-B radiation. After UV-B radiation exerts an adverse influence on wheat 6 days, it leads to up-regulation of the some responsive proteins. These results show wheat has the ability to withstand UV-B radiation condition.
5. Conclusion
In this work we suggest that wheat could improve genes encoding proteins in their leaves and protect themselves, when enhanced UV-B affects the growth of the wheat.
6. Acknowledgements
The study was supported by the Natural Science Foundation of Shanxi Province (2009011044-2).
REFERENCES
- M. K. Pradhan, P. N. Joshi, J. S. Nair, N. K. Ramaswamy, R. K. Iyer, B. Biswal and U. C. Biswal, “UV-B Exposure Enhances Senescence of Wheat Leaves: Modulation by Photosynthetically Active Radiation,” Radiation and Environmental Biophysics, Vol. 45, No. 3, 2006, pp. 221- 229. doi:10.1007/s00411-006-0055-2
- Y. Zu, Y. Li, J. Chen and H. Chen, “Intraspecific Responses in Grain Quality of 10 Wheat Cultivars to Enhanced UV-B Radiation under Field Conditions,” Journal of Photochemistry and Photobiology B, Vol. 74, No. 2-3, 2004, pp. 95-100. doi:10.1016/j.jphotobiol.2004.01.006
- C. Zinser, H. K. Seidlitz, G. Welzl, H. Sandermann, W. Heller, D. Ernst and W. Rau, “Transcriptional Profiling of Summer Wheat, Grown under Different Realistic UV-B Irradiation Regimes,” Journal of Plant Physiology, Vol. 164, No. 7, 2007, pp. 913-922. doi:10.1016/j.jplph.2006.06.006
- M. A. Jansen, B. L. Martret and M. Koornneef, “Variations in Constitutive and Inducible UV-B Tolerance; Dissecting Photosystem II Protection in Arabidopsis thaliana Accessions,” Physiologia Plantarum, Vol. 138, No. 1, 2009, pp. 22-34. doi:10.1111/j.1399-3054.2009.01293.x
- R. Han, X. L. Wang, M. Yue and Z. Qi, “Effects of the Enhanced UV-B Radiation on the Body Cell Mitosis of the Wheat,” Yi Chuan Xue Bao, Vol. 29, No. 6, 2002, pp. 537-541.
- G. K. Agrawal and J. J. Thelen, “Development of a Simplified, Economical Polyacrylamide Gel Staining Protocol for Phosphoproteins,” Proteomics, Vol. 5, No. 18, 2005, pp. 4684-4688. doi:10.1002/pmic.200500021
- F. M. Abbasi and S. Komatsu, “A Proteomic Approach to Analyze Salt-Responsive Proteins in Rice Leaf Sheath,” Proteomics, Vol. 4, No. 7, 2004, pp. 2072-2081. doi:10.1002/pmic.200300741
- V. D. Kreslavskii, A. A. Ivanov and A. A. Kosobriukhov, “Low Radiance in the Region of Wavelengths 620 - 660 nm Reduces the UV-B-Induced Damage to Photosystem II in Spinach Leaves,” Biofizika, Vol. 49, No. 5, 2004, pp. 840-844.
- L. He, Y. Zu, Y. Li and Y. Wu, “Intraspecific Differences in Physiological Responses of Different Wheat Cultivars to Enhanced UV-B Radiation,” Ying Yong Sheng Tai Xue Bao, Vol. 17, No. 1, 2006, pp. 163-165.
- J. N. Henderson, S. Hazra, A. M. Dunkle, M. E. Salvucci and R. M. Wachter, “Biophysical Characterization of Higher Plant Rubisco activase,” Biochimica et Biophysica Acta, Vol. 1834, No. 1, 2012, pp. 87-97.
- P. Joshi, S. Gartia, M. K. Pradhan and B. Biswal, “Photosynthetic Response of Clusterbean Chloroplasts to UV-B Radiation: Energy Imbalance and Loss in Redox Homeostasis between Q(A) and Q(B) of Photosystem II,” Plant Science, Vol. 181, No. 2, 2011, pp. 90-95. doi:10.1016/j.plantsci.2011.04.001
- A. Perochon, D. Aldon, J. P. Galaud and B. Ranty, “Calmodulin and Calmodulin-Like Proteins in Plant Calcium Signaling,” Biochimie, Vol. 93, No. 12, 2011, pp. 2048- 2053. doi:10.1016/j.biochi.2011.07.012
- L. Du, G. S. Ali, K. A. Simons, J. Hou, T. Yang, A. S. Reddy and B. W. Poovaiah, “Ca(2+)/Calmodulin Regulates Salicylic-Acid-Mediated Plant Immunity,” Nature, Vol. 457, No. 7233, 2009, pp. 1154-1158. doi:10.1038/nature07612
- S. Dudonne, X. Vitrac, P. Coutiere, M. Woillez and J. M. Merillon, “Comparative Study of Antioxidant Properties and Total Phenolic Content of 30 Plant Extracts of Industrial Interest Using DPPH, ABTS, FRAP, SOD, and ORAC Assays,” Journal of Agricultural and Food Chemistry, Vol. 57, No. 5, 2009, pp. 1768-1774. doi:10.1021/jf803011r
NOTES
*Corresponding author.