American Journal of Plant Sciences
Vol. 3 No. 12 (2012) , Article ID: 25789 , 8 pages DOI:10.4236/ajps.2012.312210
Genetic Diversity in a Collection of Chinese Sorghum Landraces Assessed by Microsatellites
![]()
1Plant Stress and Germplasm Development Unit, Cropping Systems Research Laboratory, USDA-ARS, Lubbock, USA; 2Dupont Pioneer 2260 CR60, Plainview, USA.
Email: gloria.burow@ars.usda.gov
Received September 10th, 2012; revised October 24th, 2012; accepted November 25th, 2012
Keywords: Sorghum; Germplasm; Landraces; Kaoliangs; Simple Sequence Repeats; Diversity
ABSTRACT
Genetic diversity was characterized in a collection of 159 sorghum (Sorghum bicolor L. Moench) landraces gathered from the colder region (primarily the northeastern region) of China. A set of 41 microsatellites or simple sequence repeat (SSR) markers distributed throughout the 10 chromosomes of sorghum was utilized in the analysis. Majority (40 out of 41 SSRs, 98%) of the SSR markers were polymorphic and highly informative with polymorphism information content (PIC) value ranging from 0.05 to 0.92. An estimation of genetic similarity coefficients (GSC, with values ranging from 0.42 to 0.96) revealed a range of variability in this collection of sorghum landraces. Eight clusters of accessions were identified at a cut off at 0.50 GSC and these groupings were supported by the analysis of subpopulations using Structure. This study provides evidence that Chinese landraces of sorghum exhibit moderate genetic diversity and results from cluster analysis may well aid in identification of diverse accessions that can serve as parental lines for efficient utilization and application of these germplasm into sorghum breeding programs.
1. Introduction
Genetic diversity is one of the important cornerstones of crop improvement. Diversity provides the raw materials from which desirable or favorable alleles for improved agronomic traits of interest can be selected. Subsequently, breeding for improved varieties are facilitated through the incorporation of new alleles into well adapted or elite lines. The assembly through collections, preservation and distribution of germplasm representing large diversity for each crop species then, is of utmost significance for plant breeding.
A critical and challenging step towards utilization of conserved germplasm is the characterization of existing genetic diversity within the collection (Casa et al., 2008 [1] and Uphadyaya et al., 2009 [2]). For sorghum (Sorghum bicolor L. Moench) as an example, the US Dept. of Agriculture, Genetic Resources Information Network contains 45,609 accessions from various parts of the world (www.ars-grin.gov, accessed Sept. 30, 2012). Thus, it is challenging to screen for specific traits of interest. An approach that have been applied to meet the challenges of screening vast collection of germplasm materials is to assemble subset of germplasm based on geographical area, which could have significant correlation with adaptation to the trait of interest. As an example, to identify sources of early season cold tolerance in sorghum, accessions from the colder regions of China had been of interest and actually used for analysis (Lu and Dahlberg, 2001 [3] and Franks et al., 2006 [4]). In this case, Northeast Chinese provinces provide significantly cooler sowing temperatures for sorghum cultivation, it has been hypothesized that landraces or traditional varieties used by farmers harbor adaptation to cold tolerance (Lu and Dahlberg, 2001) [3]. In a related study, Chinese sorghums significantly outperformed US adapted lines and hybrids under cold conditions at germination stage and at early season sowing (Franks et al., 2006) [4].
Traditionally, evaluation of diversity were performed thru phenotypic assessment of various traits of interest in multiple years and locations. However, with the availability of molecular resources such as restriction fragment length polymorphic (RFLP), amplified fragment length polymorphism (AFLP), randomly amplified polymorphic DNA (RAPD), inter simple sequence repeats (ISSR) and simple sequence repeats (SSRs) or microsatellites, DNA markers have been widely applied towards an evaluation of genetic diversity.
Among the marker platforms, SSRs are widely used and are advantageous as markers for diversity studies due to their high level of polymorphism, wide availability and ease of detection (Schloss et al., 2002) [5]. Dje et al.
(2000) [6] had demonstrated the utility of SSRs in their study of diversity in 25 accessions of sorghum using five SSR markers, where 100% polymorphism of markers was observed. Ghebru et al. (2002) [7] applied SSR makers to determine genetic variation among Eritrean sorghums. A diversity study of cultivated sorghum in Japan was conducted using nine SSR markers (Anas and Yoshida, 2004) [8], whereby 31 sorghum cultivars from Japan were explicitly grouped into 7 clusters. An analysis of pattern of genetic diversity in the Guinea race of sorghum accessions from ICRISAT was reported by Folkertsma and co-workers (2005) [9] by employing SSRs. This latter study showed that significant genetic variation exist in the land races originating from semiarid Sahelian Africa as compared to germplasm from South Asia. Further, a collection of sorghum landraces from Burkina Faso was analyzed using 29 microsatellites which confirmed the moderate diversity found among accessions from the Sahelian region (Barro-Kondombo et al., 2010) [10]. SSRs were also used to analyze the trend of variation among widely used US hybrids (Smith et al., 2010 ) [11]. Casa et al. (2005) [12] employed SSR markers to study diversity and pattern of selection in sorghum and showed that SSRs are highly polymorphic among the lines. In subsequent study, Casa et al. (2008) [1] also evaluated the US panel consisting of 377 accessions of sorghum included in the proposed US panel for association mapping, using 47 SSR markers, and showed that an analysis of genotype data that takes into account population structure and kinship were useful in linkage disequilibrium analysis for sorghum.
Furthermore, the use of a combination of SSR and other markers such as AFLP were also shown to be useful in determining genetic diversity in public inbreds of sorghum. In an earlier study, Yang et al. (1996) [13] studied a group of 34 sorghum lines from all over China and utilized different markers including RFLP, RAPD and ISSR. Menz et al. (2004) [14] showed that publicly available elite inbreds developed in the US breeding programs are highly diverse and that working group classifications have significant contribution to the diversity observed based on AFLP and SSR genotype data. In a subsequent work, Perumal et al. (2007) [15] analyzed 46 exotic sorghum lines from various countries, and reported that phylogenetic grouping based on AFLP markers correspond to races of sorghum. A moderate amount of variation was found in a collection of sorghum materials varying in resistance to green bug using AFLP markers (Wu et al., 2008) [16].
The objective of this study is to assess genetic diversity in collection of landraces of sorghum from cold, northeastern region of China using SSR markers. These land races exhibit some degree of similarity based on their race, working group and provinces of origin, and through this study we documented significant genetic diversity in this collection by resolving genetic affinities or grouping among accessions based on SSR markers.
2. Materials and Methods
2.1. Germplasm Materials
A total of 192 accessions, majority of which have passport origin from the Northeastern provinces of China were initially assembled from GRIN. The collection was planted in 2007 at the USDA-ARS farm at Lubbock, TX for seed increase. During genotyping eleven accessions were excluded because of inconsistent DNA amplification. Furthermore, entries with 20% or more missing genotype were excluded from the data set, resulting in a total of 159 accessions (Table 1).
2.2. Genomic DNA Extraction and SSR Genotyping
Leaf samples from bulked plant samples (3 plants) of each accession were harvested and used for genomic DNA extraction. DNA was extracted using a medium throughput extraction method previously described for sorghum (Burow et al., 2009) [17]. Briefly, lyophilized leaf samples were ground using Retsch Mixer Mill MM 400 (Retsch, USA), and 100 mg of ground leaf was used for extraction with modified cetyltrimethyl ammonium bromide (CTAB) solution, followed by phenol chloroform clean up. Total genomic DNA recovered per genotype were analyzed in gel and quantified with Nanodrop(Thermo Scientific,Wilmington, DE, USA). A total of 41 SSR markers (Xtxp’s) were utilized for this study. The information about the markers including sequence of forward and reverse primers were previously described by Menz et al., 2002 [18].
A modified M13 tagged forward and normal reverse primer was used for each marker as reported (Burow et al., 2009) [17]. Briefly, a 20mer M13 oligo (GAC GTT GTA AAA CGA CGG CC) was concatenated at the 5’ end of each forward primer, generating an M13-tagged primer. To facilitate detection, a 20 mer M13 oligo labeled with one of three fluorescent dyes, 6-HEX, FAM or NED, was added to the PCR mix to label SSR products of each marker. PCR was performed in a volume of 10 µl, containing 1× PCR buffer (10 mM Tris-HCl pH 8.3, 50 mM KCl, 1.5 mM MgCl2), 0.2 mM of each dNTP, 0.05 units Hotstart Taq DNA polymerase (Qiagen Inc., Valencia CA), 2 pmol of each M13 tagged forward and normal reverse primer, 0.02 pmol of fluorescent labeled 20 mer M13 primer (labeled with either HEX, NED or FAM) and 20 ng of template genomic DNA. Amplifications were performed using a PTC-225 (MJ Research, Waltham, MA, USA) Peltier thermal cycler with the following conditions for the PG series of primers: 95C initial activation for 15 m (1 cycle) 35 cycles of 94C for 45 s, 55C for 60 s, 72C for 30 s; and a final extension at 72C for 10 m. All the primers detected amplified PCR products.
Markers were amplified separately in each of the 159 accessions and were size separated by capillary electrophoresis using an ABI Prism 3100 DNA Analyzer (Applied Biosystems, Foster City, CA). Multiplexing of three differentially-labeled PCR products per well was carried out to increase efficiency. Electrophoretic data were imported to Genescan 3.1.2 software (Applied Biosystems, Foster City, CA) for allele characterization based on molecular weight of SSR products obtained.
2.3. Statistical Analysis
Bands from polymorphic SSR markers were scored as present (1) or absent (0) for each accession by manual inspection. Missing data were represented as −9. Data were tabulated in a matrix using Excel v2003 (Microsoft Corp., Redmond, WA, USA). Data analysis was performed using NTSYSpc version 2.2 software (Rohlf, 1998 [19]; Exeter Software, Setauket, NY). Briefly, genetic similarity coefficients of pair-wise comparisons among the accessions analyzed were calculated based on Dice coefficient (Dice, 1945) [20] within the Similarity for Qualitative Data (SIMQUAL) module of NTSYS 2.2. Cluster analysis was performed using generated coefficients according to the unweighted pair group mean algorithm (UPGMA) within the Sequential Agglomerative Hierarchical Nested (SAHN) analysis module of NTSYS. Dendrogram was drawn in tree format using the tree plot module of NTSYS. Additionally, cophenetic correlation was estimated to measure goodness of fit among matrices generated using the Matrix Comparison (MXCOMP) module.
Determination of total number of alleles and polymorphism information was estimated from the genotyping data, considering that each SSR primer pair represents a unique locus. Polymorphism information content (PIC) values was calculated based on the formula, PIC = , where pi is the frequency of the ith allele of an SSR locus.
To further examine genetic diversity, genotype data was analyzed using Structure 2.2 (Pritchard et al., 2000) [21], available from http://pritch.bsd.uchicago.edu/structure.html, verified Sept. 30, 2012) to determine structured groups or subpopulations (K clusters) in the collection. Analysis was performed using settings for admixture ancestry and correlated marker frequency models of the program. The K values were set at 1 to 10, with a burn in value of 10,000 followed by 30,000 iterations. Optimal K clusters were identified based on the improvements in the estimated natural log of likelihood [Ln P(D)] of the data and on its consistency in the three independent runs in accord with statistics applied by Casa et al. (2008) [1] and Murray et al. (2009) [22].
3. Results and Discussion
A summary of the accessions used in the study, and province of origin are presented in Table 1. These accessions were reported as landraces or local cultivars collected from farmers primarily in the sorghum growing province of Shanxi, where 62% of accessions have this province as the origin of collection, while 28% of the accessions came from the other 4 cold northeast provinces of China including Jilin, Liaoning, Heilongjiang, and Nei Mongol (Table 1). Eight percent of accessions used did not have specific province of origin in their passport data but only have China as country of origin (Table 1).
A total of 41 SSRs distributed throughout the 10 chromosomes were used to evaluate genetic diversity. The list of the markers, their chromosome location, total number of alleles resolved for each SSR and corresponding PIC value of each marker are shown in Table 2. Variations in the number of alleles for each marker ranged from 2 to 23 (Table 2). Xtxp 136, 266 and Xgap 256 had only 2 alleles, while the highest number of alleles (23) was observed from Xtxp 265 (Table 2). Polymorphism information content of each marker was variable and showed a significant correlation with total number of alleles (r = 0.78) (Table 3). The higher the number of alleles per marker, the greater is PIC value.
Genetic similarities coefficient (GSC) defined as the proportion of matched markers between a given pair of entries among the 159 accessions was estimated and applied as basis for cluster analysis. Result indicated moderate genetic variation in this collection of Chinese sorghums as GSC values ranged from 0.42 to 0.96 (Figure 1). The lowest GSC of 0.42 was found between PI 563550 and Liang Tang Ai. The highest GSC (0.94)

Table 1. Summary of information on Chinese landraces of sorghum analyzed in the study based on province of origin and their cluster group based on UPGMA analysis.


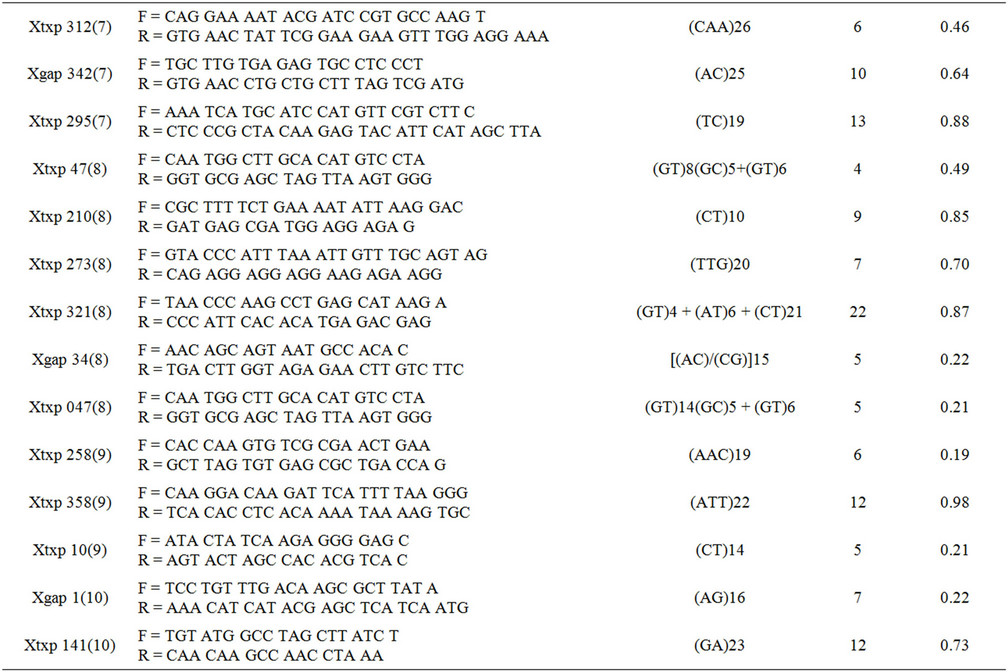
Table 2. List of SSR markers with their chromosome location, primer sequences (forward and reverse), repeat motif type, the number of alleles resolved and the polymorphism information content (PIC) value for each marker.
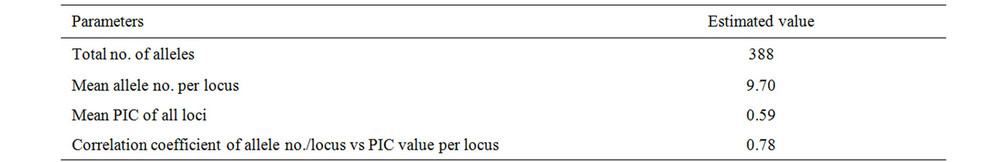
Table 3. Summary of SSR marker data estimated using the current Chinese sorghum landraces.
or most similar pair in the collection was between PI76401 and Grif 7266 (Figure 1).
Cluster analysis based on genetic similarity coefficient matrix was carried out using the UPGMA method in NTSYS. Eight clusters were resolved at a cut off of 0.50 GSC (Figure 1). A number of the branches observed in each cluster are supported by bootstrap values of 70 and higher (data not shown). While clusters were not as distinct, estimation of goodness of fit of matrices derived from clustering analysis through cophenetic correlation was 0.72. Sixteen accessions were not clustered significantly to the rest of the groups resolved. The possible association of population cluster to that of province of origin showed weak correlation. Most of the entries collected from the Northeast provinces clustered with the group from Shanxi (Figure 1 and Table 1). Only the group of accessions from the province of Heilongjiang showed distinct clustering with each other in cluster G (Figure 1).
The natural log probability of data Ln P(D) obtained from Bayesian clustering analysis showed marginal improvement and began to plateau at K = 8 (Figure 2). This suggests that using a model approach, this collection could have 8 subpopulations with some of the entries exhibiting admixtures as also observed from the. The subpopulation resolved in Structure correlated well with the groups established through UPGMA.
However, admixtures in entries were still prevalent as many accessions displayed mixed inferred.
Majority of the sorghums analyzed in this research are classified primarily as Kafir race, under the kaoliangnervosum working group (Harlan and de Wet, 1972) [23]. However, with the use of molecular markers, genetic variation and diversity were resolved among the acce-
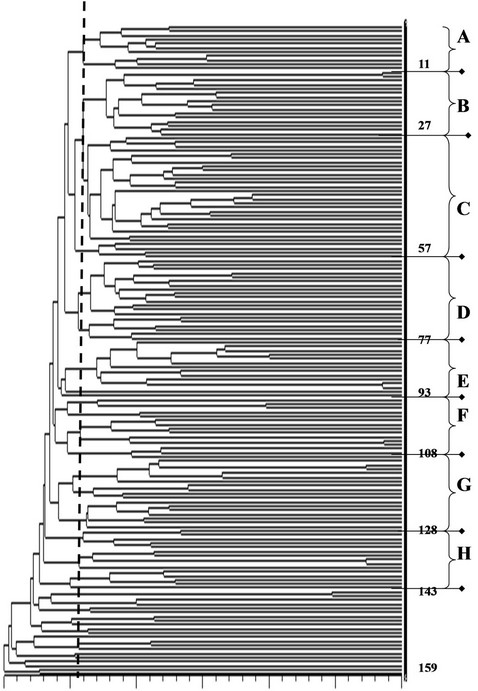
Figure 1. Dendrogram of 159 Chinese landraces based on UPGMA analysis and Dice’s genetic similarity coefficient calculated from genotypes for 49 SSR markers analyzed in the study. Legends: *Numbers of the right (1 to 159) refers to line ID; **Letters A through H refers to cluster groups resolved through UPGMA analysis.
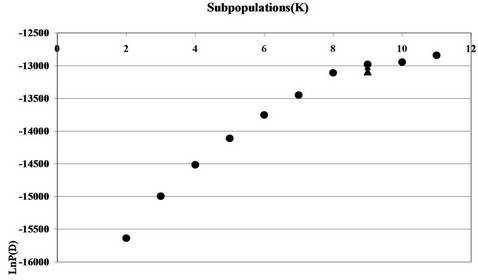
Figure 2. Analysis of subgroups in 159 Chinese landraces based on structure. The y axis refers to LnP(D) values. Arrow indicates predicted number of subgroups.
ssions studied. These results validate the need for detailed analysis of genetic variation beyond phenotypic measurements particularly using molecular markers.
A clear and better picture of diversity can be obtained from molecular markers but it is also warranted that integration of genetic and phenotypic analysis could be a more powerful tool in elucidating genetic diversity and relationships among sorghum landraces. Previous studies have documented the existence of large genetic variation in land race collection of sorghum. Folkertsma et al. (2005) [9] reported that the guinea race of sorghum from various parts of the world were highly diverged from each other and that there is a predominance of rare alleles. Additional studies on sorghum land races from Burkina Faso (Barro-Kondombo et al., 2010) [10] and Cameroon (Barnaud et al., 2007) [24] corroborated the occurrence of extensive genetic diversity even in relatively small region of sorghum cultivation and in germplasm involving landraces. These studies involved germplasm within the center of diversity for the sorghum in the regions of central to east Africa and reflects the inherent diversity of the species. However, the occurrence of moderate diversity in a different geographical area where sorghum has been cultivated as an introduction such as China is of great interest. In an earlier analysis of 34 sorghum accessions collected from China, moderate variability was observed contrary to the hypothesis that Chinese sorghums could be genetically homogeneous due to prolonged isolation (Yang et al., 1996) [13]. The results from the current study support the findings reported by Yang et al. (1996) [13], and clearly showed that the Chinese landraces are genetically diverse. Moderate diversity was also found by Menz et al. (2004) [14] among the sorghum inbreds developed in the US with genetic similarity coefficients values ranging from 0.20 to 0.80. Clustering or genetic relationships was found to be associated mainly with working group classification in the US inbred lines.
Clustering and grouping based on subpopulations in the collection were distinct and significant. The clusters established based on dendrogram was supported by subpopulation structure obtained from STRUCTURE. This indicates that identification of new materials from the population as candidate parents for development of mapping populations could be an important application from this study. However, it is also recognized that greater resolution of genetic groupings in this collection could be achieved by augmenting the number of markers used in the study. In addition, an evaluation of phenotypic characteristics of entries and their combined analysis with genotyping or molecular data could also provide greater resolution of groupings and genetic affinities. Overall, this study provides evidence that Chinese landraces of sorghum contains a wealth of genetic diversity and results from cluster analysis are expected to aid in identification of diverse accessions that can serve as parental lines for efficient utilization in breeding programs and which could result in better genetic gain for important agronomic traits.
4. Acknowledgements
The authors would like to thank Ms. Halee Hughes, and Mr. Charlie Woodfin for technical support. The authors acknowledges support from the United Sorghum Checkoff Program through Grant # R0018-09.
5. Disclaimer
Mention of trade names or commercial products in this publication is solely for the purpose of providing specific information and does not imply endorsement by the US Department of Agriculture.
REFERENCES
- A. M. Casa, G. Pressoir, P. J. Brown, S. E. Mitchell, W. L. Rooney, M. R. Tuinstra, C. D. Franks and S. Kresovich, “Community Resources and Strategies for Association Mapping in Sorghum,” Crop Science, Vol. 48, No. 1, 2008, pp. 30-40. doi:10.2135/cropsci2007.02.0080
- H. D. Uphadyaya, R. P. S. Pundir, S. L. Dwivedi, C. L. L. Gowda, V. G. Reddy and S. Singh, “Developing a Minicore Collection of Sorghum for Diversified Utilization of Germplasm,” Crop Science, Vol. 49, No. 5, 2009, pp. 1769-1780. doi:10.2135/cropsci2009.01.0014
- Q. Lu and J. Dahlberg, “Chinese Sorghum Genetic Resources,” Economic Botany, Vol. 55, No. 4, 2001, pp. 401- 425.
- C. D. Franks, G. Burow and J. Burke, “A Comparison of US and Chinese Sorghum Germplasm for Early Season Cold Tolerance,” Crop Science, Vol. 46, No. 3, 2006, pp. 1371-1376. doi:10.2135/cropsci2005.08-0279
- S. J. Schloss, S. E. Mitchell, G. M. White, R. Kukatla, J. E. Bowers, A. H. Paterson and S. Kresovich, “Characterization of RFLP Probe Sequences for Gene Discovery and SSR Ddevelopment in Sorghum bicolor (L.) Moench,” Theoretical and Applied Genetics, Vol. 105, No. 7, 2002, pp. 912-920. doi:10.1007/s00122-002-0991-4
- Y. Dje, M. Heuertz, C. Lefebvre and X. Vekemans, “Assessment of Genetic Diversity within and among Germplasm Accessions in Cultivated Sorghum Using Microsatellites Markers,” Theoretical and Applied Genetics, Vol. 100, No. 6, 2000, pp. 918-925. doi:10.1007/s001220051371
- B. Ghebru, R. J. Schmidt and J. Bennetzen, “Genetic Diversity of Eritrean Sorghum Landraces Assessed with Simple Sequence Repeat (SSR) Markers,” Theoretical and Applied Genetics, Vol. 105, No. 2, 2002, pp. 229- 236. doi:10.1007/s00122-002-0929-x
- Anas and T. Yoshida, “Genetic Diversity among Japanese Cultivated Sorghum Assessed with Simple Sequence Repeat Markers,” Plant Production Science, Vol. 7, No. 2, 2004, pp. 217-223. doi:10.1626/pps.7.217
- R. T. Folkertsma, H. F. Rattunde, S. Chandra, G. S. Raju and C. T. Hash, “The Pattern of Genetic Diversity of Guinea-Race Sorghum bicolor (L.) Moench Landraces as Revealed with SSR Markers,” Theoretical and Applied Genetics, Vol. 111, No. 3, 2005, pp. 399-409. doi:10.1007/s00122-005-1949-0
- C. Barro-Kondombo, F. Sagnard, J. Chantereau, M. Deu, K. von Brocke, P. Durand, E. Goze and J. D. Zongo, “Genetic Structure among Sorghum Landraces as Revealed by Morphological Variation and Microsatellite Markers in Three Agroclimatic Regions of Burkina Faso,” Theoretical and Applied Genetics, Vol. 120, No. 8, 2010, pp. 1511-1523. doi:10.1007/s00122-010-1272-2
- S. Smith, V. Primomo, R. Monk, B. Nelson, E. Jones and K. Porter, “Genetic Diversity of Widely Used US Sorghum Hybrids, 1980-2008,” Crop Science, Vol. 50, No. 5, 2010, pp. 1664-1673. doi:10.2135/cropsci2009.10.0619
- A. M. Casa, S. E. Mitchell, M. T. Hamblin, H. Sun, J. E. Bowers, A. H. Paterson, C. F. Aquadro and S. Kresovich, “Diversity and Selection in Sorghum: Simultaneous Analyses Using Simple Sequence Repeats,” Theoretical and Applied Genetics, Vol. 111, No. 1, 2005, pp. 23-30. doi:10.1007/s00122-005-1952-5
- W. Yang, A. C. de Oliveira, I. Godwin, K. Schertz and J. Bennetzen, “Comaprison of DNA Marker Technologies in Characterizing Plant Genome Diversity: Variability in Chinese Sorghums,” Crop Science, Vol. 36, No. 6, 1996, pp. 1669-1676. doi:10.2135/cropsci1996.0011183X003600060042x
- M. A. Menz, R. R. Klein, N.C. Unruh, W. L. Rooney, P. E. Klein and J. E. Mullet, “Genetic Diversity of Public Inbreds of Sorghum Determined by Mapped AFLP and SSR Markers,” Crop Science, Vol. 44, No. 4, 2004, pp. 1236-1244. doi:10.2135/cropsci2004.1236
- R. Perumal, R. Krishnaramanujam, M. A. Menz, S. Katile, J. Dahlberg, C. W. Magill and W. L. Rooney, “Genetic Diversity among Sorghum Races and Working Groups Based on AFLPs and SSRs,” Crop Science, Vol. 47, No. 4, 2007, pp. 1375-1383. doi:10.2135/cropsci2006.08.0532
- Y. Q. Wu, Y. Huang, C. G. Tauer and D. R. Porter, “Genetic Diversity of Sorghum Accessions Resistant to Greenbugs as Assessed with AFLP Markers,” Genome, Vol. 49, No. 2, 2006, pp. 143-149.
- G. Burow, C. Franks C, V. Acosta-Martinez and Z. Xin, “Molecular Mapping and Characterization of BLMC, a Locus for Profuse Wax (Bloom) and Enhanced Cuticular Features of Sorghum (Sorghum bicolor (L.) Moench,” Theoretical and Applied Genetics, Vol. 118, No. 3, 2009, pp. 423-431. doi:10.1007/s00122-008-0908-y
- M. A. Menz, R. R. Klein, J. E. Mullet, J. A. Obert, N. C. Unruh and P. E. Klein, “A High-Density Genetic Map of Sorghum bicolor (L.) Moench Based on 2926 AFLP®, RFLP and SSR Markers,” Plant Molecular Biology, Vol. 48, No. 5-6, 2002, pp. 483-499. doi:10.1023/A:1014831302392
- F. J. Rohlf, NTSYSpc., “Numerical Taxonomy and Multivariate Analysis System,” Version 2.20e, Exeter Software, New York, 1998.
- L. R. Dice, “Measurement of the Amount of Ecological Association between Species,” Ecology, Vol. 26, No. 3, 1945, pp. 297-302. doi:10.2307/1932409
- J. K. Pritchard, M. Stephens and P. Donnelly, “Inference of Population Structure Using Multilocus Genotype Data,” Genetics, Vol. 155, No. 2, 2000, pp. 945-959.
- S. C. Murray, W. L. Rooney, M. T. Hamblin, S. E. Mitchell and S. Kresovich, “Sweet Sorghum Genetic Diversity and Association Mapping for Brix and Height,” The Plant Genome, Vol. 2, No. 1, 2009, pp. 48-62. doi:10.3835/plantgenome2008.10.0011
- J. R. Harlan and J. M. J. de Wet, “A Simplified Classification of Cultivated Sorghum,” Crop Science, Vol.12, No. 2, 1972, pp. 172-176. doi:10.2135/cropsci1972.0011183X001200020005x
- A. Barnaud, M. Deu, E. Garine, D. McKey and H. I. Joly, “Local Genetic Diversity of Sorghum in a Village in Northern Cameroon: Structure and Dynamics of Landraces,” Theoretical and Applied Genetics, Vol. 114, No. 2, 2007, pp. 237-248. doi:10.1007/s00122-006-0426-8