American Journal of Plant Sciences
Vol.3 No.8(2012), Article ID:22182,4 pages DOI:10.4236/ajps.2012.38132
Study of Fruit Diversity and Selection of Elite Acid Lime (Citrus aurantifolia Swingle) Genotypes in Nepal
![]()
1Agricultural Research Station (ARS), Dhankuta, Nepal; 2Institute of Agriculture and Animal Science (IAAS), Rampur, Chitwan, Nepal; 3Horticulture Research Division (HRD), Lalitpur, Nepal; 4Nepal Academy of Science and Technology (NAST), Lalitpur, Nepal.
Email: *rals_135@yahoo.com
Received April 22nd, 2012; revised May 18th, 2012; accepted May 28th, 2012
Keywords: Vitamin C; TSS; TA; Correlation; Elite Genotypes; Conservation
ABSTRACT
Acid lime (Citrus aurantifolia) fruits are cultivated in terai, mid hill and high hill districts of Nepal. It is cross-pollinated crop and has a high variation in fruit characters within the species. Fruit character is the main basis of genotype selection. Study of fruit diversity is of utmost importance to select the elite genotypes for breeding and variety development program. Therefore, total of 620 fruit samples were collected and evaluated in the main production season of the year 2010 and 2011, from 62 bearing trees. Samples were collected from three agro-ecological domains, representing terai, mid hill and high hill areas of eastern Nepal. Elite landraces were selected on the basis of scoring fruit characters. High variation in vitamin C was observed between the terai (57.4 mg) and high hill (72.5 mg) samples. Amount of juice was 36.8% in mid hill and 44.1% in terai samples. Higher percent of juice and total soluble solids (TSS) observed in terai samples but tritable acidity (TA) and vitamin C was low as compare to high hills. There was significantly negative correlation found in fruit weight, fruit diameter, juice percent and seed number, whereas significantly positive correlation was in pulp and vitamin C, with altitude range. Total landraces were separated in five major cluster group. Variation in the level of similarity was observed among the cluster groups. The variability distance of fruit characters was highest in cluster group II (–17.45%) and lowest in cluster group V (58.5%). On the basis of scoring number of fruit characters, total four elite genotypes i.e. LD-49 from mid hills, LD-23 and LT-17 from higher hills and LM-44 from terai were selected for conservation, breeding and variety development purpose.
1. Introduction
Acid lime (Citrus aurantifolia Swingle) commonly known as “Kagati” is an important commercial fruits, which has been traditionally cultivated in most of the districts of Nepal [1]. The area coverage of acid lime has been reported 16% of total fruit crops [2] in Nepal. The total cultivated area of acid lime fruits is 2635.3 ha and production and productivity of fruits is 22,398.6 mt and 8.5 ton/ha respectively [3]. The main production season of lime in Nepal is September to November, but demand in the market is throughout the year [4]. Among the commercial citrus species it comes in third rank after mandarin and sweet orange in terms of area and production. Cultivation range of acid lime in Nepal is 800 m to 1400 m als in the mid hills stretching from east to west, but potentiality of cultivation range could be much wider from 125 m asl terai to 1800 m asl in high hills of Nepal [5]. Three cultivars of lime have been grown in terai area, i.e. acid lime (Pahade Kagati or Sun Kagati), eureka (Chasme Kagati) and natural hybrid types [6]. Among them acid lime has high commercial value in the market due to better aroma, appropriate size and medicinal value. It is used for juice, desert, pickle and other medicinal purpose. According to analysis report of Food Science Laboratory Central America, the food value per 100 gram edible fruits of acid lime consisted, moisture 88.7% - 93.5%, protein 0.070 - 0.112 g, fat 0.04 - 0.17 g, fiber 0.1 - 0.5 g, ash 0.25 - 0.40 g, calcium 4.5 - 33.3 mg, phosphorus 9.3 - 21.0 mg, iron 0.19 - 0.33 mg, vitamin A 0.003 - 0.040 mg, Thiamine 0.019 - 0.068 mg, Riboflavin 0.011 - 0.023 mg, niacin 0.14 - 0.25 mg, ascorbic acid 30.0 - 48.7 mg.
Fruit characters especially juice, TSS, TA and vitamin C, is one of the important parameter for the selection of elite genotypes of citrus trees. Elite genotypes of citrus fruit can be selected through the assessment of tree morphological characters and consumer’s preference. Farmers are highly preferred the quality rather than size and yield of the fruits [7]. Consumers prefer the fruit quality of acid lime is round, thin skinned, yellow colour; juicy and medium size 35 - 50 g [4].
Quality of acid lime fruits depend on the amount of juice, TSS, TA and vitamin C, which may vary according to the altitude, climate, temperature, soil fertility and genotypes. Wide range of diversity in acid lime fruit characters were observed within the 18 landraces in Rampur condition [8]. However study of fruit characters at different agro ecological regions has not been carried out in the past and very limited literatures are available in this aspect. Evaluation of fruit characters at different agro ecological zone is urgent for selection of elite genotypes and development of new variety. Therefore, the main objectives of this study is to determined the variation of fruit quality (juice, vitamin C, TSS, and TA) of acid lime landraces at different altitudinal range in the eastern part of Nepal and select elite genotypes for commercial cultivation. Findings of the study will be fruitful to select the best quality acid lime genotype for breeding and variety development purpose.
2. Materials and Methods
2.1. Sample Collection
Out of 2856 acid lime trees, total 62 bearing trees were selected randomly from the farmer’s orchard and labeled for the collection of fruits sample. Fruit samples were collected from three different agro ecological domain, representing terai (<600 m asl), mid hill (600 to 1200 m asl) and high hill (>1200 m asl). Ten fruits (two fruit per dimension) were collected randomly from each tree.
2.2. Fruit Character Study
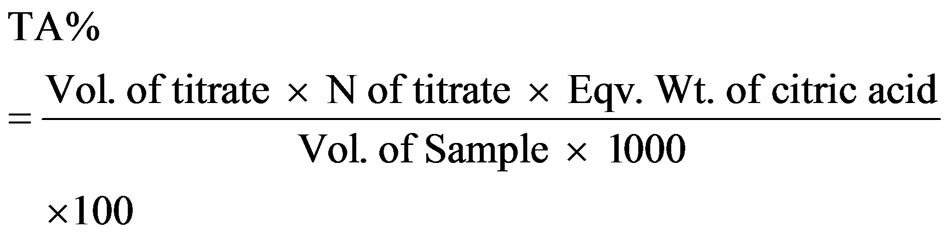
The external character of fruits i.e. height and diameter was measured by venire caliper and fruits weight was measured by electronic digital balance. The quality of fruit like peel, pulp and juice percent were measured on the basis of fruit weight. Titrable acids (TA) and vitamin C were analyzed in the Post Harvest Technology and Research Unit, Khumaltar, Lalitpur. Total soluble solids (TSS) were measured with the help of Refrectometer. Titrable acids were calculated by using formula [9]. Two ml of juice was titrated in 0.2 Normality of sodium hydroxide to phenolphthalein endpoint and total acid percent was calculated.
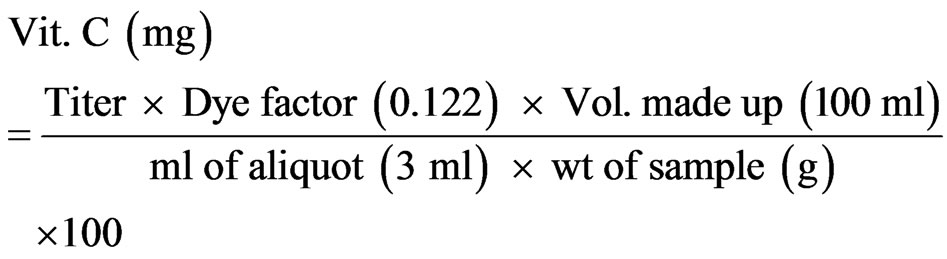
2.3. Vitamin C (Ascorbic Acid)
Vitamin C (Ascorbic acid) was determined by the 2,6- dichlorophenol indophenols titration method and calculated by formula [10].
2.4. Data Analysis
The quantative data obtained from the sample analysis were subjected to agglomerative hierarchical cluster analysis for the assessment of diversity of fruit characters. Principal component analysis (PCA) was performed on the original data matrix. Principal component scored with Eigen values greater than 1.0. Ward and Pearson’s method was used for combining the cluster. The validity of cluster analysis solution was examined with the help of descrimanent analysis on the original data matrix. Partial correlation procedures were used to determine the association and order of importance among the quality determining characters. All the data were analyzed by using Minitab 14 computer software program.
2.5. Selection of Elite Landraces
Selection of superior landraces was carried out based on the evaluation of fruit characters and score groups are separated on the basis of quantative data table of fruits characters, collected from different altitude range. Fruits were evaluated on the basis of scoring group (Table 1) and superior genotypes were selected by the addition of all score. Higher score indicates the better quality of genotypes.
3. Results
3.1. Fruit Characters Analysis
The analyzed data indicated the range of variability of fruit characters among the accessions of acid lime landraces. Small variation was observed according to altitudinal range in peel, pulp, TSS, and TA percent, but variation was observed in fruit weight, seed number, juice percent and vitamin C. Average amount of juice was found to be 40.0%, whereas highest in terai accessions (44.1%) and lowest in mid hill accessions (36.8%). Average amount of vitamin C was 63.5 mg per 100 ml juice whereas highest was found in high hill accessions 72.5 mg and lowest in terai accession 57.4 mg (Table 2). Fruit weight and peel percent was higher in terai (43.3 g and 21.8%) and lower in high hill (34.4 g and 19.8%) accessions. Similarly number of seeds was higher (10) in terai
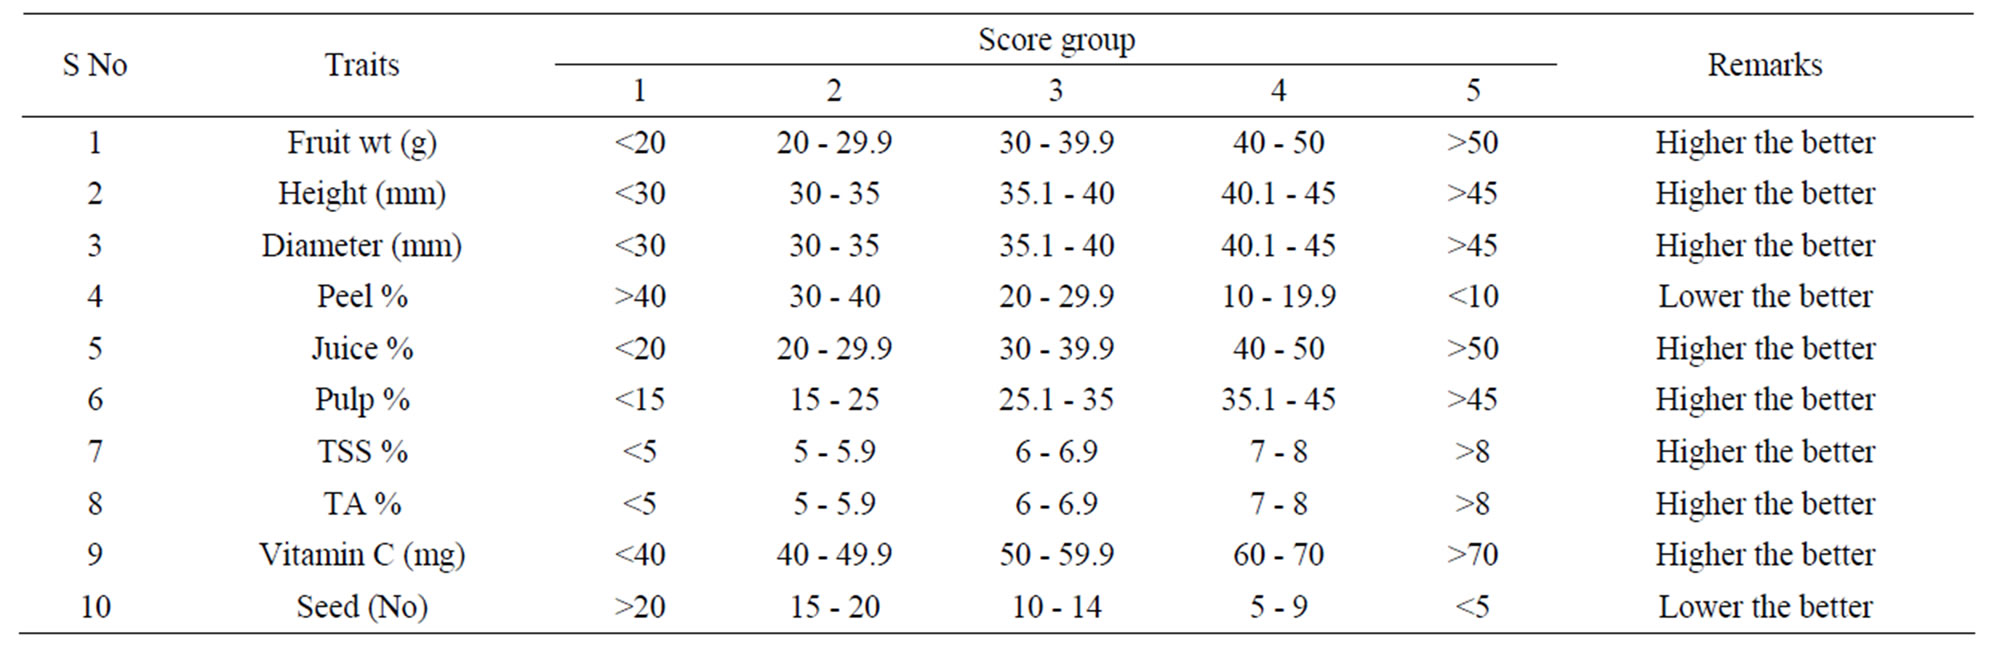
Table 1. Fruit characters and scoring groups of acid lime fruits.
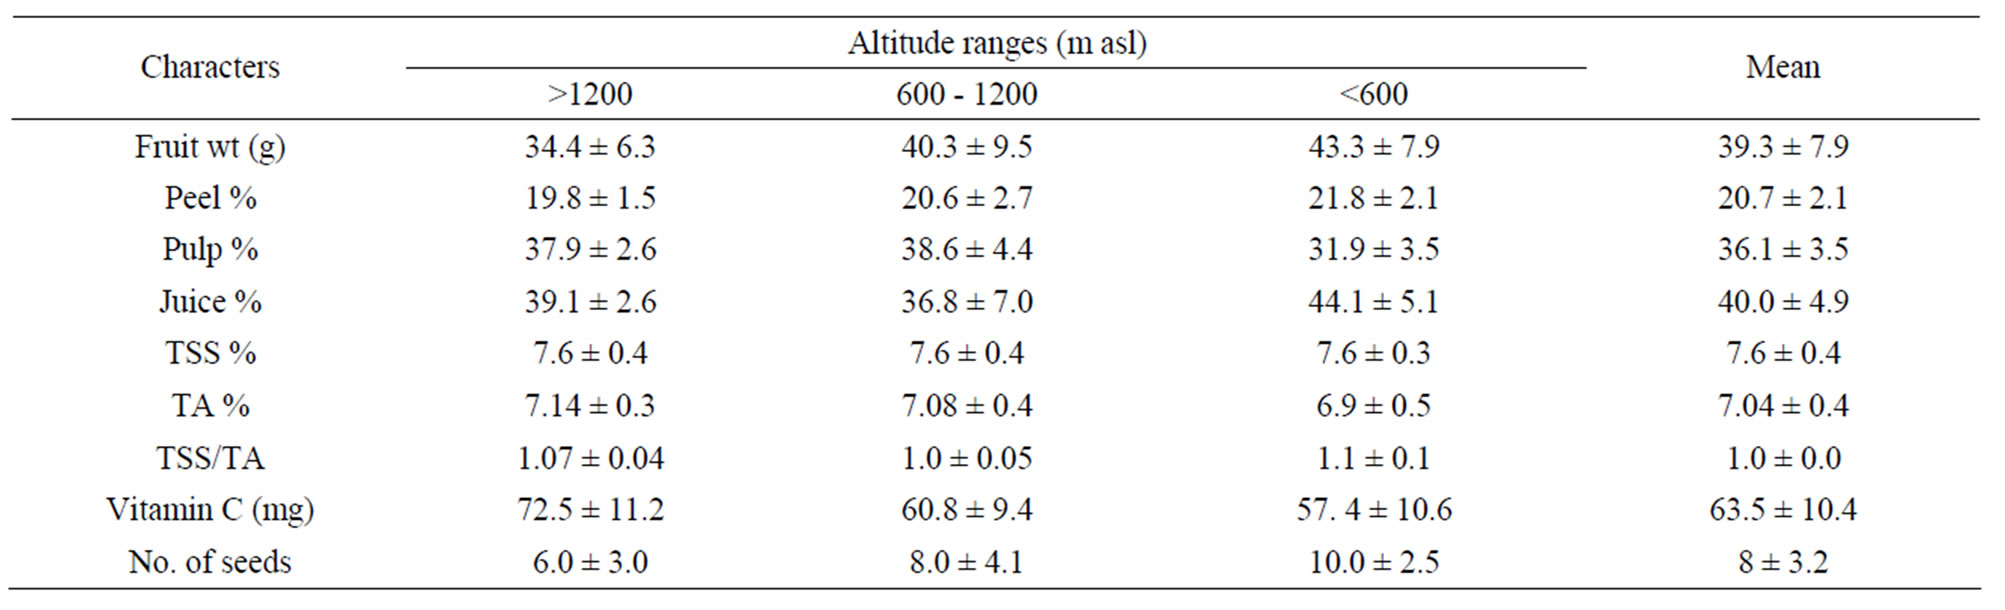
Table 2. Variation of fruit characteristics of acid lime fruit at different altitudinal range.
and lower (6) in high hills. In the present study, fruit weight, peel, and number of seeds was decreased in higher hills as compare to terai, but TA and vitamin C was increased in higher hills.
3.2. Correlation of Fruit Characters
Variation of fruit characters was observed in correlation matrix. Significantly negative correlation was found in fruit weight, fruit diameter, juice percent and seed number, whereas significantly positive correlation in pulp, and vitamin C, with altitude range but no significant effect was observed in peel, TSS and TA. There is signifycantly positive correlation was observed in fruit height, diameter and seed number with fruit weight and no significant correlation was observed in TA, TSS, vitamin C, juice, pulp and peel percentage. Significantly positive correlation was observed in fruit diameter, fruit height and fruit weight with number of seed and non significant relation was in peel, pulp, vitamin C, juice, TSS and TA percent (Table 3).
3.3. Multivariate Analysis
A pair wise association among acid lime landraces was measured from the fruits characters, using Ward and Euclidean distance and revealed a clear clustering into different cluster groups. In the dendrogram, all the accessions were separated in 5 cluster groups. Majority of the accessions (21) are clustered in to group II and cluster group IV (17) whereas minimum number of accession (3) was in cluster V. The accessions 55, 57 of cluster IV and 56, 59 cluster V are 100% similarity in fruit character (Figure 1). The result of cluster analysis shows that, high variation was observed in the level of similarity within the cluster group The variability distance of fruit characters was higher in group II (−17.45) and lower was in cluster group V (58.5 %). According to the altitude range mid and high hill region were consisted of 23 accessions and 16 accessions was consisted in terai.
3.4. Principal Component Analysis
Unlike to the hierarchical clustering, the principal component analysis of quantitative traits exposed a clear grouping of lime accessions. The accessions are separated in two axis and showed remarkable variation among the landraces (Figure 2). The results revealed that, first axis largely accounted for the variation among the lime accessions (31.9%) followed by second axis (21.0%). The cumulative variation in the three axes accounted 71.3%
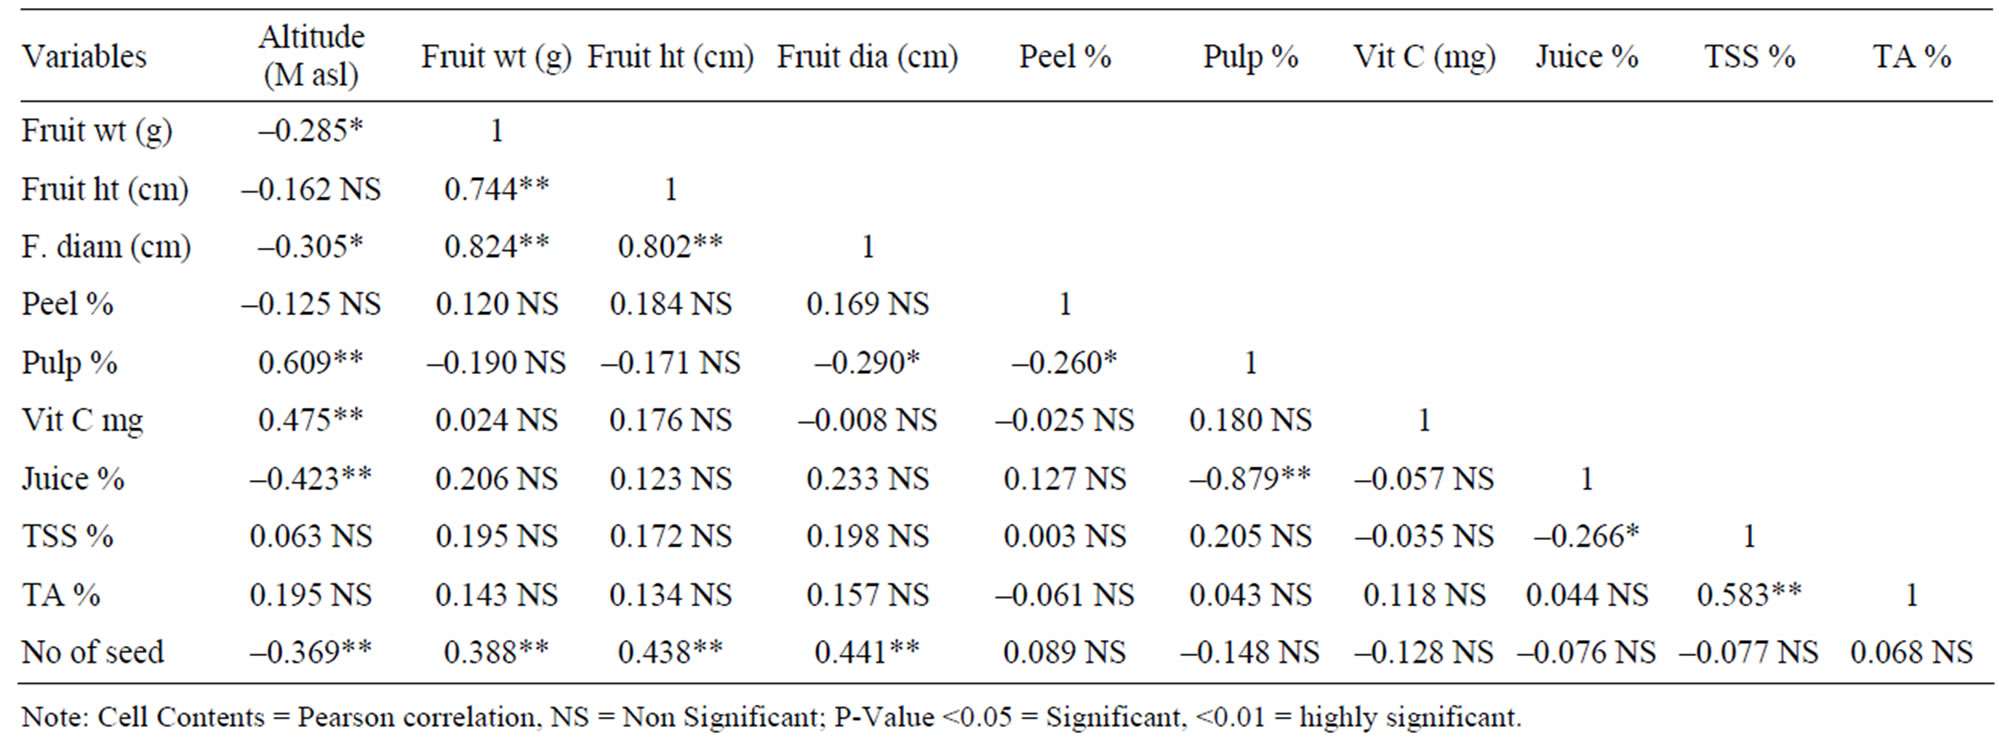
Table 3. Correlations matrix of acid lime fruit characters.
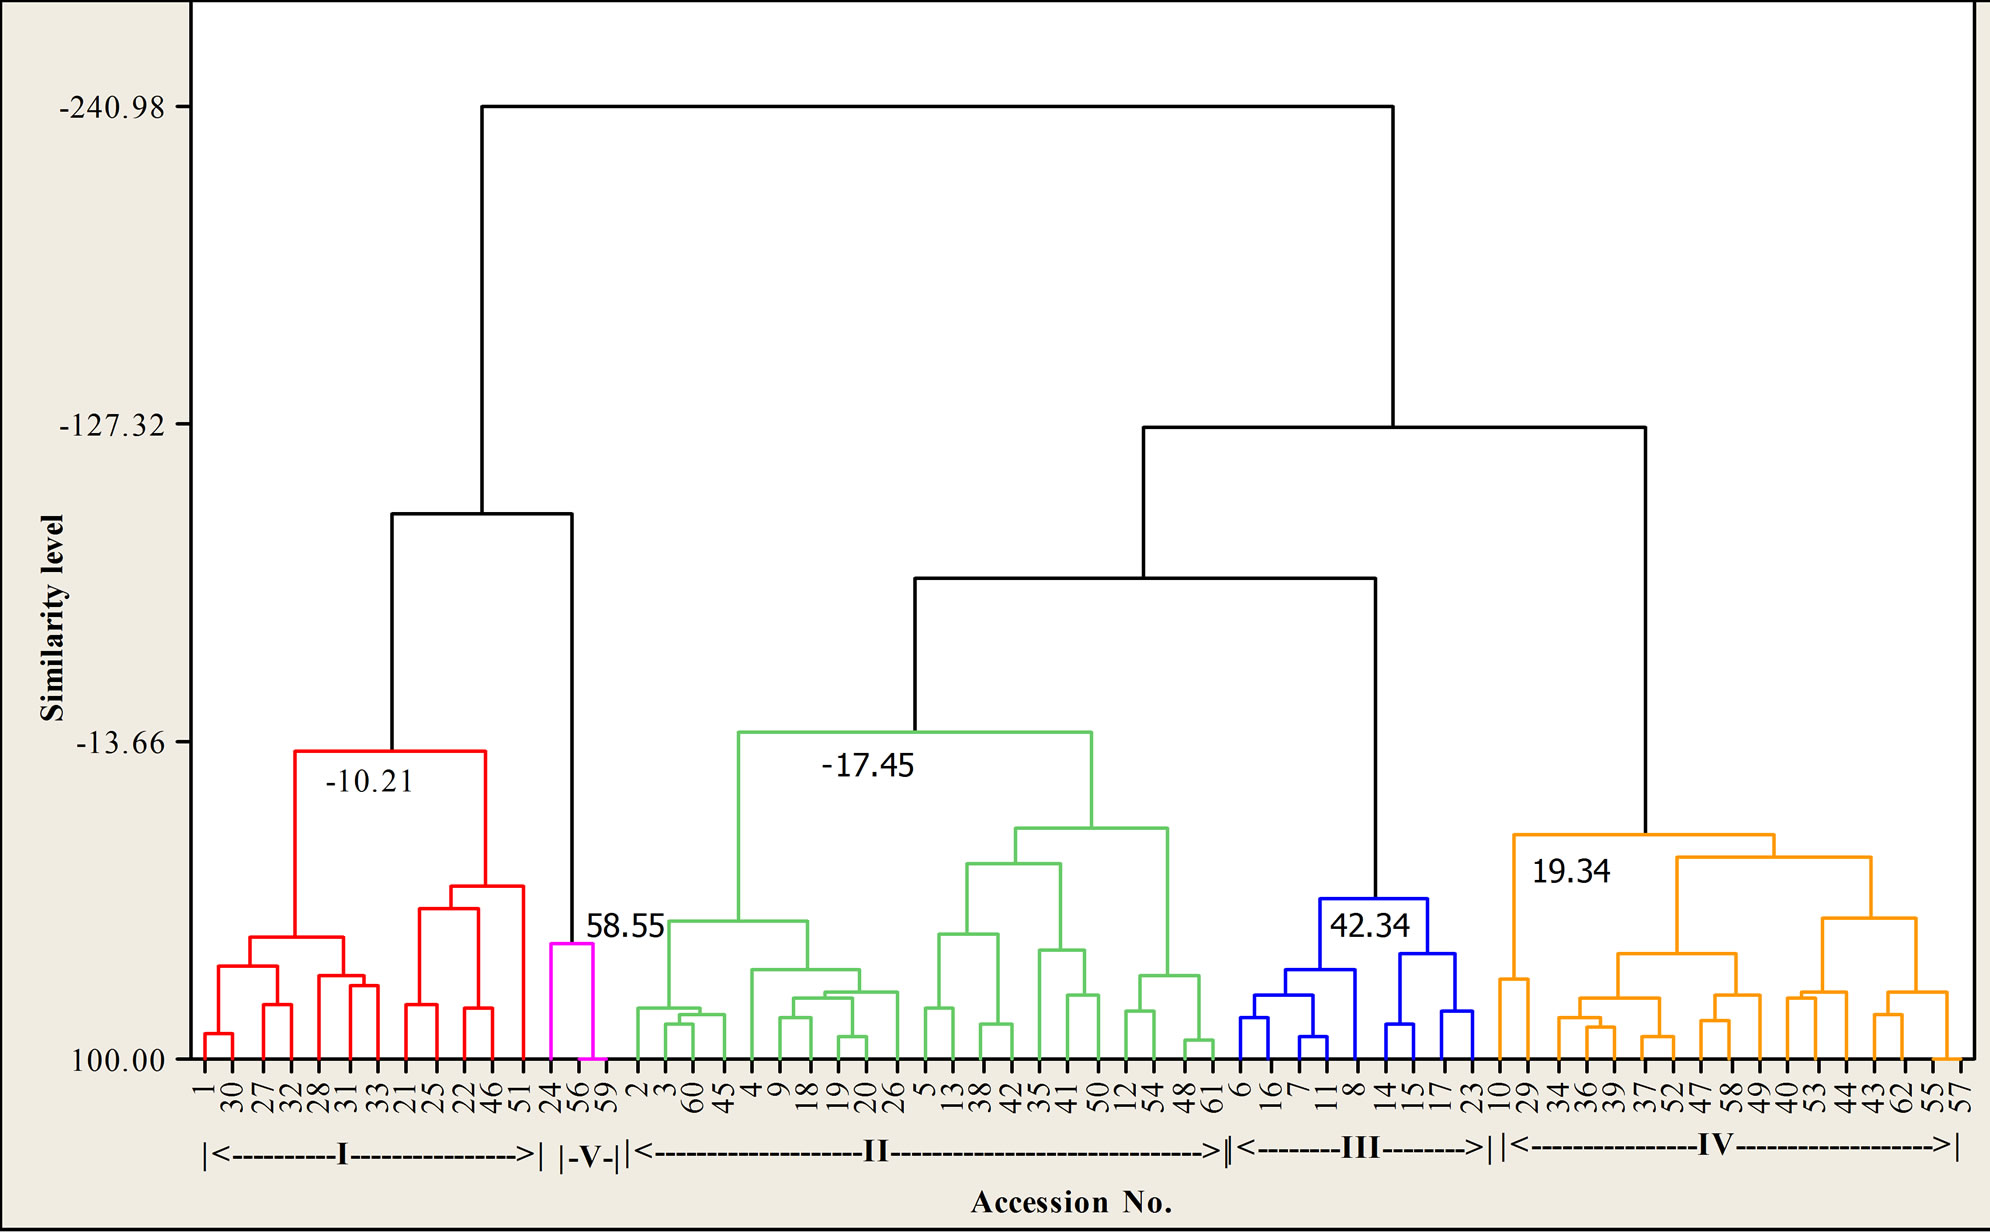
Figure 1. Dendrogram of 62 acid lime landraces with ward linkage and Pearson’s distance.
of the total variation among 7 characters describing 62 lime accessions.
Eigen value of principal component axes of total variation accounting for them obtained from principal component analysis are presented in (Table 4). Among the variables higher variation was (0.514) observed in pulp percentage in PC1. Similarly high variability was (0.443) observed in TAA/TA ratio in PC2 and (0.692) was observed in TSS percent in PC3. The cumulative variability of fruit character was 71.3% in the PC3.
3.5. Selection of Superior Landraces
Four elite genotypes were selected on the basis of fruit characters and scoring percent. High score was (86%) observed in accession LD-49 and LD-23 followed by LT-17 and LM-44 (82%). The accession LD-49 and LD-23 was collected from the mid hill (1185 m asl) and high hill range (1308 m asl) of Dhankuta district and LT-17 collected from high hill (1750 m asl) of Tehrethum district whereas LM-44 was collected from terai
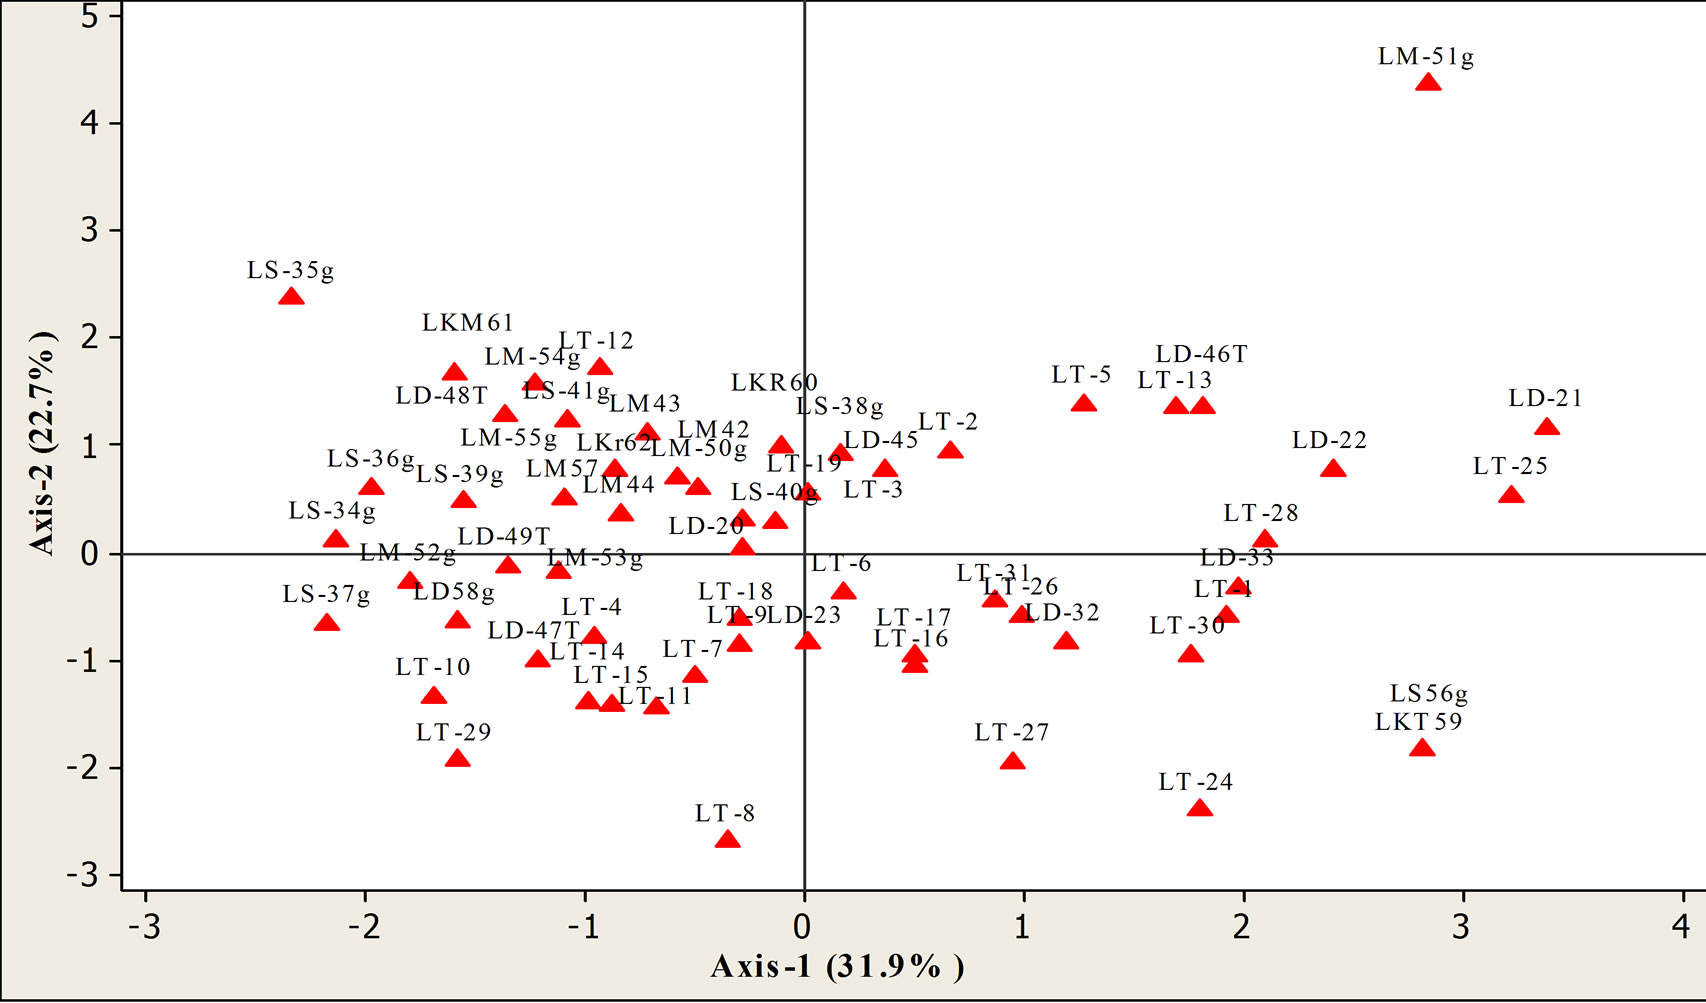
Figure 2. Scattered diagram of 62 acid lime accessions along with the first and second principal component.
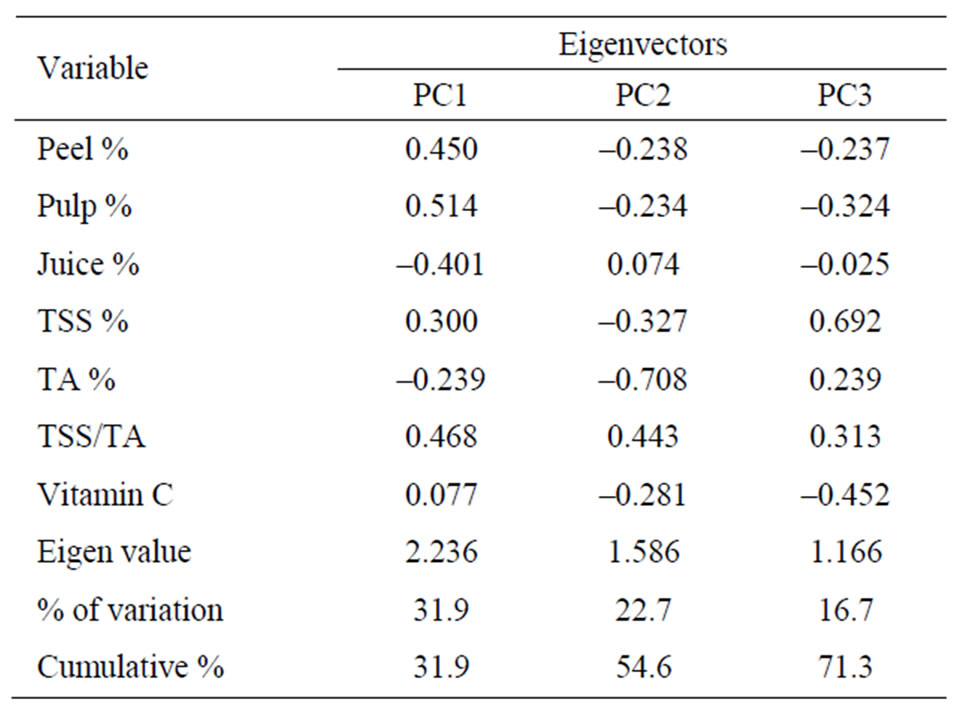
Table 4. Correlation matrix of fruit characters of acid lime landraces with respect to principal component (PC) analysis.
range (135 m asl) of Morang district (Table 5). Among the selected landraces highest juice 52.5% was observed in LD-49 landraces and highest vitamin C (92.4 mg per 100 ml juice) was observed in high hill landraces (LT-17).
4. Discussion
Large variations was found in the fruit characters of acid lime landraces especially fruit weight, seed number, juice percent and vitamin C (ascorbic acid) in the eastern part of Nepal. Fruit weight was 26% and number of seed was 66% greater in terai accessions than high hills. Juice percent was increased in terai samples than mid and high hills, whereas vitamin C was higher in high hill accessions than terai. Wider variation in fruit characters was reported within the 18 acid lime landraces in Rampur condition. The range of rind thickness, 1.5 - 2.3 mm; total soluble solids, 5.09% - 7.79%; total titrable acidity, 5.01% - 7.02% and juice, 40.39% - 58.62% [11]. Diversity of acid lime fruits, like fruit size, 23 - 138 gm; seeds per fruit, 0 - 36; juice content 13% - 48%; TSS, 5.5% - 8.7% and TA, 4.4% - 8.2 % [12]. Concentration of juice and vitamin C was influenced by the altitude range, fruit bearing position and maturity stage. The juice content of acid lime was 50% - 52%, acidity of 6.2% - 6.9%, and TSS of 6.2% - 8%, which could be used as index of harvesting maturity [13]. Juice percent of acid lime was varied from 45% - 58% and acidity from 6.2% - 7.6% at maturity in South India [12]. Generally, citrus fruit contain approx 40 - 60 mg ascorbic acid per 100g fresh juice [14]. Concentration of ascorbic acid also varies according to the species; orange generally content 40 - 70 mg of vitamin C per 100 ml juice and grape fruit, tangarin and lemon content 20 - 50 mg per 100 ml juice [15]. Under the tropical condition, TSS and juice is increases, but TA decreased in the citrus fruits due to high vegetative growth and humidity. In sub tropical climate fruits have good colour smooth surface, low TSS and high TA [16]. In this study, ascorbic acid and TA was increased in high hill samples and TSS and juice was increased in terai samples.
The correlation matrix was proved that, vitamin C was increased in high hills sample and fruit weight and peel percent was increased in terai samples. All the samples were separated in five cluster groups and similarity level
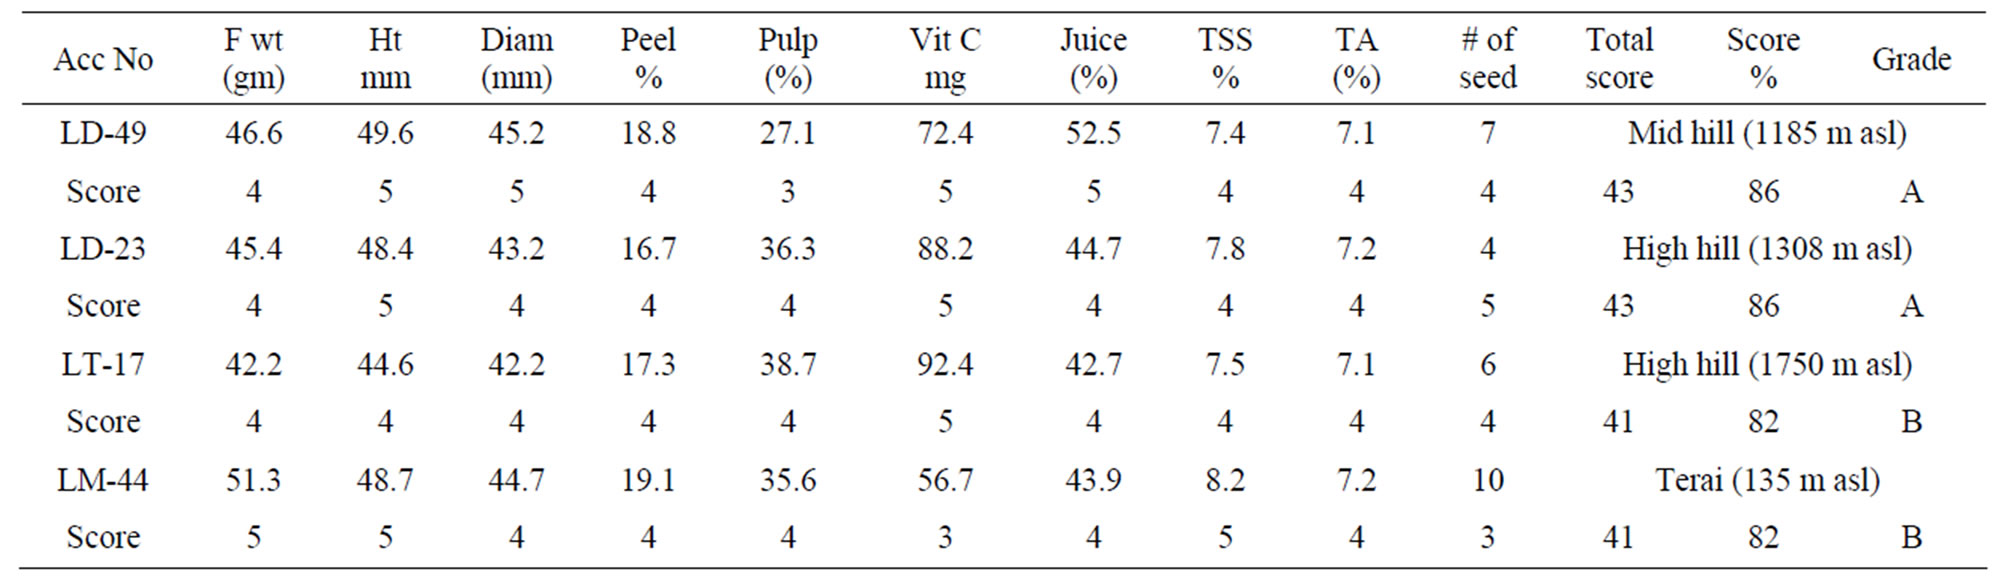
Table 5. Fruit characters and scoring number of selected landraces.
within the group was found 0% - 117%. The accessions 55, 57 of cluster IV and 56, 59 cluster V are 100% similarity in fruit character and these accessions were bigger fruit size than other groups. The two dimensional principle component analyses was clearly revealed, fruit samples collected from different agro ecological zones has high variation (71.2%). Better genotypes of fruits trees can be selected by evaluating the fruits quality. Fruit weight, peel percent, amount of juice, TA, TSS and vitamin C is the major parameter of determine the quality of acid lime fruits. Therefore elite genotypes of acid lime were selected on the basis of scoring these fruit parameters. Plants characters of these genotypes are similar, but variation in the fruit quality was observed according to altitude range.
5. Conclusion
In this study, high variation of vitamin C was observed in terai (57.4 mg) and high hill (72.5 mg) samples. Amount of juice was varies from 36.8% to 44.1% in mid hill and terai respectively. The variability distance of fruit characters was highest in group II (117.4%) and lowest was in cluster group V (58.5%). On the basis of scoring fruit characters, total four elite genotypes i.e. LD-49, LD-23, LT-17 and LM-44, were selected for conservation, breeding and variety development purpose. Genotypes LD-49 and LD-23, were collected from mid hills and high hills of Dhankuta district and LT-17 collected from the high hill of Tahrethum whereas LM-44 were collected from terai region of Morang district.
6. Acknowledgements
The authors are highly acknowledged to the chief of Post harvest research unit, Khumaltar, Lalitpur providing lab facility and their staffs for accessing in lab work.
REFERENCES
- Anonymous, “National Citrus Research Program,” Dhankuta, Nepal.
- P. P. Shrestha and S. K. Verma, “Development and Outlook of Citrus Industry in Nepal,” Proceedings of the 2nd National Horticulture Workshop, Katmandu, Nepal, 1998.
- MOAC, “Statistical Information of Nepalese Agriculture,” Ministry of Agriculture and Cooperatives, Agri Business Promotion and Statistical Division, Singh Durbar, Kathmandu, 2008.
- D. D. Dhakal, K. M. Tripathi and S. Bhattarai, “Marketing Survey of Lime and Hill Lemon in Nepal,” Journal of the Institute of Agriculture and Animal Science, Vol. 26, No. 2, 2003, pp. 106-107.
- D. D. Dhakal, T. P. Gotame, S. Bhattarai and H. N. Bhandari, “Assessmnet of Lime and Hill Lemon Production in Nepal,” Journal of the Institute of Agriculture and Animal Science, Vol. 23, No. 3, 2002, pp. 49-58.
- K. P. Paudyal and R. L. Shrestha, “Diversity Study and Selection of Lime (Citrus aurantifolia) Genotypes for Expansion of Production Period in Nepal,” Proceedings of the 4th National Horticulture Workshop, Katmandu, 2004.
- K. P. Paudyal and N. Haq, “Variation of Pomelo (Citrus grandis L.) in Nepal and Participatory Selection of Strains for Further Improvement,” Agroforestry Systems, Vol. 72, No. 3, 2008, pp. 195-204.
- D. P. Sapkota, “Characterization and Evaluation of Acid Lime (Citrus aurnatifolia Swingle) Landraces at Rampur, Chitwan Condition,” Thesis of Master of Science, 2006.
- S. Rangana, “Hand Book of Analysis and Quality Control for Fruit and Vegetable Products,” Tata McGraw-Hills Publishing Company Limited, New Delhi, 1995.
- B. C. Jonsan, “Methods of Vitamin Determination,” 3rd Edition, Inter Science Publisher, New York, 1966, pp. 282-287.
- K. C. Jagat Bahadur and B. K. Rai, “Determination of LAscorbic Acid (Vitamin C),” Basic Food Analysis Hand Book, Nepal, 2007.
- G. S. Siddapa, “Quakity Standard for South Indian Citrus Fruit,” Indian Journal of Horticulture, Vol. 9 No. 1, 1992, pp. 7-24.
- M. T. Jawaharlal, T. Thangaraj and I. Irulappan, “A Note on the Post Harvest Qualities of Acid Lime,” South Indian Hort, Vol. 40, No. 1, 1992, pp. 229-230.
- G. D. Subedi and H. J. Jacobsen, “Establishment of Tissue Culture Techniques in Citrus Species,” Proceedings of International Conference on “Biotechnology and Biodiversity,” Katmandu, 2000.
- S. V. Ting and J. A. Attwa, “Citrus Fruit in the Biochemistry and of Fruit and Their Product,” Academic Press, New York, Vol. 2, 1991, pp. 107-179.
- W. B. Hayes, “Fruit Growing in India,” Kalyani Publisher, New Delhi, 1975.
NOTES
*Corresponding author.