Open Journal of Applied Sciences
Vol.3 No.2(2013), Article ID:33383,6 pages DOI:10.4236/ojapps.2013.32029
Mean-Field Solution of a Mixed Spin-3/2 and Spin-2 Ising Ferrimagnetic System with Different Single-Ion Anisotropies
Department of Physics, Faculty of Science, Elmergeb University, Zliten, Libya
Email: dr_fathiomar@yahoo.com
Copyright © 2013 Fathi Abubrig. This is an open access article distributed under the Creative Commons Attribution License, which permits unrestricted use, distribution, and reproduction in any medium, provided the original work is properly cited.
Received December 6, 2012; revised February 14, 2013; accepted February 22, 2013
Keywords: Ising Model; Magnetization; Compensation Point; Critical Lines; Tricritical Point; Anisotropy; Mixed-Spin
ABSTRACT
The mixed spin-3/2 and spin-2 Ising ferrimagnetic system with different single-ion anisotropies in the absence of an external magnetic field is studied within the mean-field theory based on Bogoliubov inequality for the Gibbs free energy. Second-order critical lines are obtained in the temperature-anisotropy plane. Tricritical line separating secondorder and first-order lines is found. Finally, the existence and dependence of a compensation points on single-ion anisotropies is also investigated for the system. As a result, this mixed-spin model exhibits one, two or three compensation temperature depending on the values of the anisotropies.
1. Introduction
During the past several decades, both experimental and theoretical studies have accumulated in the area of molecular-based magnetic materials [1-3]. These materials include bimetallic molecular-based magnetic materials in which two kinds of magnetic atoms alternate regularly and exhibit ferrimagnetic properties and therefore they are well interpreted by the use of mixed-spin Ising systems which have less translational symmetry than their single-spin counterparts since they consist of two interpenetrating unequivalent sublattices. For this reason, in recent years, there have been many theoretical studies of the mixed-spin systems.
One of the earliest and simplest of these models to be studied was the mixed spin Ising system consisting of spin-1/2 and spin-S (S > 1/2) in a uniaxial crystal field. The model for different values of S (S > 1/2) has been investigated by acting on honeycomb lattice [4-6], as well as on Bethe lattice [7,8], mean field approximation [9], effective field theory with correlations [10-14], cluster variational theory [8], renormalization-group technique [15] and Monte-Carlo simulation [16-18]. The mixedspin Ising systems consisting of higher spins are not without interest. Indeed, the magnetic properties of mixed spin-1 and spin-3/2 Ising ferromagnetic system with different single-ion anisotropies have been investigated with the use of an effective field theory [19,20], mean field theory [21], a cluster variational method [22] and Monte Carlo simulation [23].
Recently, the investigations have been extended to high order mixed spin ferrimagnetic systems (mixed spin- 3/2 and spin-2 ferrimagnetic system and mixed spin-3/2 and spin-5/2) in order to construct their phase diagrams in the temperature-anisotropy plane and to consider magnetic properties of these systems.
Bobak and Dely investigated the effect of single-ion anisotropy on the phase diagram of the mixed spin-3/2 and spin-2 Ising system by the use of a mean-field theory based on the Bogoliubov inequality for the free energy [24].
Albayrac also studied the mixed spin-3/2 and spin-2 Ising system with two different crystal-field interactions on Bethe lattice by using the exact recursion equations [25]. Bayram Deviren et al. have used the effective field theory to study the magnetic properties of the ferrimagnetic mixed spin-3/2 and spin-2 Ising model with crystal field in a longitudinal magnetic field on a honeycomb and a square lattice [26].
In this paper, we therefore apply the mean-field theory based on Bogoliubov inequality for the Gibbs free energy to study the effects of two different single-ion anisotropies in the phase diagram and in the compensation temperatures of the mixed spin-3/2 and spin-2 Ising ferrimagnetic system. The existence of the compensation temperatures in ferrimagnets has an interesting application such as the magneto-optical recording [27].
The outline of this work is as follows. In Section 2 we define the model and present the mean-field theory based on Bogoliubov inequality for the Gibbs free energy. We also have described Landau expansion of the free energy in the ordered parameter. In Section 3 we discuss the phase diagrams and compensation temperature for various values of the single ion anisotropies. Finally, In Section 4 we present our conclusions.
2. Model and Formulation
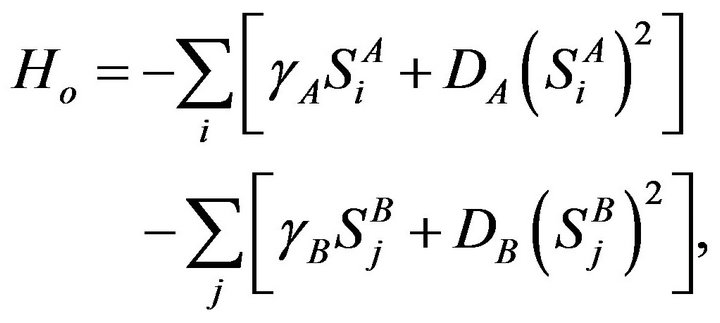
The model we investigate is the mixed spin-3/2 and spin-2 Ising ferrimagnetic system described by the Hamiltonian
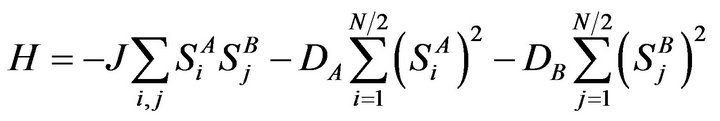 , (1)
, (1)
where the first summation is carried out only over nearest neighbour pairs of spins on different sublattices and  is the nearest-neighbour exchange interaction. In this system, sites of the sublattice A are occupied by spins
 , which take the values
 ,
,  and 0 while those of the sublattice B are occupied by spins
 which take the values
  and
and . DA is the crystal field interaction constant of spin-2 ions and DB is that of spin-3/2 ions. In order to treat the model approximately we employ a variational method based on the Bogoliubov inequality for the Gibbs free energy which is given by:
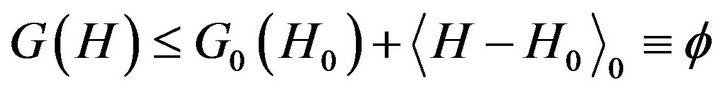 , (2)
, (2)
where  is the true free energy of the system described by the Hamiltonian (1),
  is the average free energy of a trial Hamiltonian
  and
and  denotes a thermal average over the ensemble defined by
 .
.
To obtain the MFA, we assume the trial Hamiltonian in the form
 (3)
(3)
where  and
and  are the two variational parameters related the molecular fields acting on the two different spins, respectively. Already at this stage it is clear that the use of the trial Hamiltonian (3) naturally leads to the mean-field approximation for the present model. Because of the simplicity of
 , it is easy to evaluate the expressions in Equation (3) and we finally obtain
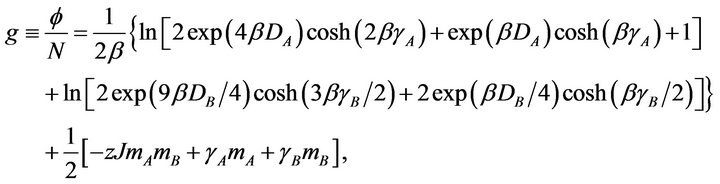 (4)
(4)
where: , N is the total number of sites of the lattice and
 is the number of the nearest neighbors of every ion in the lattice.
  and
and  are the sublattice magnetizations per site which defined by
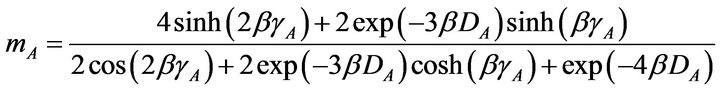 , (5)
, (5)
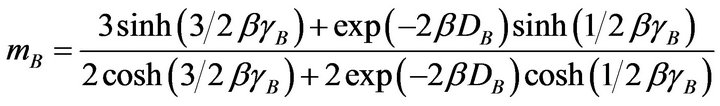 , (6)
, (6)
Now, by minimizing the free energy (4) with respect to  and
and , we determine these parameters in the form
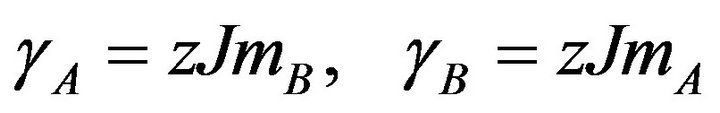 , (7)
, (7)
The mean field properties of the present system are then given by Equations (4)-(7). As the set of Equations (5)-(7) have in general several solutions for the pair , and the pair chosen is that which minimizes the free energy in Equation (4). So, analysis of the phase diagrams must be performed numerically. Nevertheless, some parts of the phase diagrams must be discussed analytically. For instance, close to the second-order phase transition from the ordered state
  to the paramagnetic one
 , the sublattice magnetizations
  and
and  are very small in the neighborhood of second-order transition point, so, we may expand Equations (4)-(6) to obtain a Landau-like expansion in the form
 (8)
(8)
where the coefficients a and b are given by
 (9)
(9)
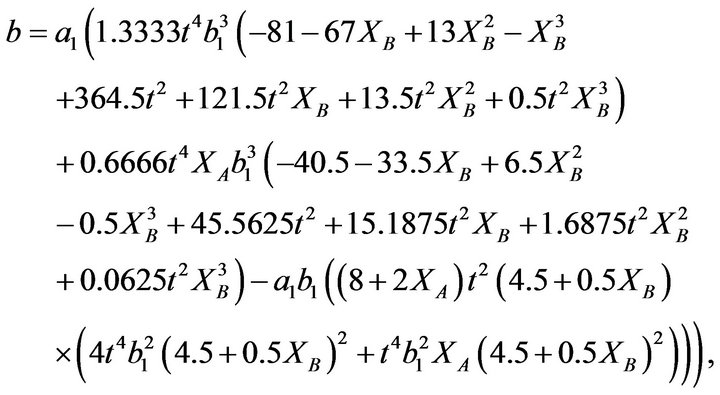 (10)
(10)
where
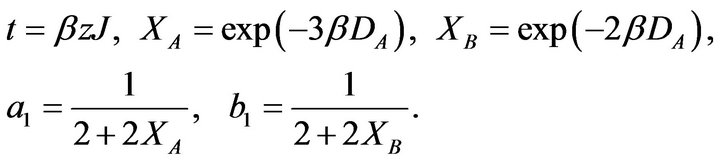
For simplicity, the coefficient c is not given here. In this way, we can obtain second-order phase transition lines when a = 0 and b > 0; and tricritical points when a = b = 0 and c < 0. It should be noted that the coefficients a and b are even functions of J. Therefore, the critical behaviour is the same for both ferromagnetic (J > 0) and ferrimagnetic (J < 0) systems. On the other hand, in the ferrimagnetic case the signs of sublattice magnetizations are different, and there may be compensation temperature  at which the total magnetization per site M is equal to zero, although
  and
and . We are here interested in studying the phase diagrams and the compensation temperature, if it exists, in the system which can be determined from the equation
 (11)
(11)
3. Results and Discussions
3.1. The Ground-State Phase Diagram
Before going into detailed calculation of the phase diagram of the model at higher temperature, we begin with the ground-state structure of the system at zero temperature analytically. The ground-state phase diagram is easily found from Hamiltonian (1) by comparing the groundstate energies of different phases, and is shown in Figure 1. The ground state energy configurations is the one with the lowest energy and each of these configurations for the given system parameters correspond to the stable states of the model. Hence, at zero temperature, we find
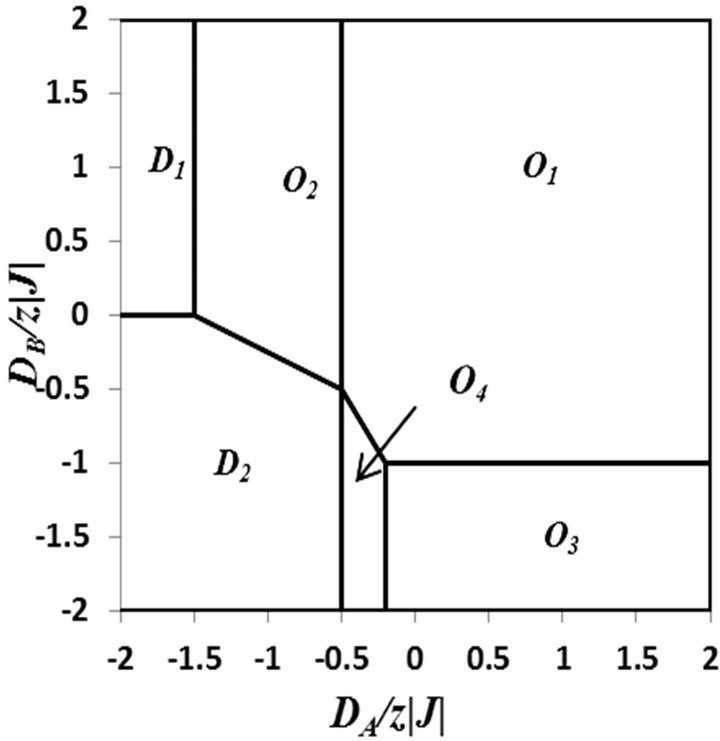
Figure 1. Ground-state phase diagram of a mixed spin-3/2 and spin-2 Ising ferrimagnetic system with the coordination number z and different single-ion anisotropies DA and DB. The six phases: ordered O1, O2, O3, O4 and disordered D1, D2 are separated by lines of first-order transitions.
four phases with Different values of  , namely the ordered phases.
These ordered phase are  (or
(or  as well),
  (or
(or  as well),
  (or
(or  as well),
  (or
(or  as well), and disordered phases
 , where the parameter
  and
and  are defined by:
 .
.
3.2. The Finite Temperature Phase Diagrams
For the finite temperature phase diagrams, we have confined our calculations only to the second-order phase including the tricritical points. The resulting phase diagram in the  plane, for selected values of
  is shown in Figure 2.
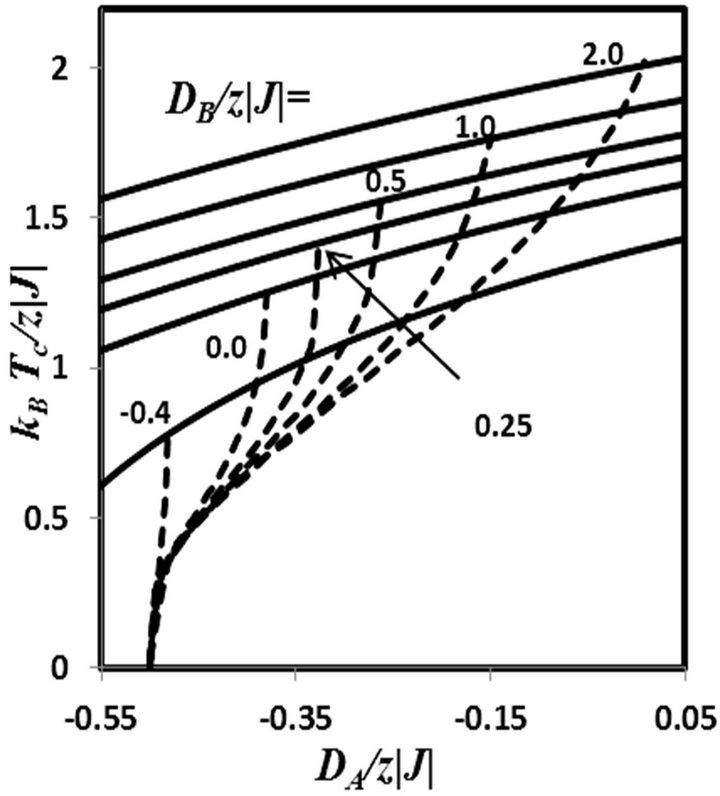
In this Figure, the solid lines are used to represent the second-order transitions, while the dashed curve represents the positions of tricritical points (The critical points at which the phase transitions change from second to first-order). The second-order phase transition lines are obtained from Equations (9) and (10) by setting a = 0 and b > 0 and the tricritical points are obtained from Equations (9) and (10) by setting a = b= 0. In particular, the values of the transition temperature in the absence of anisotropies (i.e. for  are
are  1.5812. Furthermore, from Figure 2, we note that in regions of high temperatures, for all positive and negative values of
 , and for any value of
 , the phase diagram shows only second-order phase transitions. We also found that for values of
  all the second-order lines end in the same tricritical point
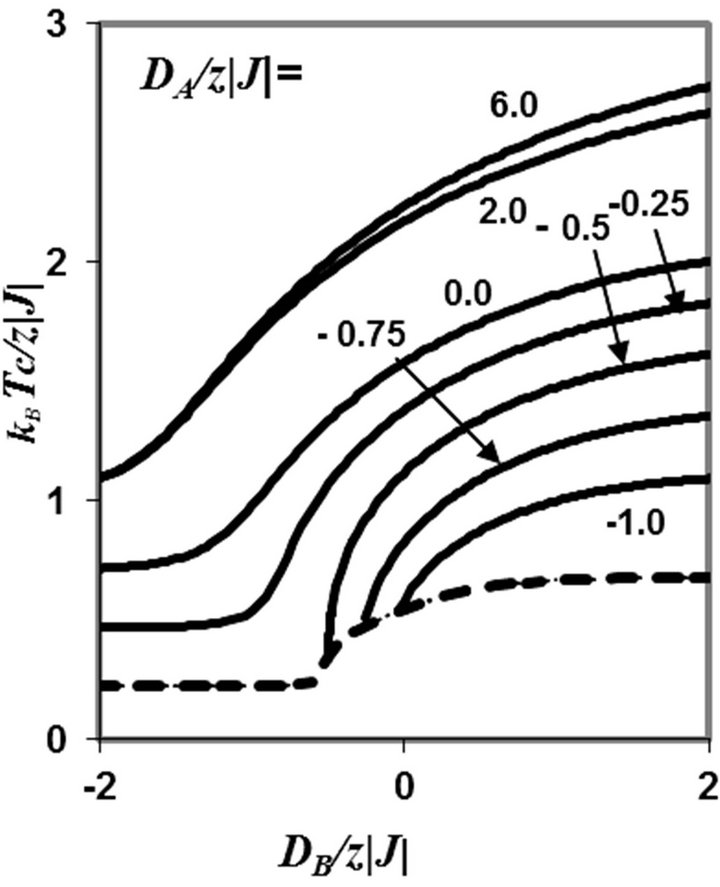
Figure 2. Phase diagram in the (DA, T) plane for the mixedspin Ising ferrimagnet with the coordination number z, when the value of DA/z|J| is changed. The solid lines indicate second-order phase transitions and the dashed line represents the positions of tricritical points.
given by  and
and . However, for values of
 , all the second-order lines end in the same tricritical point given by
  and
and . Additionally, the diagram shows that when the coordinates
  of the tricritical point are
  the mixed spin Ising system behaves like a two level system since the spin-3/2 behaves like
 . On the other hand, for
 , the coordinates
  of the tricritical point are
 . In this case, the states
  are suppressed and the system becomes equivalent to a mixed spin-1/2 and spin-2 Ising model. For this reason, the coordinates of the tricritical point in the limit of large positive
  are three times higher than those for large negative
 .
.
In Figure 3, it is shown the phase diagram of  versus
  for various values of
 . For
. For  the phase diagrams are topologically equivalent to phase diagram for the spin-3/2 Blume-Capel model which does not include any tricritical point. From Figure 3, one can observe the variation of the tricritical temperature with
 . The Tricritical temperature
  decreases from its constant value
  for large positive
  to another constant value
  for large negative
 .
.
3.3. Compensation Temperatures
A compensation temperature of the system can be evaluated by requiring the condition  in the coupled Equations (4) and (5).
Now, let us investigate whether the present mixed-spin
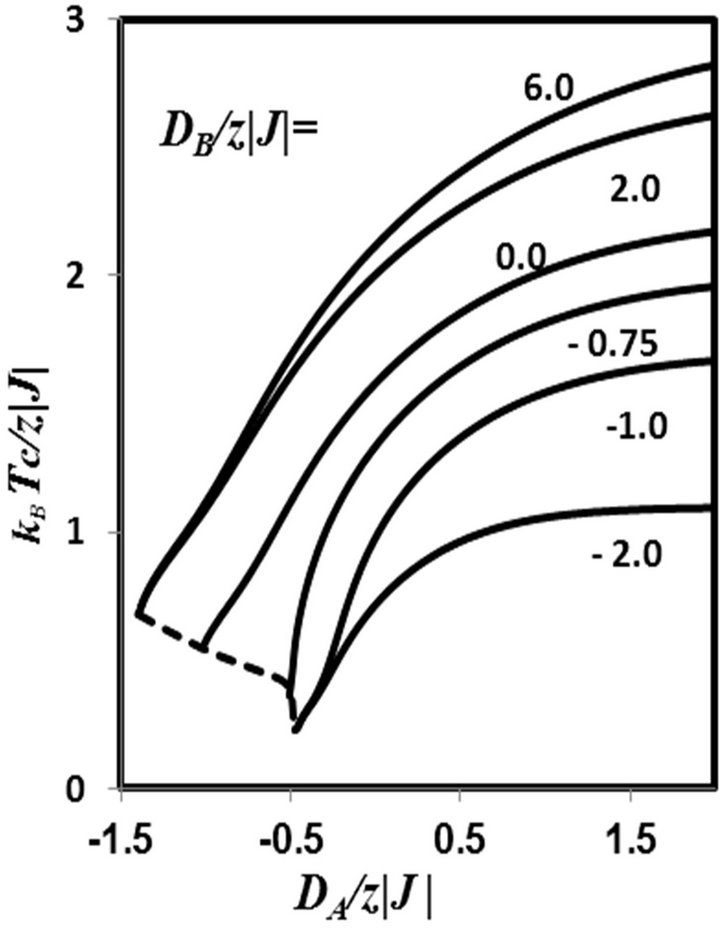
Figure 3. Phase diagram in the (DB, T) plane for the mixedspin Ising ferrimagnet with the coordination number z, when the value of DA/z|J| is changed. The solid lines indicate second-order phase transitions and the dashed line represents the positions of tricritical points.
Ising ferrimagnetic system may exhibit a compensation point (or points) at  when the single-ion anisotropies are changed. The variation of the compensation temperature
  as a function of
  for different values of
  is shown in Figure 4.
As seen from Figures 4(a) and (b), all the curves emerge from the point  at T = 0 K and exhibit some characteristic behaviours when the value of
  is controlled.
By selecting the appropriate values of  and. as
  is reduced, the range of
  over which the compensation points occurs gradually becomes small, but the compensation temperature still reaches the corresponding transition line.
When the values of  are selected (Figure 4(a)) the curves increase monotonically with
  to terminate at the corresponding phase boundaries (solid lines).
As shown in Figure 4(b), in a restricted region of , close to
 , the compensation temperature curves exhibit bulges, which implies the occurrence of two and three compensation points in the system.
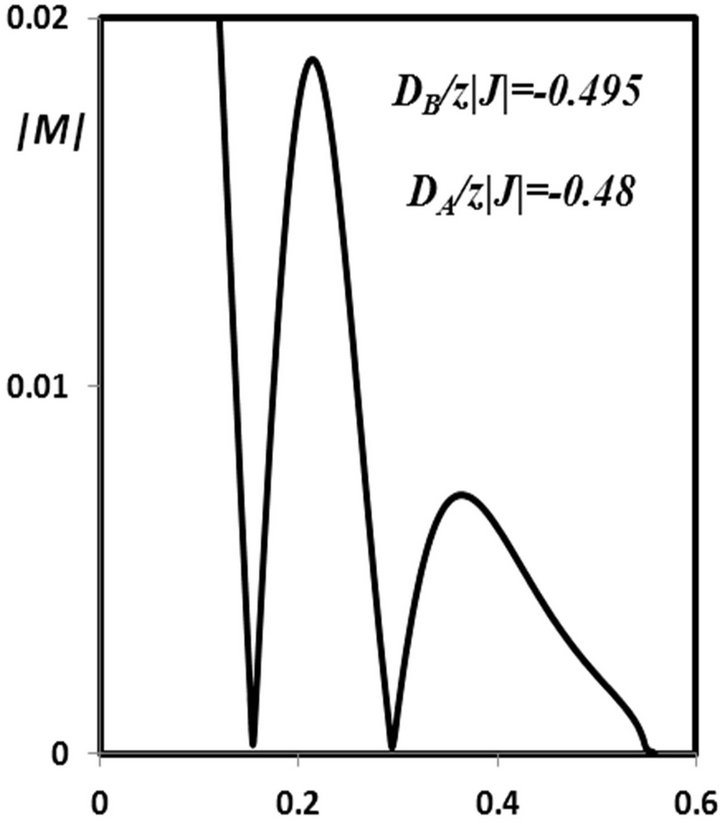
Typical sublattice magnetization curves, with one compensation point, two compensation points and three compensation points are shown in Figures 5(a)-(c), respectively, for selected values of  and
and . It is easy to see that these compensation points in the magnetization curves are in agreement with the compensation points given in Figure 4.
4. Conclusion
In this paper, we have determined the global phase dia-
 (a)
(a)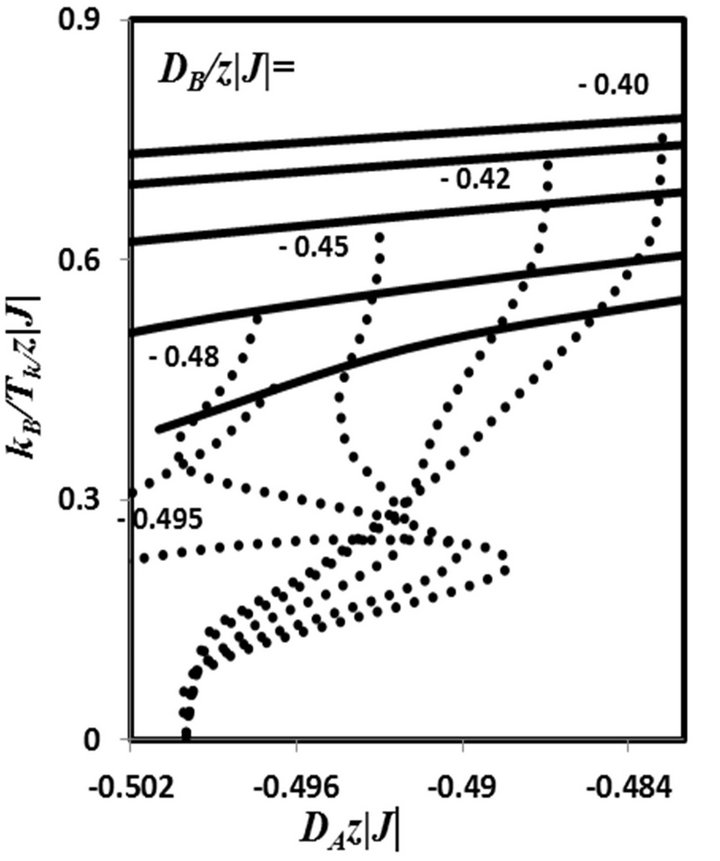 (b)
(b)
Figure 4. Dependence of the compensation temperature (dotted curves) on the single-ion anisotropy. DA/z|J| in a mixed-spin Ising ferrimagnet with the coordination number z, when the value of DB/z|J| is changed. (a) The curves show the positions of one compensation points only; (b) The curves show the positions of one, two and three compensation points. The solid curves represent the second-order transitions.
grams of the mixed spin-3/2 and spin-2 Ising ferrimagnetic system with different single-ion anisotropies acting on the spin-3/2 and spin-2 by using mean-field approximation. In the phase diagrams, the critical temperature lines versus single-ion anisotropies are shown. The system presents tricritical behaviour, i.e., the second-order phase transition line is separated from the first-order transition line by a tricritical point. We also observed that this mixed-spin ferrimagnetic system may exhibit one, two or three compensation points. The theoretical prediction of the possibility of compensation points and the design and preparation of materials with such unusual behaviour will certainly open a new area of research on
 (a)
(a) (b)
(b)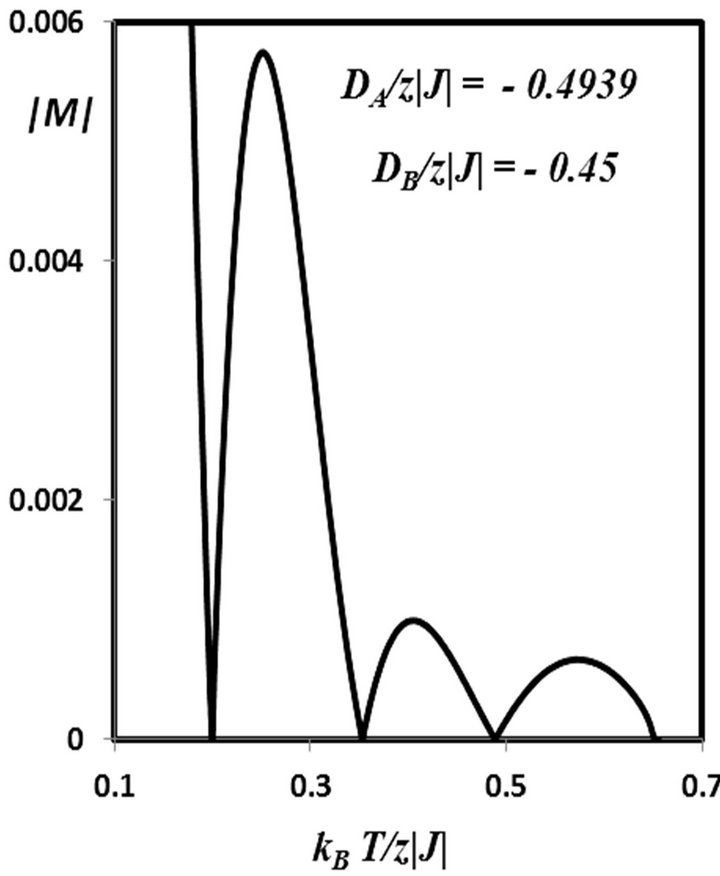 (c)
(c)
Figure 5. Thermal variations of the total magnetization |M| for the mixed-spin Ising ferrimagnet with the coordination number z. (a) When the value of DB/z|J| = 1.0 and DA/z|J| = −0.35 (to show one compensation point); (b) When the value of DB/z|J| = −0.48 and DA/z|J| = −0.495 (to show two compensation points); (c) When the value of DB/z|J| = −0.45 and DA/z|J| = −0.4939 (to show three compensation points).
such materials.
REFERENCES
- O. Khan, “Molecular Magnetism,” VCH Publishers, New York, 1993.
- T. Kaneyoshi and Y. Nakamura, “A Theoretical Investigation for Low-Dimensional Molecular-Based Magnetic Materials,” Journal of Physics: Condensed Matter, Vol. 10, No. 13, 1998, p. 3003. doi:10.1088/0953-8984/10/13/017
- T. Kaneyoshi, Y. Nakamura and S. Shin, “A Diluted Mixed Spin-2 and Spin-5/2 Ferrimagnetic Ising System; a Study of a Molecular-Based Magnet,” Journal of Physics: Condensed Matter, Vol. 10, No. 31, 1998, p. 7025. doi:10.1088/0953-8984/10/31/018
- L. L. Goncaloves, “Uniaxial Anisotropy Effects in the Ising Model: An Exactly Soluble Model,” Physica Scripta, Vol. 32, No. 3, 1985, p. 248. doi:10.1088/0031-8949/32/3/012
- L. L. Goncaloves, “Uniaxial Anisotropy Effects in the Ising Model: An Exactly Soluble Model,” Physica Scripta, Vol. 33, No. 2, 1986, p. 192. doi:10.1088/0031-8949/33/2/018
- A. Dakhama and N. Benayad, “On the Existence of Compensation Temperature in 2d Mixed-Spin Ising Ferrimagnets: An Exactly Solvable Model,” Journal of Magnetism and Magnetic Materials, Vol. 213, No. 1-2, 2000, pp. 117-125. doi:10.1016/S0304-8853(99)00606-X
- N. R. da Silva and S. R. Salinas, “Mixed-Spin Ising Model on Beth Lattice,” Physical Review, Vol. 44, No. 2, 1991, pp. 852-855. doi:10.1103/PhysRevB.44.852
- J. W. Tucker, “The Ferrimagnetic Mixed Spin-1/2 and Spin-1 Sing System,” Journal of Magnetism and Magnetic Materials, Vol. 195, No. 3, 1999, pp. 733-740. doi:10.1016/S0304-8853(99)00302-9
- T. Kaneyoshi and J. C. Chen, “Mean-Field Analysis of a Ferrimagnetic Mixed Spin System,” Journal of Magnetism and Magnetic Materials, Vol. 98, No. 1-2, 1991, pp. 201-204. doi:10.1016/0304-8853(91)90444-F
- T. Kaneyoshi, “Curie Temperatures and Tricritical Points in Mixed Ising Ferromagnetic Systems,” The Physical Society of Japan, Vol. 56, 1987, pp. 2675-2680. doi:10.1143/JPSJ.56.2675
- T. Kaneyoshi, “Phase Transition of the Mixed Spin System with a Random Crystal Field,” Physica A, Vol. 153, No. 3, 1988, pp. 556-566. doi:10.1016/0378-4371(88)90240-3
- T. Kaneyoshi, M. Jascur and P. Tomczak, “The Ferrimagnetic Mixed Spin-1/2 and Spin-3/2 Ising System,” Journal of Physics: Condensed Matter, Vol. 4, No. 49, 1992, pp. L653-L658. doi:10.1088/0953-8984/4/49/002
- T. Kaneyoshi, “Tricritical Behavior of a Mixed Spin-1/2 and Spin-2 Ising System,” Physica A, Vol. 205, No. 4, 1994, pp. 677-686. doi:10.1016/0378-4371(94)90229-1
- A. Bobak and M. Jurcisin, “Discussion of Critical Behaviour in a Mixed-Spin Ising Model,” Physica A, Vol. 240, No. 3-4, 1997, pp. 647-656. doi:10.1016/S0378-4371(97)00044-7
- S. G. A. Quadros and S. R. Salinas, “RenormalizationGroup Calculations for a Mixed-Spin Ising Model,” Physica A: Statistical Mechanics and Its Applications, Vol. 206, No. 3-4, 1994, pp. 479-496.
- G.-M. Zhang and C.-Z. Yang, “Monte Carlo Study of the Two-Dimensional Quadratic Ising Ferromagnet with Spins S = 1/2 and S = 1 and with Crystal-Field Interactions,” Physical Review B, Vol. 48, No. 13, 1993, pp. 9452-9455. doi:10.1103/PhysRevB.48.9452
- G. M. Buendia and M. A. Novotny, “Numerical Study of a Mixed Ising Ferrimagnetic System,” Journal of Physics: Condensed Matter, Vol. 9, No. 27, 1997, pp. 5951-5964. doi:10.1088/0953-8984/9/27/021
- G. M. Buendia and J. A. Liendo, “Monte Carlo Simulation of a Mixed Spin-1/2 and Spin-3/2 Ising Ferrimagnetic System,” Journal of Physics: Condensed Matter, Vol. 9, No. 25, 1997, pp. 5439-5448. doi:10.1088/0953-8984/9/25/011
- Bobak, “The Effect of Anisotropies on the Magnetic Properties of a Mixed Spin-1 and Spin-3/2 Ising Ferrimagnetic System,” Physica A, Vol. 258, No. 1-2, 1998, pp. 140-156. doi:10.1016/S0378-4371(98)00233-7
- O. F. Bobak and D. H. Abubrig, “An Effective-Field Study of the Mixed Spin-1 and Spin-3/2 Ising Ferrimagnetic System,” Journal of Magnetism and Magnetic Materials, Vol. 246, No. 1-2, 2002, pp. 177-183. doi:10.1016/S0304-8853(02)00048-3
- O. F. Abubrig, D. Horvath, A. Bobak and M. Jascur, “Mean-Field Solution of the Mixed Spin-1 and Spin-3/2 Ising System with Different Single-Ion Anisotropies,” Physica A, Vol. 296, No. 3-4, 2001, pp. 437-450. doi:10.1016/S0378-4371(01)00176-5
- J. W. Tucker, “Mixed Spin-1 and Spin-3/2 Blume-Capel Ising Ferromagnet,” Journal of Magnetism and Mgnetic Materials, Vol. 237, No. 2, 2001, pp. 215-224. doi:10.1016/S0304-8853(01)00691-6
- Y. Nakamura and J. W. Tucker, “Monte Carlo study of a Mixed Spin-1 and Spin-3/2 Ising Ferromagnet,” IEEE Transactions on Magnetics, Vol. 38, No. 5, 2002, pp. 2406-2408. doi:10.1109/TMAG.2002.803598
- A. Bobak and J. Dely, “Phase Transitions and Multicritical Points in the Mixed Spin-3/2 and Spin-2 Ising System with a Single-Ion Anisotropy,” Journal of Magnetism and Magnetic Materials, Vol. 310, No. 2, 2007, pp. 1419- 1421. doi:10.1016/j.jmmm.2006.10.427
- E. Albayrak, “The Critical and Compensation Temperatures of the Mixed Spin-3/2 and Spin-2 Ising Model,” Physica B: Condensed Matter, Vol. 391, No. 1, 2007, pp. 47-53. doi:10.1016/j.physb.2006.08.045
- Deviren, E. Kantar and M. Keskin, “Magnetic Properties of a Mixed Spin-3/2 and Spin-2 Ising Ferrimagnetic System within the Effective-field Theory,” Journal of the Korean Physical Society, Vol. 56, No. 6, 2010, pp. 1738- 1747. doi:10.3938/jkps.56.1738
- H. J. Williams, R. C. Sherwood, F. G. Foster and E. M. Kelley, “Magnetic Writing on Thin Films of MnBi,” Journal of Applied Physics, Vol. 28, No. 10, 1957, p. 1181. doi:10.1063/1.1722603