American Journal of Analytical Chemistry
Vol.5 No.4(2014), Article ID:44000,12 pages DOI:10.4236/ajac.2014.54035
Liquid Chromatography Tandem Mass Spectrometry Method for Determination of Anti-Diabetic Drug Repaglinide in Human Plasma
Manar K. Fayyad1, Ezzeldeen H. Ghanem2
1Department of Chemistry, University of Jordan, Amman, Jordan
2Bioanalytical Laboratory, International Pharmaceutical Research Center, Amman, Jordan
Email: m.fayyad@ju.edu.jo
Copyright © 2014 by authors and Scientific Research Publishing Inc.
This work is licensed under the Creative Commons Attribution International License (CC BY).
http://creativecommons.org/licenses/by/4.0/


Received 29 January 2014; revised 3 March 2014; accepted 12 March 2014
ABSTRACT
A highly sensitive, accurate and rapid analytical method based on reversed-phase liquid chromatography/electrospray ionization tandem mass spectrometry (RP-LC-ESI-MS/MS) has been developed and validated for the determination of repaglinide in human plasma using cetirizine as an internal standard (IS). The method was validated over a linear range of 0.5 - 100 ng/ml. After addition of IS, analytes were extracted from the plasma samples by liquid-liquid extraction using tert-butyl methyl ether as. The dried residue was reconstituted with 500 μL of mobile phase consisting of water/methanol/acetonitrile (62.5:20:17.5, v/v/v) and 0.2% formic acid. Chromatographic separations were achieved on a C18 analytical column. The analytes were detected with a triple quadrupole mass spectrometer using turbo V® ion spray source with positive ionization in multiple reaction monitoring (MRM) mode using MRM transitions m/z 453.3 > 162.2 and m/z 389.0 > 201.1 for the drug and IS, respectively. The proposed method was fully validated in terms of linearity, accuracy, precision, specificity, sensitivity, recovery and stability, giving results within the acceptable range. This method was successfully applied for a large number of authentic human plasma samples from a bioequivalence study.
Keywords:Repaglinide; LC-MS/MS; Human Plasma; Bioequivalence

1. Introduction
Repaglinide,(S)-2-Ethoxy-4-[2-[[3-methyl-1-[2-(1-piperidinyl)phenyl]butyl]amino]-2-oxoethyl]benzoic acid, is a novel, fast-acting, oral anti-diabetic agent derived from carbamoylmethyl benzoic acid. It is used in the treatment of type 2 diabetes mellitus which is also known as non-insulin dependent diabetes mellitus NIDDM [1] .
Several analytical methods for the quantitative determination of repaglinide in pure as well as pharmaceutical formulations were reported [2] -[6] , but there are a limited number of analytical methods describing the determination of repaglinide in biological samples [7] -[9] . One method is based on electrochemical detection [7] and another is based on UV detection [8] after HPLC separations. Both methods suffer from low sensitivity (2.5 - 5 ng/ml) and relatively long run time.
An analytical method for the analysis of repaglinide in equine plasma using liquid chromatography coupled with tandem mass spectrometry has also been reported with a limit of detection of 1 ng/ml [9] . This method is more sensitive than the previously mentioned methods, but it was used only for screening purposes of 10 anti-diabetic drugs in horseracing without quantitative determination. So far, there is no reliable method reported for the analysis of repaglinide in human plasma using a hyphenated analytical technique (LC-MS/MS).
Liquid chromatography (LC) coupled to mass spectrometric (MS) detection has been used for both identification and quantification of drugs at low concentrations in various pharmaceutical formulations, in raw materials and in biological fluids [10] .
The aim of the present work is to report the development and validation of a novel analytical method for the quantitative analysis of repaglinide in human plasma using a reversed-phase liquid chromatography coupled with electrospray-tandem mass spectrometry (RP-LC-ESIMS/MS) using a simple and fast liquid-liquid extraction.
2. Experimental
2.1. Chemicals and Reagents
Repaglinide working standard was supplied by Hikma Pharmaceuticals (Jordan), while cetirizine (IS) working standard was supplied by Pharma International Company (Jordan). HPLC-grade acetonitrile, methanol, tertbutyl methyl ether, formic, and acetic acid were purchased from Merck (Germany). All other chemicals used were of pharmaceutical or special analytical grade.
For all the analyses, ultrapure water (MilliQ®, Millipore, USA) filtered through a 0.2 μm membrane filter was used.
2.2. Apparatus and Analytical Conditions
The RP-LC-MS/MS method was performed on an Agilent HPLC system (Agilent, USA) equipped with Agilent 1100 binary pump, Agilent 1100 membrane degasser, Agilent 1100 column compartment, and Agilent 1100 thermostatted well-plate sampler. The peak areas were integrated automatically by a computer using the Analyst® 1.4.1 software program (Applied Biosystems, USA). The experiments were carried out on a reversed phase Symmetry® C18 (Waters, USA) column (50 mm × 2.1 mm I.D., with a particle size of 3.5 μm and pore size of 100 Å). The HPLC system was operated isocratically at controlled column temperature (30˚C) using a mobile phase consisting of water/ methanol/acetonitrile (62.5:20:17.5, v/v/v) and 0.2% formic acid. This was filtered through a 0.2 μm membrane filter (Millipore, USA) and run at a flow rate of 0.4 mL/min. The injection volume was 5 μL for both standards and samples. The autosampler temperature was maintained at 5˚C. The triple quadrupole mass spectrometer model API 4000 (Applied Biosystems, USA), equipped with a Turbo V® ion spray source in positive mode, was set up in multiple reaction monitoring (MRM) mode. The following transitions were monitored, m/z 453.3 > 162.2 and m/z 389.0 > 201.1, for repaglinide and IS, respectively. For the optimization of mass spectrometer conditions, a mixed standard solution (100 ng/mL) containing repaglinide and IS was directly infused into the HPLC flow by a syringe pump via a T-connector. The following parameters were selected: ion source gas 1 (nebulizer gas; nitrogen), ion source gas 2 (turbo heater gas; zero grade air) and curtain gases (high purity nitrogen) were set at 40, 40, and 15 PSI, respectively. Ion spray voltage and source temperature were 5500 V and 550˚C, respectively. The dwell time was set at 0.5 second and the collision gas pressure (high purity nitrogen) was set at 6 PSI. The declustering potential (DP) was 70 and 45 V, the entrance potential (EP) was 10 and 9 V, the collision cell exit potential (CXP) was 10 and 13 V, the collision energy was 29 and 27 eV for repaglinide and IS, respectively. Data acquisition and analysis were performed using the Analyst® software (version 1.4.1) running under Windows 2000 on a workstation Dell PC.
2.3. Standard and Quality Control Preparation
The stock solution of repaglinide was prepared by weighing 100 mg of reference material into a 100 mL volumetric flask and diluting to volume with methanol, obtaining a concentration of 1 mg/ mL. One mL of repaglinide stock solution (1 mg/mL) was further diluted into a 100 mL volumetric flask with methanol: water (1:1, v/v) to prepare repaglinide working standard solution (10 μg/mL). Cetirizine stock solution was prepared by weighing 10 mg of reference material into a 100 mL volumetric flask and diluting to volume with methanol obtaining a concentration of 0.1 mg/mL. One hundred μL of cetirizine stock solution (0.1 mg/mL) were further diluted into a 100 mL volumetric flask with water to prepare cetirizine working standard solution (100 ng/mL). The prepared stock and working solutions were stored in a freezer at −20˚C ± 5˚C. Calibration standard solutions with concentrations of 10, 20, 40, 100, 200, 400, 800, 1200, 1600, and 2000 ng/mL were prepared by diluting repaglinide working standard solution (10 μg/mL) using (50% water: 50% methanol) in 10 mL volumetric flasks. Calibration standards in plasma were prepared by diluting 500 μL of each calibration standard solution with pooled blank human plasma in 10 mL volumetric flasks to prepare the calibration standards containing 0.5, 1, 2, 5, 10, 20, 40, 60, 80 and 100 ng/mL. The quality control (QC) samples were prepared in a similar way with the concentrations of 1.5 ng/mL (low), 50 ng/mL (medium) and 85 ng/mL (high). These QC samples were then divided in aliquots and stored in a freezer at −20˚C ± 5˚C until analysis.
2.4. Sample Preparation
A total of 200 μL of the spiked plasma or authentic sample was transferred to a 10 mL glass tube followed by the addition of 100 μL of internal standard solution (100 ng/mL of cetirizine in water) and 50 μL of 0.05 M ammonium acetate buffer solution (pH: 4.5). All samples were mixed by vortex-agitation for 30 s. Then, a 6mL aliquot of the extraction solvent, tert-butyl methyl ether was added using dispenser. The tubes were vortex-mixed for 60 s, and then centrifuged for 5 min at 3200 rpm. The organic layer was transferred into another 10 mL glass tube and evaporated under a gentle stream of nitrogen gas while immersed in a water bath at 40˚C. Each sample was reconstituted with 500 μL of mobile phase and vortex-mixed for 30 s. The samples were transferred to autosampler vials, centrifuged for 5 min at 13,000 rpm, and 5 μL were injected into the LCMS/MS system.
2.5. Bioanalytical Method Validation
The method was validated for specificity, sensitivity (lower limit of quantification, LLOQ), linearity, recovery, accuracy, precision, and stability studies following USFDA guidelines [11] .
2.5.1. Specificity
Randomly selected six blank human plasma samples, which were collected under controlled conditions, were assayed applying the extraction procedure and chromatographed to determine the extent to which endogenous plasma components could interfere with the analyte or the internal standard.
2.5.2. Sensitivity (Lower Limit of Quantification, LLOQ)
The lowest standard concentration on the calibration curve is accepted as the lower limit of quantification if the following conditions are met: the analyte response at the LLOQ should be at least five times the response compared to blank response; at the same time; the analyte peak (response) should be identifiable, discrete, and reproducible with a precision of ±20% and accuracy ranging between 80% - 120%.
2.5.3. Calibration Curves
The calibration curves were constructed from a blank sample (a plasma sample processed without IS), a zero sample (a blank plasma processed with IS), and ten concentrations of repaglinide including the LLOQ, ranging from 0.5 to 100 ng/mL. The peak area ratio of the drug to the IS against the respective standard concentrations was used for plotting the graph. The linearity was evaluated by a weighted (1/concentration) least squares regression analysis. The acceptance criteria (accuracy and precision) for each back-calculated standard concentration were less than 15% deviation from the nominal values, except for the LLOQ which was less than 20%.
2.5.4. Recovery
The absolute analytical recovery was calculated by comparing chromatographic peak areas from unextracted standard samples and from extracted standard samples at three different concentrations (1.5, 50, and 85 ng/mL) for repaglinide and 50 ng/mL for the IS.
2.5.5. Accuracy and Precision
The intra-day accuracy and precision were evaluated by analyzing QC samples at three different levels in six replicates together with a calibration standard curve in the same day. The inter-day accuracy and precision were evaluated by analyzing QC samples together with a calibration standard curve over 3 days. Intraand inter-day precision was expressed as relative standard deviation (%RSD). The accuracy was expressed as the percent ratio between the experimental concentration and the nominal concentration for each sample. The evaluation of precision was based on the criteria that the deviation of each concentration level should be within ±15%, except for the LLOQ, for which it is allowed to be within ±20% [11] . Similarly for accuracy, the mean value should not deviate by more than ±15% of the nominal concentration, except for the LLOQ, where it should not deviate by more than ±20% of the nominal concentration.
2.5.6. Stability
The concentration of repaglinide after each storage period was related to the initial concentration as zero cycle (samples that were freshly prepared and processed immediately). The samples were considered stable if the deviation (expressed as percentage bias) from the fresh samples (zero cycle) was within ±15%. The stability of repaglinide was studied under the following conditions:
The freeze-thaw stability of repaglinide was determined at low and high QC samples (six replicates), over five freeze-thaw cycles within 5 days. In each cycle, the frozen plasma samples were thawed at room temperature (25˚C ± 5˚C) for 2 h and refrozen for 24 h at −20˚C ± 5˚C. After completion of the fifth cycle the samples were processed and analyzed. The results were compared with that of fresh samples (zero cycle). The short-term stability was determined by six aliquots each of the low and high unprocessed QC samples were kept on the bench top at room temperature (25˚C ± 5˚C) for 6 h under normal lighting. After 6 h the samples were processed and analyzed. The results were compared with that of fresh samples (zero cycle). The long-term stability was determined by six aliquots each of the low and high QC samples were frozen at −20˚C ± 5˚C for 29 days. The samples were processed and analyzed. The results were compared with that of fresh samples (zero cycle). The processed sample stability (autosampler) was determined by six aliquots, each of the low and high QC samples were processed and placed into the thermostatted autosampler at a temperature of 5˚C ± 2˚C. The samples were analyzed after 39 h. The results were compared with that of fresh samples (zero cycle). The processed sample stability (dry extract) was determined by two sets, six aliquots of each low and high QC samples were processed but without reconstitution (kept as dry extract after evaporating the organic solvent). One set was placed into the freezer at −20˚C ± 5˚C for 4 days; the other set was kept on the bench top at room temperature (25˚C ± 5˚C) for 1 h under normal lighting. The samples were reconstituted and analyzed. The results were compared with that of fresh samples (zero cycle).
2.5.7. Matrix Dilution Integrity
Samples of concentration higher than the upper limit of quantification (ULOQ) can be quantified by diluting the samples with a complementary volume of the same biological matrix. Thus, the resultant diluted sample can be processed and the obtained area ratio can be easily fitted to the regression equation of the calibration curve. The dilution factors of 3 and 5 were tested, and the measured concentrations were within ±15% of their nominal values.
2.6. Bioequivalence Study
To show the applicability of the developed method, plasma samples were analyzed from normal male subjects (volunteers) enrolled on a bioequivalence study of repaglinide under the following conditions: a single-dose, randomized, two-period, two-treatment, crossover-study conducted at clinical unit of the International Pharmaceutical Research Center (IPRC), Amman, Jordan, after approval of Institutional Review Board (IRB). The volunteers were screened by performing physical examination and clinical tests. The scope of the study was explained to all subjects and an informed consent form was obtained before the start of study. The subjects were divided into two groups, one group received a 2 mg repaglinide tablet as the test product (Repaglinide, Hikma Pharmaceuticals, Jordan), and the other group received a 2 mg repaglinide tablet as the reference product (Prandin®, Novo Nordisk Pharmaceuticals, USA). After administration, serial plasma samples were collected, over 12 h, in Heparin sodium tubes, and centrifuged at 3500 rpm for 10 min to separate the plasma. After liquid-liquid extraction, samples were reconstituted and then analyzed by the method described in this report.
3. Results and Discussion
3.1. Optimization of Chromatographic and Mass Spectrometric Conditions
To obtain the best chromatographic and mass spectrometric conditions for repaglinide and the internal standard taking into consideration the chemical structures of both (as shown in Figure 1), different columns and mobile phases consisting of acetonitrile-water, methanol-water and acetonitrile-methanol-water were tested to provide sufficient selectivity and sensitivity in a short separation time. Modifiers such as formic acid, acetic acid, and ammonium acetate were tested. The best signal to noise was achieved when water/methanol/acetonitrile (62.5: 20:17.5, v/v/v) and 0.2% formic acid was used as mobile phase employing a C18 analytical column and 0.4mL/min flow rate. The low flow rate and the short run time (approximately 7 min) resulted, comparatively, in lower consumption of the mobile phase solvents, faster analysis with a better cost effective relation. The protonated molecular ions (parent; precursor ions) [M + H]+ of repaglinide and IS, observed on the full scan mass spectra, were m/z 453.3 and 389.0, respectively, as shown in Figure 2. Moreover, the collision energy in Q2 produced significant fragments. The MS/MS transition 453.3 > 162.2 and 389.0 > 201.1 were selected since the fragment ion scan (daughter; product ions) with m/z 162.2 and 201.1 presented higher abundance and stability for the repaglinide and IS, respectively, as shown in Figure 3. The coupling of LC with MS/MS detection in the MRM mode showed high specificity, because only the ions derived from the analytes of interest were monitored. A small sample size (200 μL) and a small injection volume (5 μL) was used in this method, this has many benefits, e.g. a smaller amount of blood were withdrawn from the human subjects, and a larger number of samples were analyzed in one batch without the need of frequent cleaning or preventive maintenance of the LC/MS/MS system.
3.2. Selectivity and Sensitivity
Selectivity was evaluated by calculating signal of lower limit of quantification (LLOQ) to noise (blank) ratio for all the samples. Mean ratio was 25.2 and back calculated concentration obtained from calibration curves was 0.52 ± 0.04 with accuracy within 97% ± 2% and precision (CV%) less than 8. Comparison of the chromatograms of the blank (as shown in Figure 4) and spiked human plasma of 0.5 ng/mL repaglinide (as shown in Figure 5) indicated that no interferences were detected from endogenous substances. A typical chromatogram obtained by the RP-LC-ESIMS/MS method, with the resolution of the symmetrical peak corresponding to repaglinide and IS, is shown in Figure 5. The low retention times of 5.66 and 2.90 min for repaglinide and IS, respectively, allow a rapid determination of the drug, which is an important advantage for the routine analysis.
3.3. Linearity
The linearity was determined by six determinations of ten concentrations in the range of 0.5 - 100 ng/mL. The linear regression of the ratio of repaglinide/IS peak area was weighted by 1/x, where x represent the concentrations. The mean values of the correlation coefficient, the slope, and the intercept were r = 0.9988, b = 0.1687 and a = 0.0556, respectively, indicating significant linearity of the calibration curve of the method.
3.4. Accuracy and Precision
The intra-day accuracy of the method was between 89.31% and 101.77% with a precision of 3.25% - 4.36%. The inter-day accuracy was between 95.93% and 100.18% with a precision of 1.70% - 10.48%. The data show that the method possesses adequate repeatability and reproducibility. Data representing intraand inter-day (accuracy and precision) are shown in Tables 1 and 2, respectively.
3.5. Sample Extraction and Recovery
The results of liquid-liquid extraction method developed using tert-butyl methyl ether as extraction solvent with
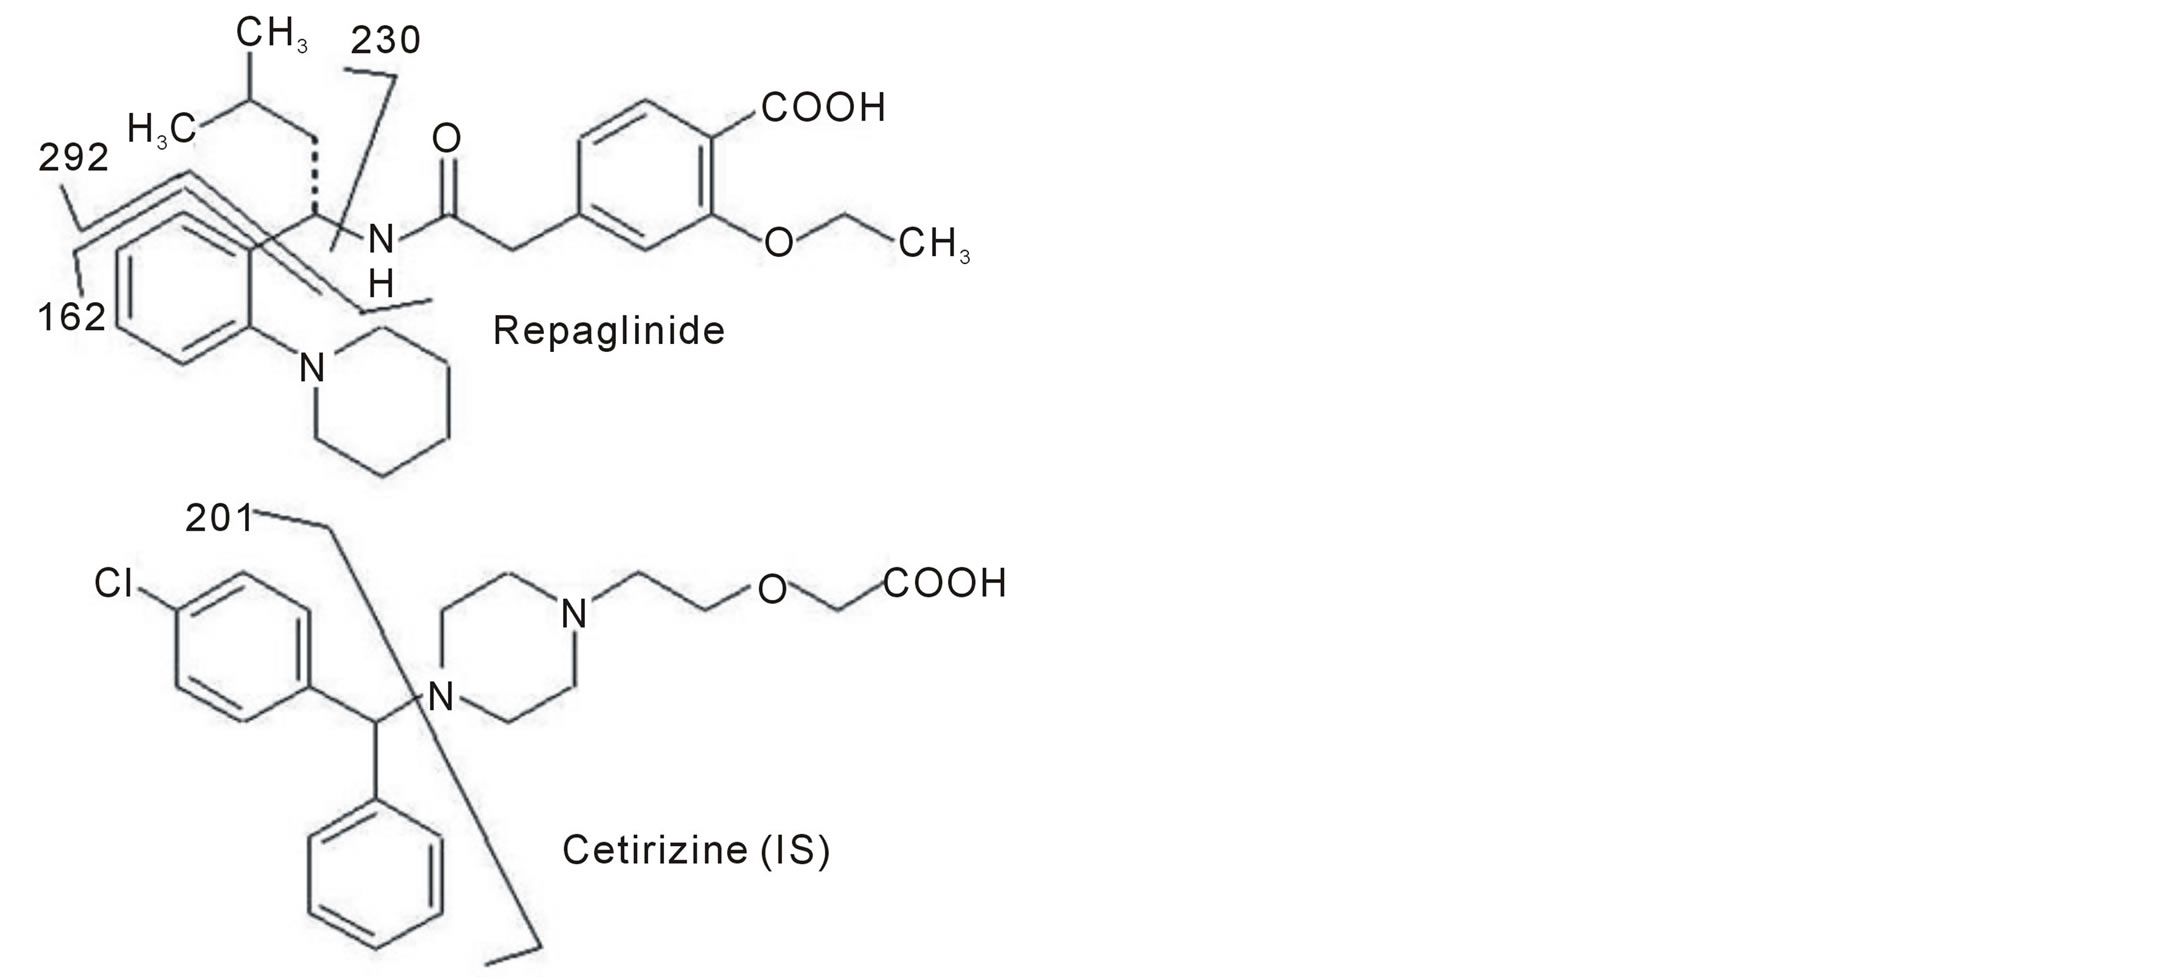
Figure 1. Structures of repaglinide and cetirizine (IS) showing major fragmentation positions.
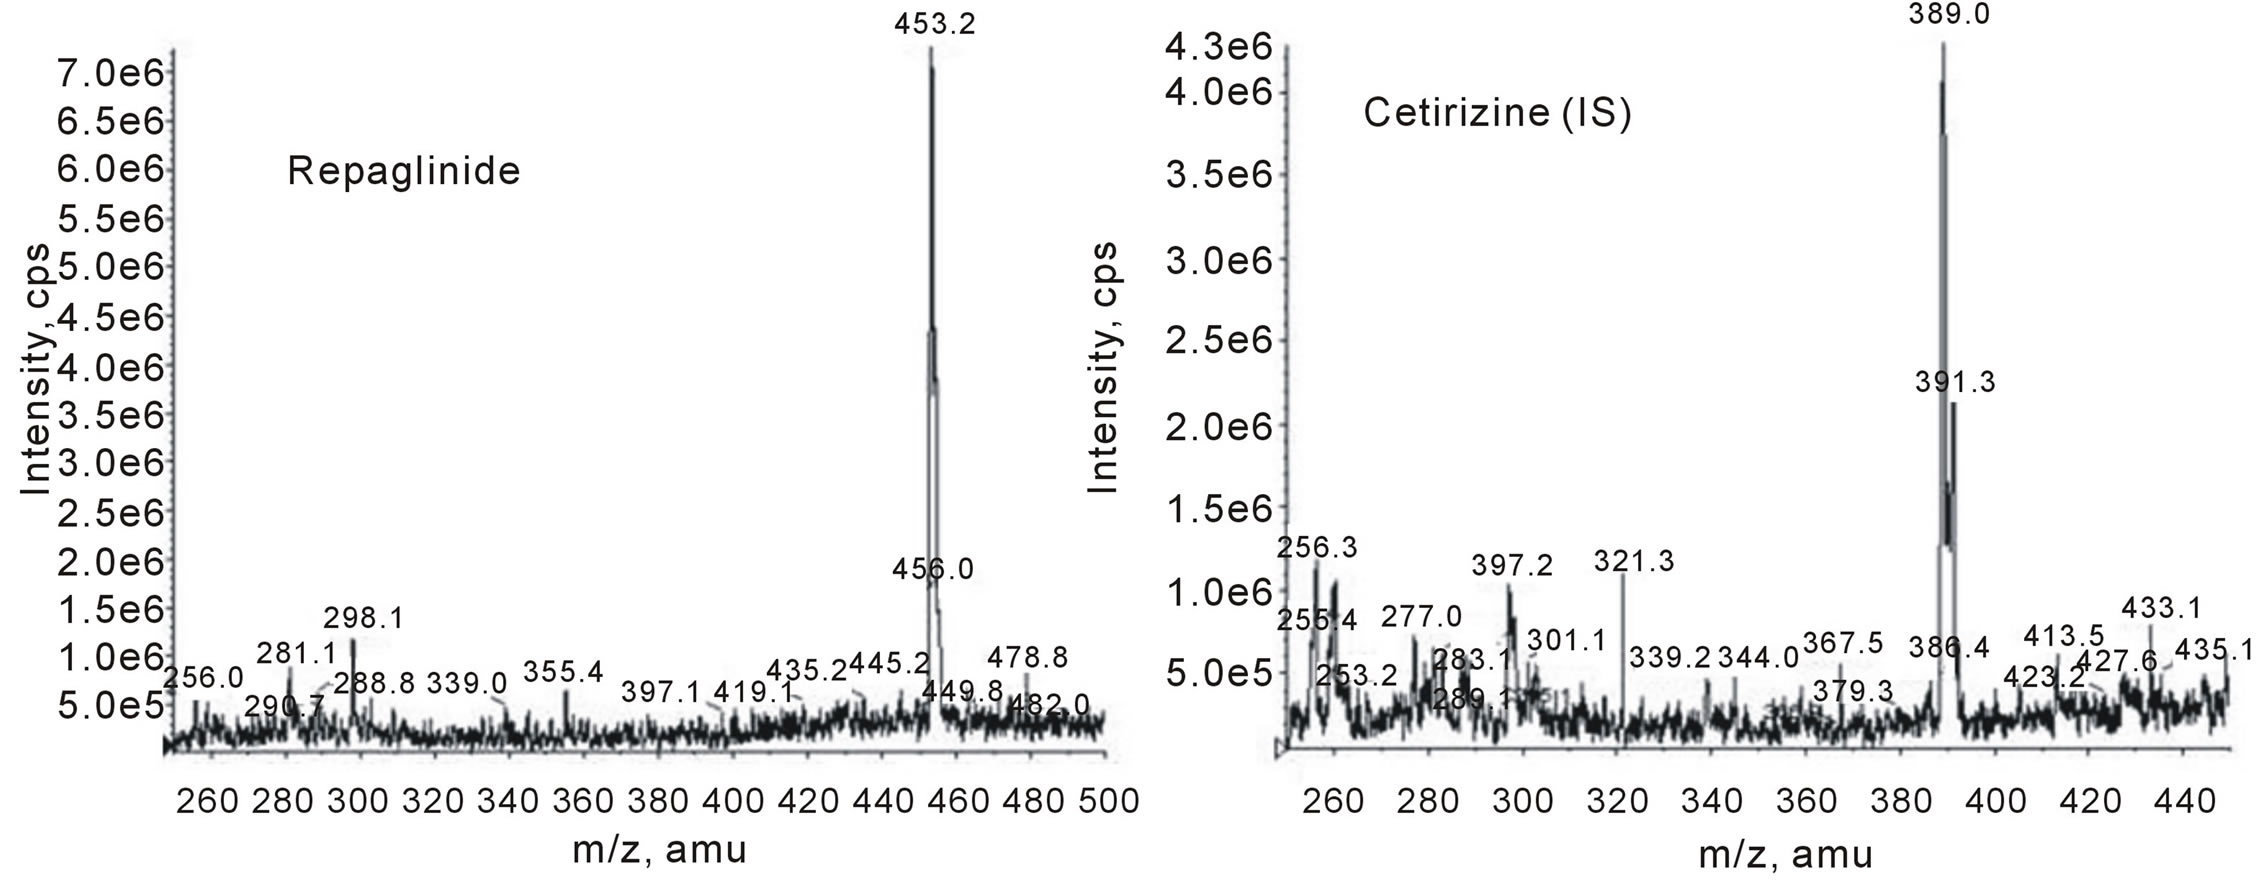
Figure 2. Full scan mass spectrum (MS1, parent ion) for repaglinide and cetirizine (IS).
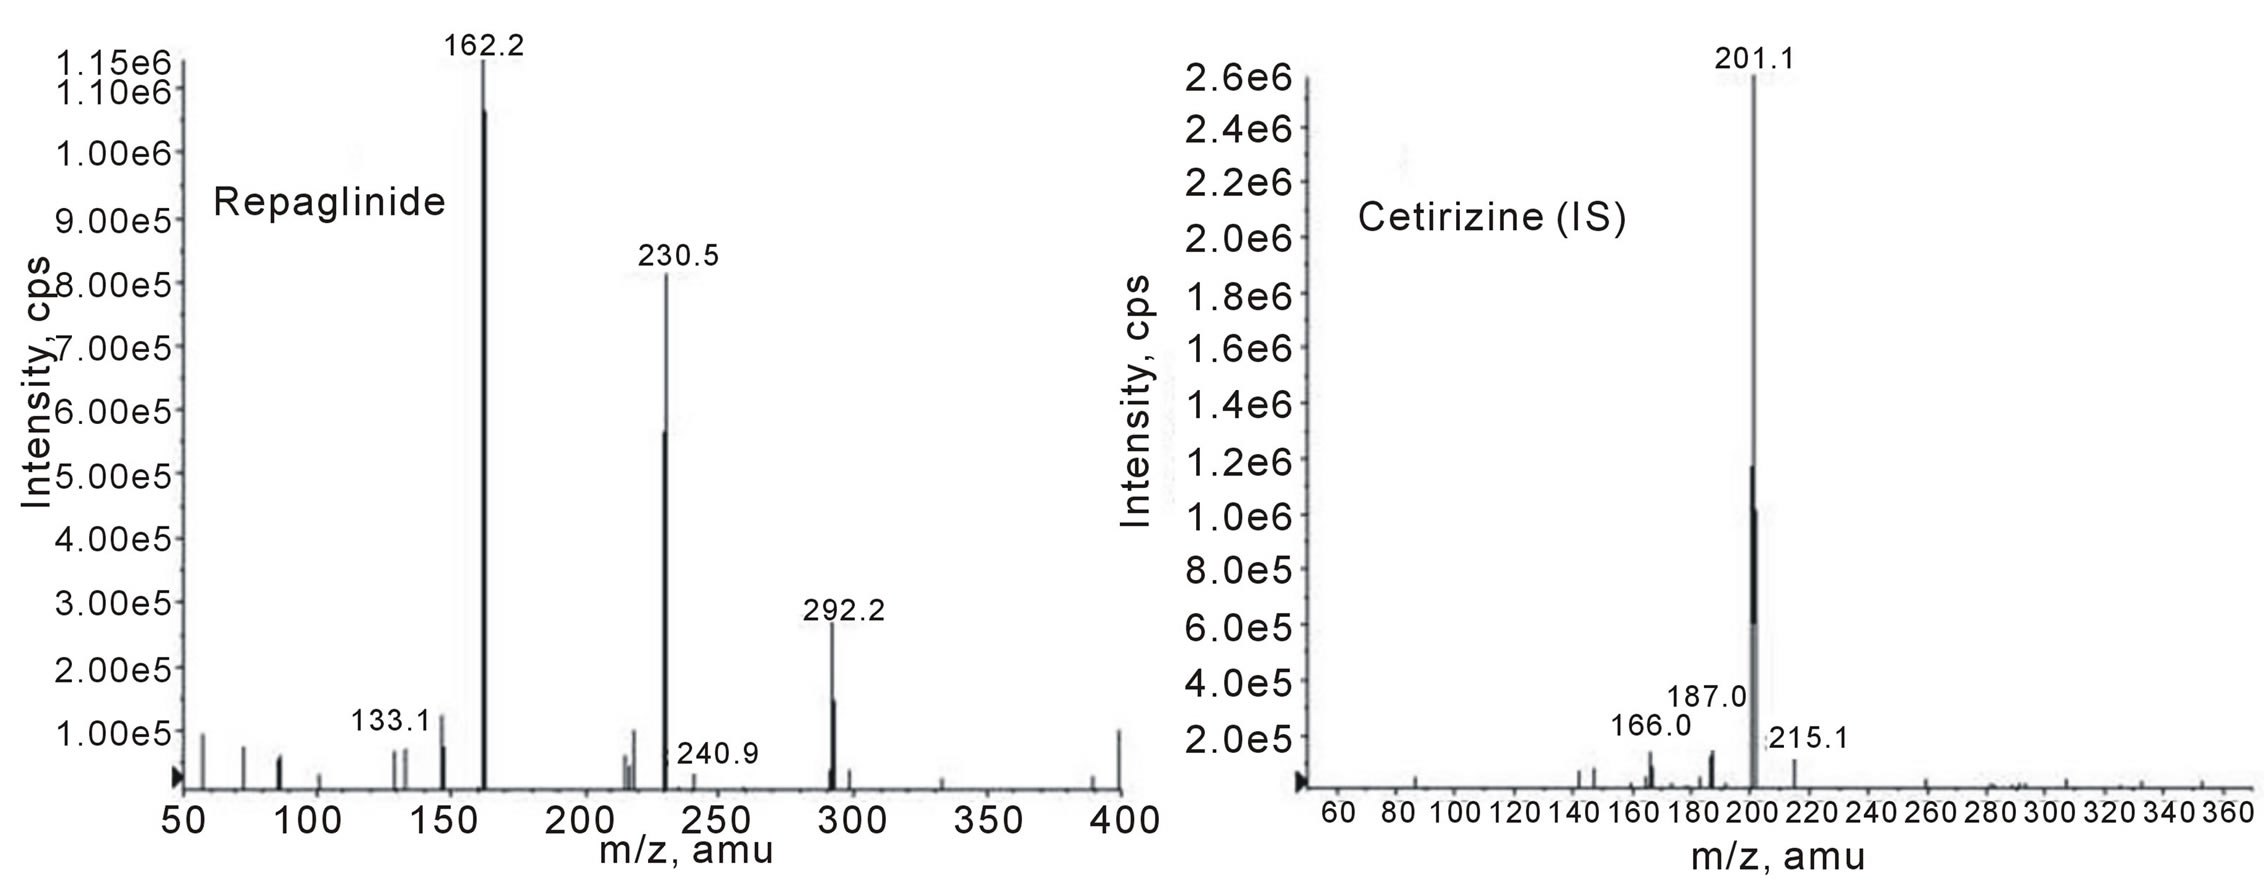
Figure 3. Product ion scan mass spectrum (MS2, daughter ions) for repaglinide and cetirizine (IS).
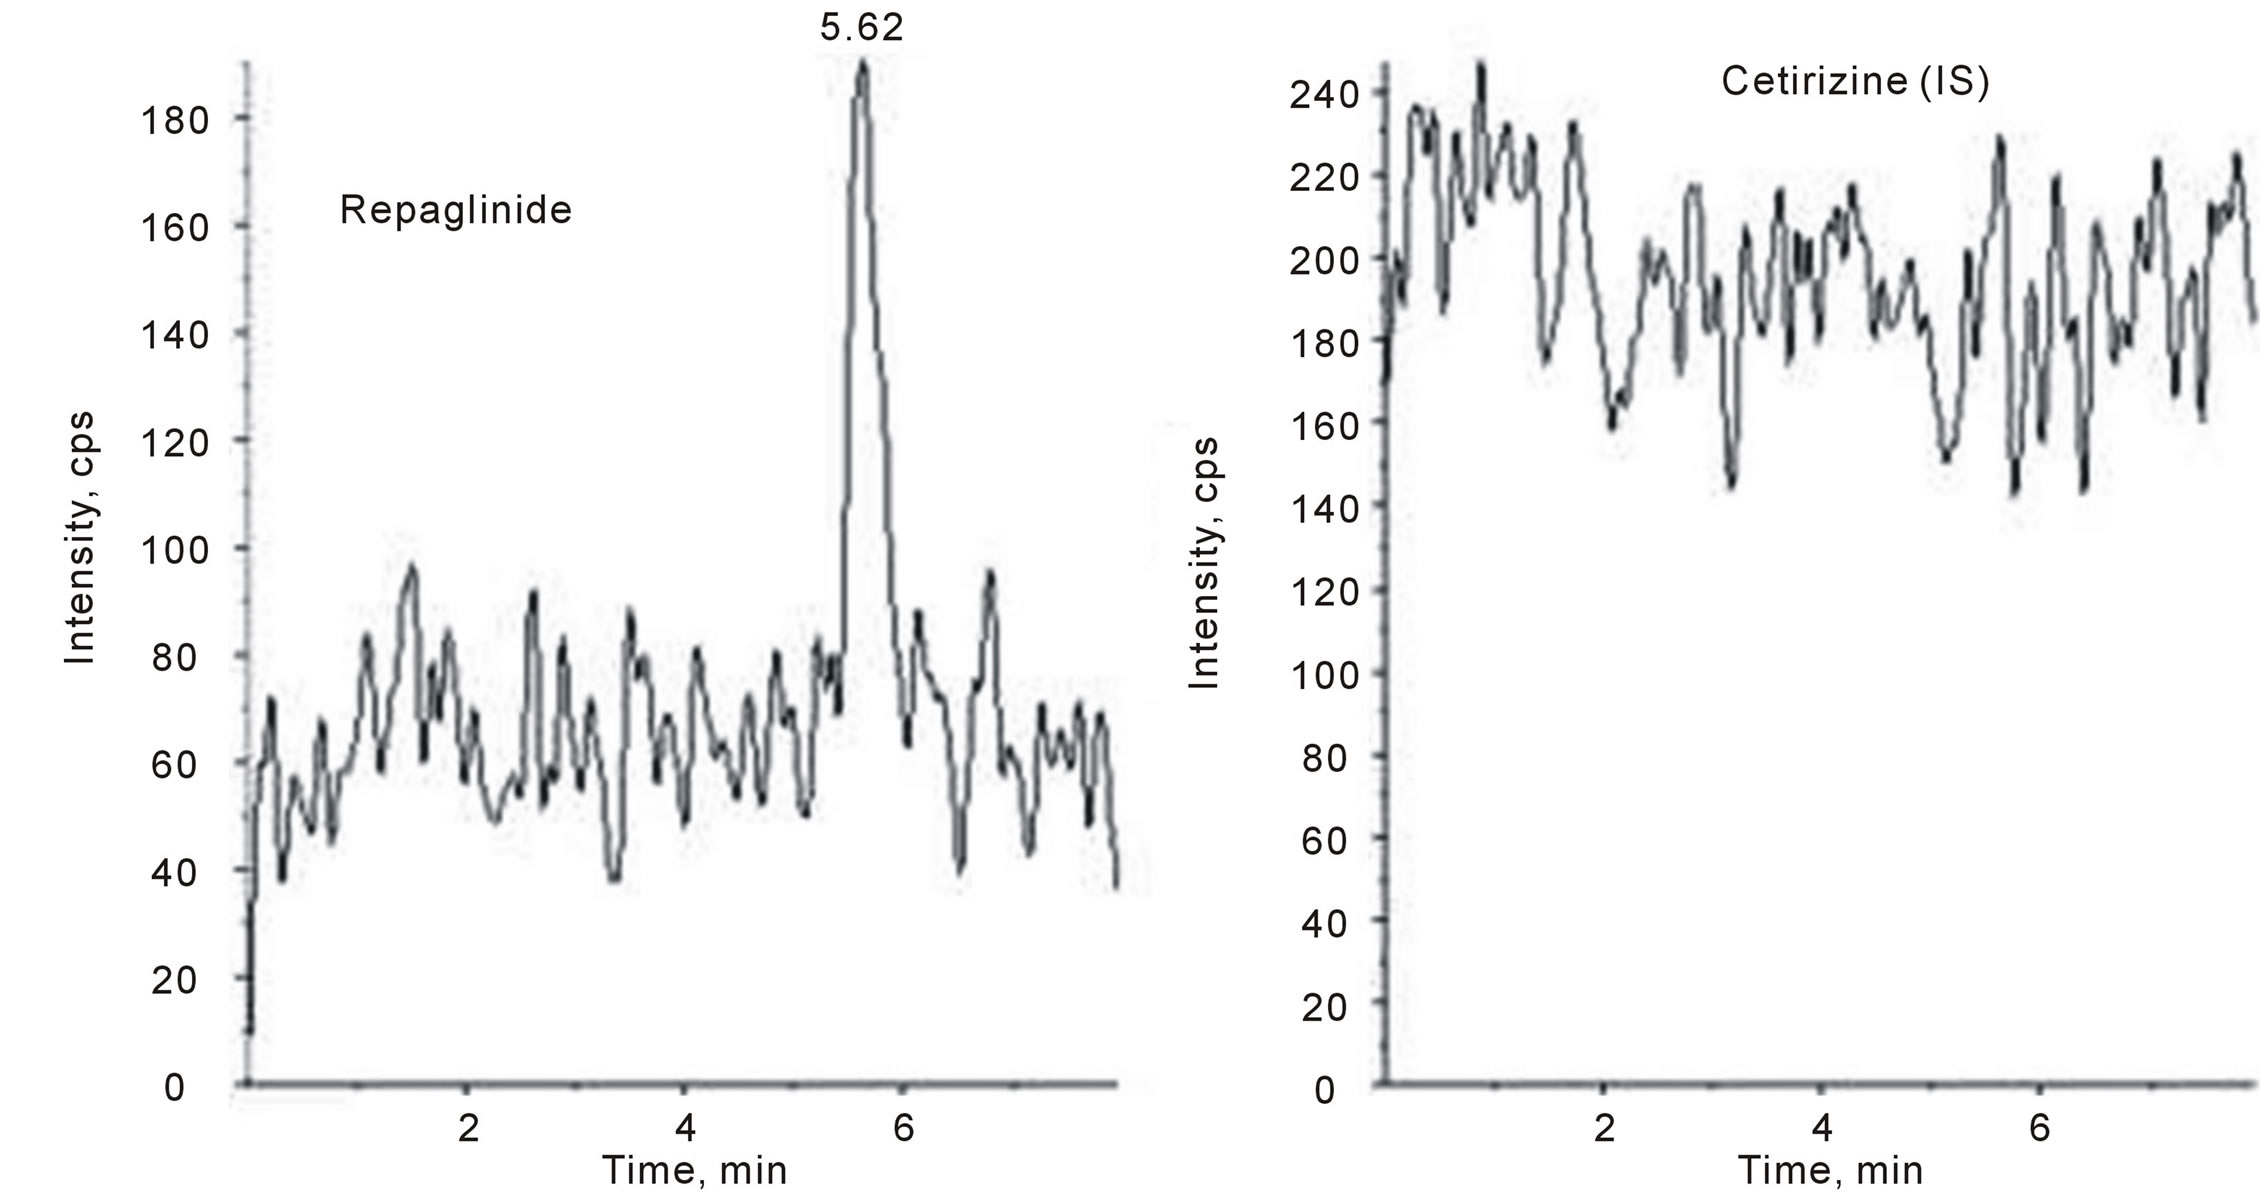
Figure 4. Representative LC-MS/MS chromatogram of blank human plasma sample.
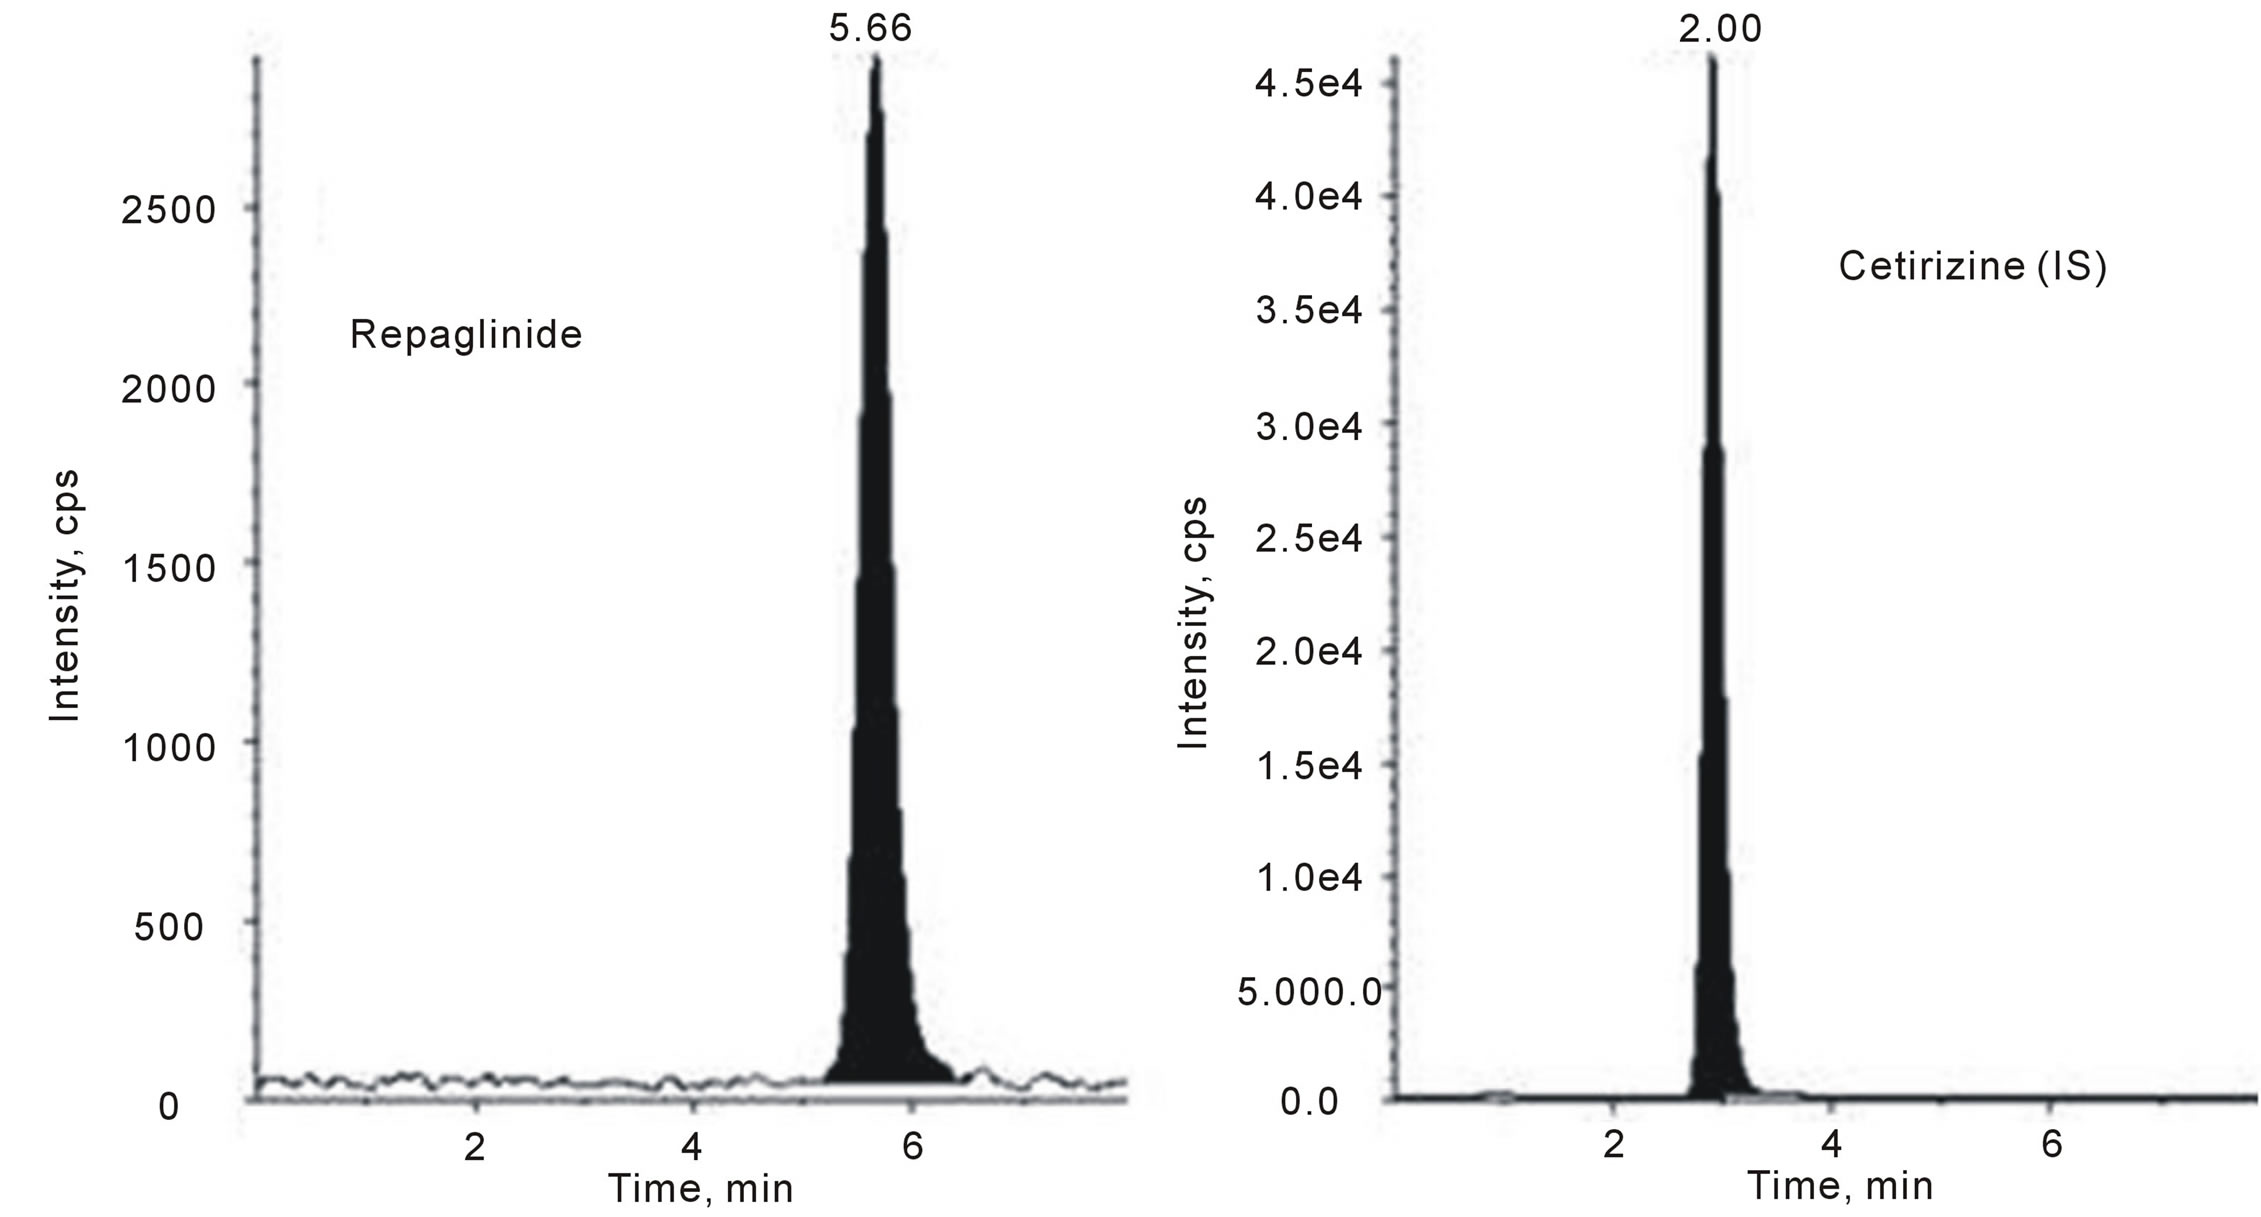
Figure 5. Representative LC-MS/MS chromatogram of lower limit of quantification (LLOQ) containing repaglinide (0.5 ng/mL) and cetirizine IS (50 ng/mL).

Table 1. Intra-day accuracy and precision for the determination of repaglinide in human plasma.
aMean of six replicates.
Table 2. Inter-day accuracy and precision for the determination of repaglinide in human plasma.
aMean of six replicates; bMean of three days.
50 μL of ammonium acetate buffer (pH: 4.5), allowed high mean recoveries of repaglinide (96.02%) and IS (80.98%) at the specified concentration levels, confirming the suitability of the method for the plasma samples. For the extraction, different organic solvents and mixtures were also evaluated, including ethyl acetate, diethyl ether, and dichloromethane. The liquid-liquid extraction described in the literature [9] showed recoveries of repaglinide in human plasma of 78.0%, lower than that reported in this present work by 18%. Data representing the absolute analytical recovery are shown in Table 3.
3.6. Stability
As shown in Table 4, the plasma samples were stable for at least 29 days at –20˚C (long term) and also after five freeze-thaw cycles, demonstrating that human plasma samples could be thawed and refrozen without compromising the integrity of the drug. Repaglinide was stable in plasma for up to 6 h at room temperature (short-term). The results demonstrated that extracted plasma samples could be kept as dry extract for 4 days in the freezer at –20˚C or for 1 h on the bench top at room temperature before analysis. The results proved that processed samples (extracted and reconstituted) could be analysed after keeping in the autosampler for at least 39 h with an acceptable precision and accuracy.
3.7. Application of the Method to Bioequivalence
The validated method was successfully applied to a bioequivalence study in thirteen human subject samples for reference and test formulations of repaglinide (2 mg) under condition of testing. A representative mean plasma concentration-time profile for repaglinide after oral administration is shown in Figure 6. The plasma concentration-time profiles of repaglinide were used to calculate various pharmacokinetic parameters by compartment independent model. AUC0-12 (area under curve from time 0 - 12 h) and AUC0-∞ (area under curve from time 0 to ∞) were calculated by linear trapezoidal method. The peak plasma concentration (Cmax) and time to reach peak (Tmax) were directly read from the individual plasma concentration-time plots. T1/2 (the time required for the quantity of the drug to decay to half of its initial value). Pharmacokinetic parameters were calculated by Kinetica® (Thermo Electron Corporation, USA) Software program. Summary of the mean values of AUC0-12, AUC0-∞, Cmax, Tmax and T1/2 are presented in Table 5.
4. Conclusion
A highly sensitive, simple and fast RP-LC-ESI-MS/MS method for the determination of repaglinide in human plasma was developed and fully validated according to the current FDA guidance. This method involves a single step liquid-liquid extraction, using cetirizine, a commercially available substance, as internal standard. The short run time of 7-min and the relatively low flow rate (0.4 mL/min) allows the analysis of a large number of samples with less mobile phase consumption. Validation results show that the optimized RP-LC-ESI-MS/MS method possesses specificity, accuracy, precision, sensitivity, linearity, recovery, and stability over the entire range of significant therapeutic plasma concentrations. The proposed method was used for the analysis of a large number of authentic plasma samples withdrawn from normal volunteers participating in a bioequivalence study per
Table 3. Recovery of repaglinide and cetirizine (IS) after the extraction procedure.
aMean of six replicates.
Table 4. Summary of stability of repaglinide in human plasma.
aMean of six replicates; bBias = (mean conc. − nominal conc./nominal conc.) × 100.
Table 5. Summary of pharmacokinetic parameters (mean) of repaglinide determined from plasma concentration-time pro- files for test and reference products.
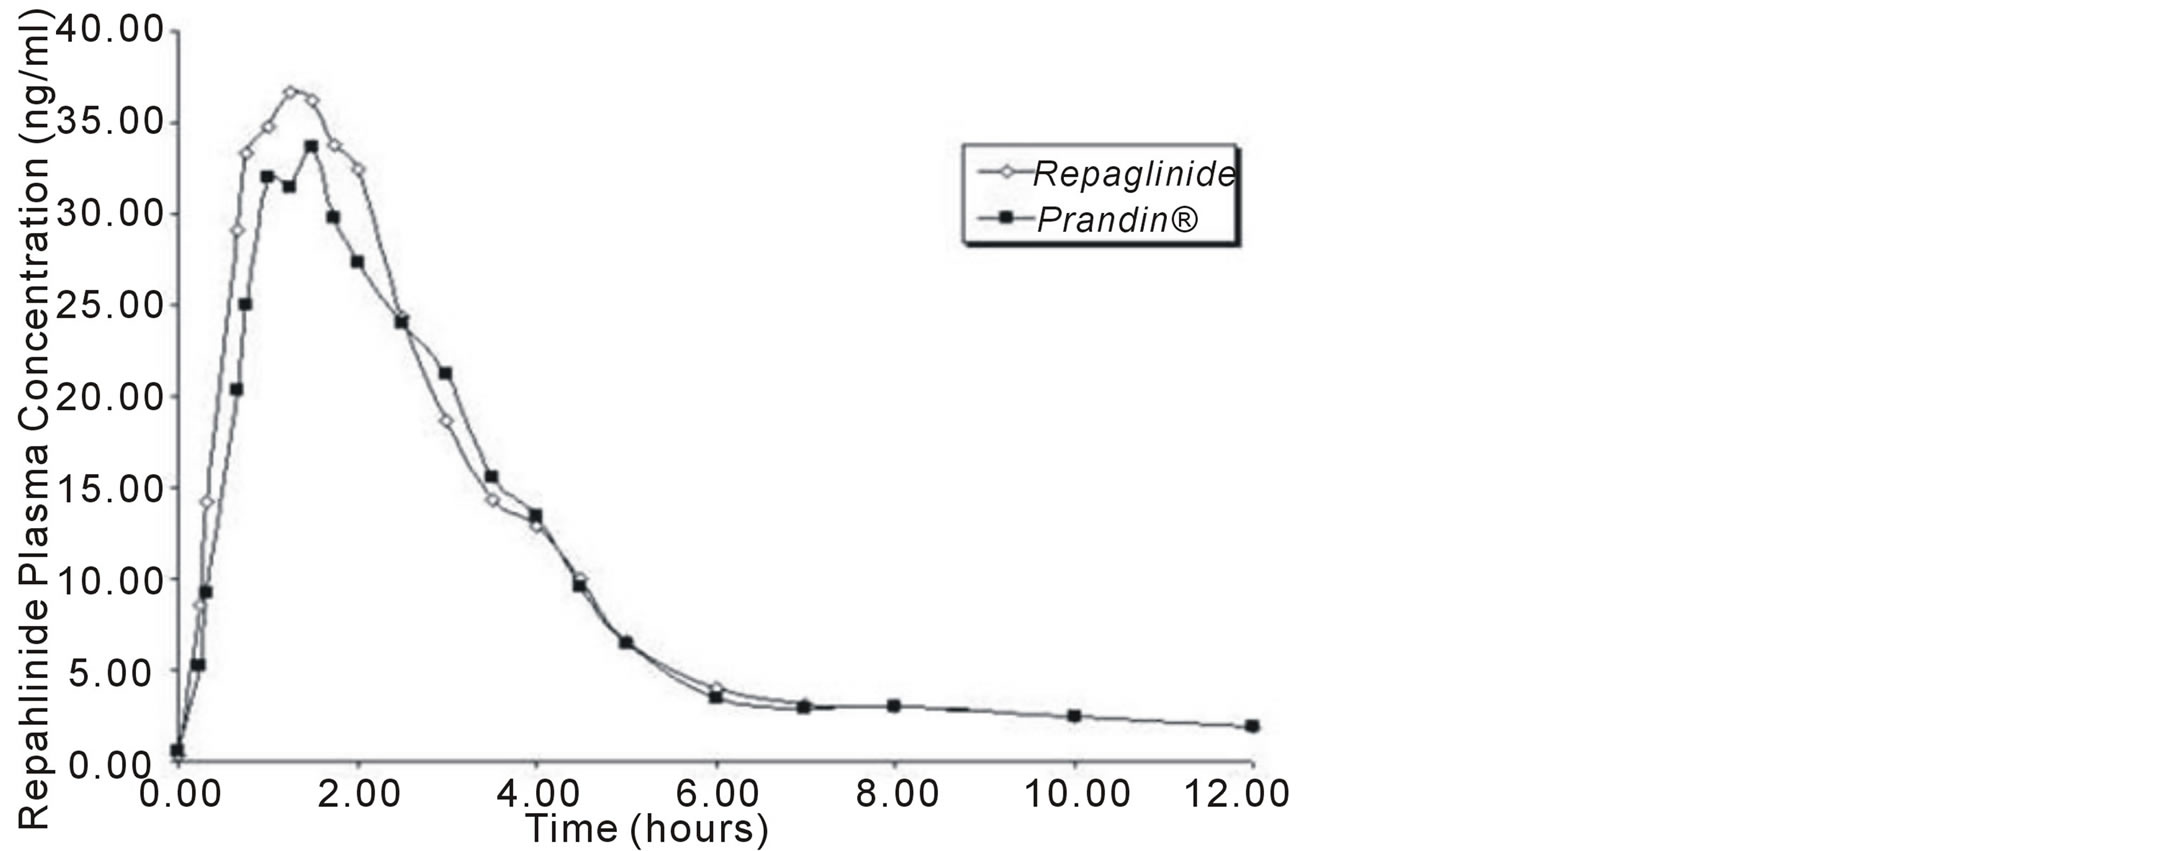
Figure 6. Representative plot showing mean plasma concentrationtime profile of 13 healthy human volunteers after the administration of an oral single dose of 2 mg tablet of repaglinide.
formed at our research center.
References
- Heiningen, P.N.M., Hartorp, V., Nielsen, K.K., Hansen, K.T., Lier, J.J., Merbel, N.C., Oosterhuis, B. and Jonkman, J.H.G. (1999) Absorption, Metabolism and Excretion of a Single Oral Dose of 14C-Repaglinide during Repaglinide Multiple Dosing. European Journal of Clinical Pharmacology, 55, 521-525. http://dx.doi.org/10.1007/s002280050667
- Sankar, D.G., Pawar, A.M., Sumanth, S.K. and Latha, P.M. (2005) Determination of Repaglinide in Pure Formulations. Asian Journal of Chemistry, 17, 2025-2027.
- Sankar, D.G., Pawar, A.M., Sumanth, S.K. and Latha, P.M. (2005) Determination of Repaglinide in Pharmaceutical Formulations. Asian Journal of Chemistry, 17, 2022-2024.
- Jain, S.K., Agrawal, G.P. and Jain, N.K. (2005) HPLC Determination of Repaglinide in Formulations Using Electrochemical Detection. Indian Journal of Pharmaceutical Sciences, 67, 249-251.
- Chaudhari, B.G., Rajput, S.J., Shah, P.B. and Shri, B.M. (2005) Determination of Repaglinide in Pharmaceutical Preparations Using HPLC Followed by UV Detrection. Indian Journal of Pharmaceutical Sciences, 67, 229-231.
- Gandhimathi, M., Ravi, T.K. and Renu, S.K. (2003) Determination of Repaglinide in Pharmaceutical Formulations by HPLC with UV Detection. Analytical Sciences, 19, 1675-1677. http://dx.doi.org/10.2116/analsci.19.1675
- Greischel, A., Beschke, K., Rapp, H. and Roth, W. (1991) Quantitation of the New Hypoglycaemic Agent AG-EE 388 ZW in Human Plasma by Automated High-Performance Liquid Chromatography with Electrochemical Detection. Journal of Chromatography B: Biomedical Sciences and Applications, 568, 246-252. http://dx.doi.org/10.1016/0378-4347(91)80360-O
- Huifang, J., Lin, X., Mingjuan, Y., Lin, Z. and Xin, H. (2001) HPLC Determination of Repaglinide in Biological Samples. Zhongguo Yaoke Daxue Xuebao, 32, 30-33.
- Ho, E.N., Yiu, K.C., Wan, T.S., Stewart, B.D. and Watkins, K.L. (2004) Detection of Anti-Diabetics in Equine Plasma and Urine by Liquid Chromatography-Tandem Mass Spectrometry. Journal of Chromatography B, 811, 65-73. http://dx.doi.org/10.1016/S1570-0232(04)00641-5
- Lee, H. (2005) Pharmaceutical Applications of Liquid Chromatography Coupled with Mass Spectrometry (LC/MS). Journal of Liquid Chromatography & Related Technologies, 28, 1161-1202. http://dx.doi.org/10.1081/JLC-200053022
- US Department of Health and Human Services, Food and Drug Administration (2001) Guidance for Industry: Bioanalytical Method Validation. Center for Drug Evaluation and Research, Rockville.