American Journal of Analytical Chemistry
Vol.3 No.12(2012), Article ID:25701,10 pages DOI:10.4236/ajac.2012.312112
Rapid LC-ESI-MS-MS Method for the Simultaneous Determination of Sitagliptin and Pioglitazone in Rat Plasma and Its Application to Pharmacokinetic Study
1Department of Pharmaceutical Analysis, National Institute of Pharmaceutical Education and Research (NIPER), Hyderabad, India
2Drug Metabolism and Pharmacokinetics Department, Incozen Therapeutics Private Limited, Hyderabad, India
Email: *ganapharma@gmail.com
Received October 12, 2012; revised November 15, 2012; accepted November 21, 2012
Keywords: Sitagliptin; Pioglitazone; LC-MS/MS; Bioanalytical Method Validation
ABSTRACT
A liquid chromatography tandem mass spectrometry (LC-MS/MS) based method was developed for the simultaneous monitoring plasma levels of Sitagliptin (STG) and Pioglitazone (PIO) for applicability to pharmacokinetic studies. The method was based on HPLC separation on the reversed phase Phenomenex Synergy C18 column (30 mm length, 4.6 mm internal diameter, and 4.0 μm particle size) at a temperature of 40˚C using a binary gradient mobile phase consisting of methanol and 2 mM ammonium acetate buffer pH adjusted to 4.5 with acetic acid, at a flow rate of 1 mL·min−1. Tolbutamide was used as an internal standard. Detection of analytes was achieved with LC-MS/MS system in Multiple Reaction Monitoring (MRM) mode. The method was validated over concentration range of 10.98 - 2091.77 ng·mL−1 for SIT and 8.25 - 1571.63 ng·mL−1 for PIO and lower limit of quantification was 10.98 ng·mL−1 and 8.25 ng·mL−1 for STG and PIO respectively. Recoveries from spiked controls were within acceptance criteria for all the analytes and internal standard at all QC levels. Within batch and between batch accuracy for STG was found within 96.9% - 100.3% and for PIO was found within 100.0% - 104.3%. Within batch and between batch precision for STG was less than 3.1% CV (coefficient of variation) and for PIO was less than 5.3% CV at all concentrations levels. This method was successfully applied to monitor pharmacokinetics profile of both STG and PIO on simultaneous oral administration to rats. This method can be applicable for pharmacokinetic drug-drug interaction studies.
1. Introduction
Sitagliptin phosphate (STG; Figure 1(a)) is chemically ((R)-4-oxo-4-[3-(trifluoromethyl)-5,6 dihydro[1,2,4]triazolo[4,3-a]pyrazin-7(8H)-yl]-1-(2,4,5-trifluorophenyl) butan-2-amine) phosphate is an anti-diabetic drug of the dipeptidyl peptidase-4 (DPP-4) inhibitor class. It works to inhibit dipeptidyl peptidase 4 (DPP-4) enzyme competitively. Pioglitazone hydrochloride (PIO; Figure 1(b)) is chemically [(±)-5-[[4-[2-(5-ethyl-2pyridinylethoxy] phenyl] methyl]-2,4-] thiazolidinedione monohydrochloride. It is a potent agonist for peroxisome proliferatoractivated receptor gamma (PPARγ). A potential novel combination in development brings together the dipeptidyl peptidase-4 (DPP-4) inhibitor STG with the thiazolidinedione Pioglitazone into a fixed-dose single-tablet combination. The former component acts mainly to increase prandial insulin secretion; the latter improves insulin sensitivity. Individual pharmacokinetic data (ADMEAbsorption, Distribution, Metabolism and Excretion) of both drugs as per the available literature [1-3] indicates that there are minor chances of pharmacokinetic drug-drug interaction between STG and PIO. Thus simultaneous prescription of STG and PIO can be proved beneficial, if there is no evidence of pharmacokinetic drug-drug interaction. As there is no data available regarding drug-drug interaction between STG and PIO, there is scope to study pharmacokinetic drug-drug interaction between beneficially looking antidiabetic drugs STG and PIO. Literature survey reveals that there are various methods like UV [4,5], HPTLC [6] and HPLC [7-9] for estimation of STG and PIO alone and methods like HPLC [10], HPTLC [11] and UV [12] for simultaneous estimation in combination with other drugs in various dosage forms. But a bioanalytical method for simultaneous estimation of STG and PIO was not reported till now. Therefore the main objective of this present work is to develop and validate a bioanalytical method for simultaneous estimation of STG and PIO in rat plasma by LC-MS/MS [13,14]. The advantages of LC-MS/MS system are performing multiple reaction monitoring (MRM) for detection of individual species from a complex mixture, Characterization and quantitation of metabolites more quickly and easily. The positive ion electrospray ionization (ESI) mode selected for the present study gave high and consistent results for both analytes. The analytes and internal standard Tolbutamide (IS; Figure 1(c)) were well separated with minimum matrix interference in a chromatographic runtime of 5 min.
2. Experimental
2.1. Materials
Sitagliptin (STG) was kindly provided by Dr. Reddys Ltd. India and Pioglitazone (PIO) was kindly provided by Aurobindo Pharma, Hyderabad India. Tolbutamide (IS) was purchased from Sigma-Aldrich, India. HPLC grade Acetonitrile, Methanol, Acetic acid, Formic acid and Ammonium acetate-GR were purchased from Merck. Milli-Q water was obtained using Milli-Q system (Millipore, Billerica, MA). Other chemicals and solvents were of analytical grade. Matrix used in the present study consists of Wistar Rat plasma (with Na2-EDTA as anticoagulant). Blank plasma was obtained from the six rats of animal house facility of Incozen Therapeutics Pvt. Ltd. after IAEC (Institutional Animal Ethics Committee) approval.
2.2. LC-MS-MS Instrumentation and Analytical Conditions
The HPLC system (Shimadzu, Kyoto, Japan) consisted of a binary LC-20ADvp pump, an autosampler (Model SIL-20AC HTc), an on-line degasser (DGU-20A), and a temperature controller compartment for column (CTO- 10Avp). LC was performed on a phenomenex Synergy C18 analytical column (30 mm length, 4.6 mm internal diameter, and 4.0 μm particle size) and was maintained at 40˚C in column oven. A gradient mobile phase system consisting of (A) 2 mM Ammonium acetate buffer pH adjusted to 4.5 with glacial acetic acid, (B) Methanol employing the gradient programme as shown in Table 1. The flow rate of the mobile phase was maintained at 1mL·min−1. The samples were stored at 15˚C in an autosampler prior to injection and the injection volume was set at 10 μL. The retention times for STG, PIO and IS were 2.53, 2.81 and 2.50 min, respectively, with a total chromatographic run time of 5 min. Mass spectrometric conditions and detection parameters are as shown in Table 2. MRM mode was used to quantitate selected precursor (M)+ ® product ions transitions at m/z 408.14 ® 127.01 for STG; m/z 357.3 ® 119.05 for PIO; and m/z 271.14 ® 155.00 for IS. The selected product ion spectrum for STG and PIO is presented in Figures 2(A) and (B) respectively.
2.3. Standard and Quality Control Sample Preparation
Primary standard stock solutions of STG, PIO and IS were prepared in methanol with a final concentration of 10 mg·mL−1 and 1 mg·mL−1 respectively. The IS stock solution was diluted to achieve a final concentration of 250 ng·mL−1 with the diluent methanol. These solutions were stored at 2˚C - 8˚C until use. Secondary standard stock solutions were prepared from primary standard stock solutions of STG and PIO to 5229.4 µg·mL−1 and
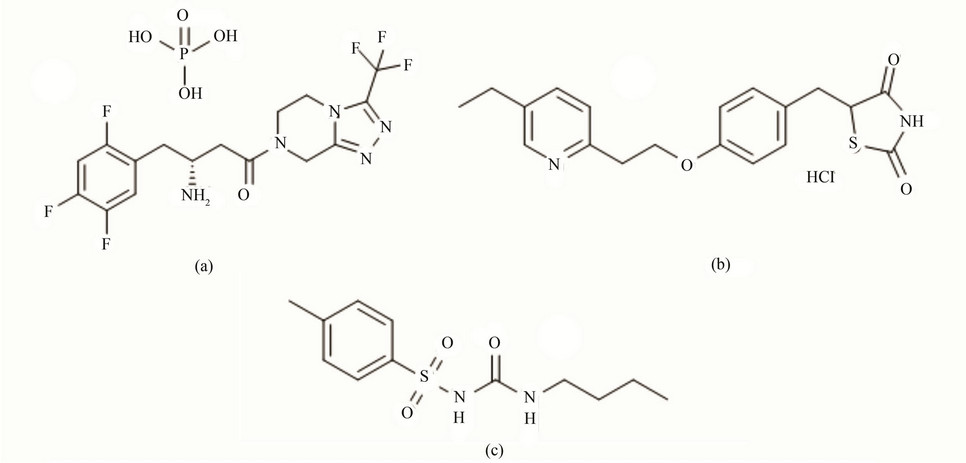
Figure 1. Structural representation of (a) STG (Sitagliptin); (b) PIO (Pioglitazone) and (c) IS Tolbutamide.
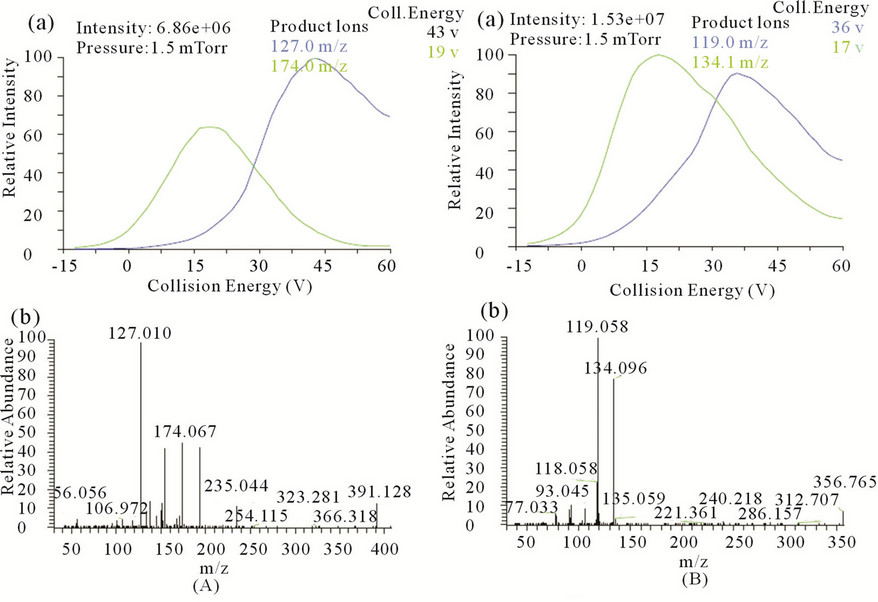
Figure 2. (a) Break down curve of the parent ion for (A) STG and (B) PIO. (b) Q3 MS product ion spectra of (A) STG and (B) PIO.
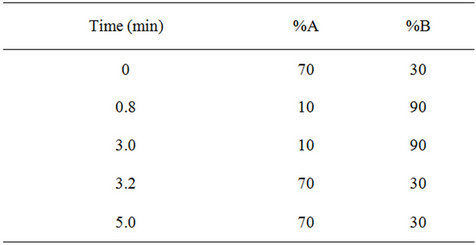
Table 1. Gradient programme of proposed method consisting of (A) 2 mM Ammonium acetate buffer pH adjusted to 4.5 with glacial acetic acid, (B) Methanol (100%).
3929.0 µg·mL−1 respectively in methanol:water (70:30 v/v) as diluent. From secondary standard stocks of STG and PIO standards were prepared in diluent with serial dilutions to be used for preparation of calibration curve standards in rat plasma over 10.98 - 2091.77 ng·mL−1 range for SIT and 8.25 - 1571.63 ng·mL−1 range for PIO. From secondary standard stocks of STG and PIO intermediate QC standards are prepared separately of calibretion standards with serial dilutions in diluent to be used for QC standards preparation at four different concentrations i.e. Lower Limit of Quantification (LLOQ), Low QC (LQC), Middle QC (MQC) and High QC (HQC) levels. LOQ QC was prepared from the lowest calibration stan-
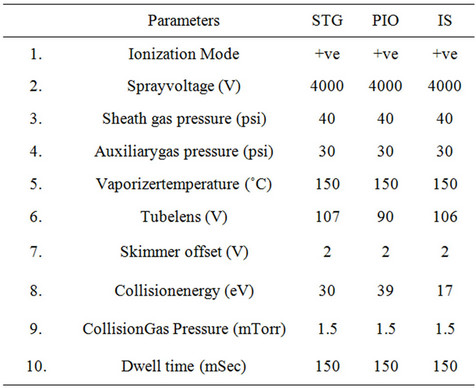
Table 2. Mass spectrometric conditions for Analytes and IS.
dards for STG and PIO at concentration of 10.98 ng·mL−1 and 8.25 ng·mL−1 respectively. Intermediate CC (calibration curve) standard and QC standards were spiked 5 µL to 45 µL of blank plasma to get final sample to be processed.
2.4. Bioanalytical Method Validation
The method was validated for selectivity, linearity, precision and accuracy (intraand inter-day), recovery,
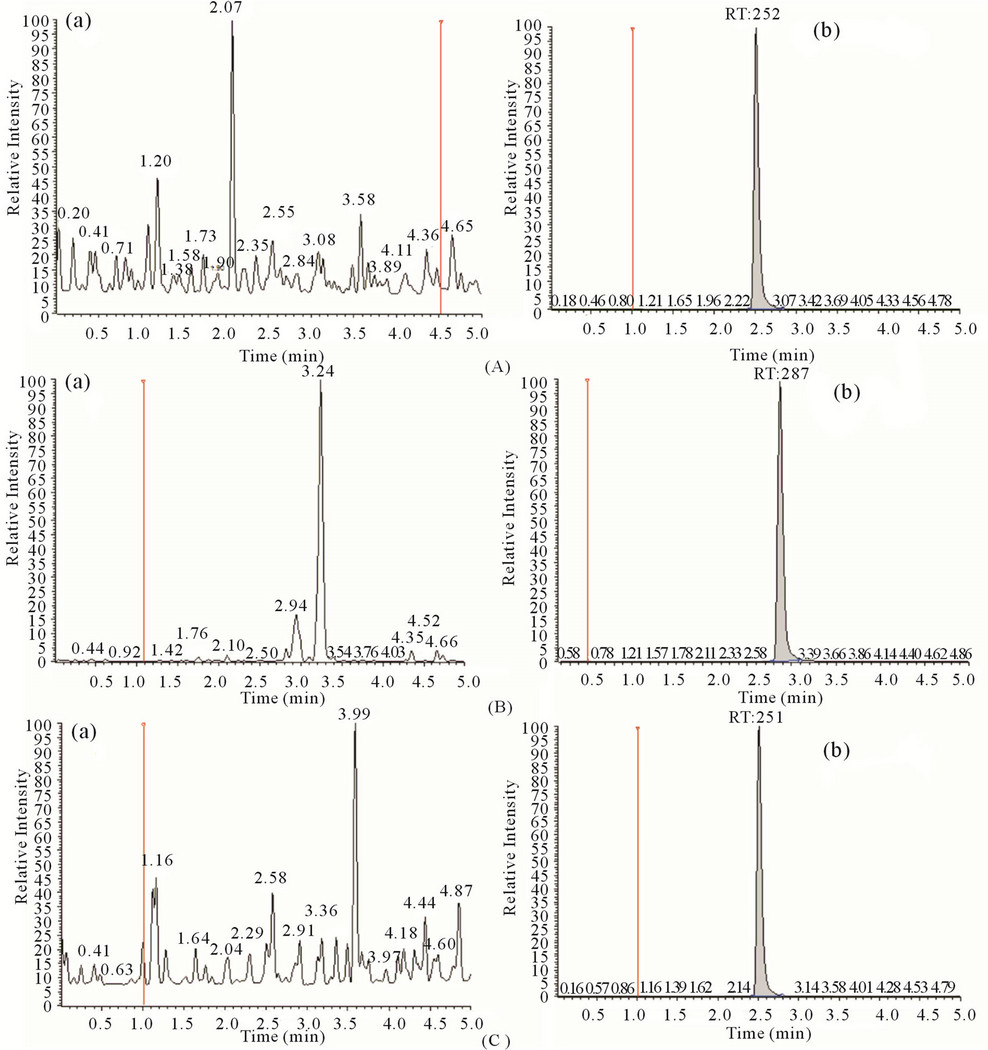
Figure 3. Representative chromatograms of blank plasma (a) and LLOQ (b) for STG (A); PIO(B); IS (C).
matrix effect, dilution integrity, and stability study following the US FDA guidelines. Selectivity was checked in six different lots of blank plasma. Six out of six batches were of intended anticoagulant (Na2-EDTA) plasma (In house ID: RPL-1, RPL-2, RPL-3, RPL-4, RPL-5 & RPL-6) were found to be free of significant interferences at the retention time of both analytes and IS (i.e. area of the peak at the retention time of both analytes in standard blank samples was ≤20.00% of the area of the drug in the extracted LLOQ sample; area of the peak at the retention time of IS in standard blank samples was ≤5.00% of the area of the ISTD in the extracted LOQ QC sample as per acceptance limit). Plasma lots (In house ID: RPL-1, RPL-2, RPL-3, RPL-4, RPL-5 & RPL-6) were pooled and used as a blank matrix to prepare calibration curve standards and quality control samples. The linearity of the method was determined by analysis of standard plots associated with a nine-point standard calibration curve. Best-fit calibration curves of peak area ratio versus concentration were drawn. The concentrations of STG and PIO were calculated from the simple linear equation using regression analysis of spiked plasma calibration standard with the reciprocal of the drug concentration as a weighting factor (1/concentration, i.e. 1/x); y = mx + c. The curve was also used to calculate the nominal concentration of quality control samples. The precision of the LC-MS/MS method was evaluated by the %CV at different concentration levels corresponding to LLOQ, LQC, MQC and HQC during the course of validation. Mean and standard deviation (SD) were obtained for calculated analyte concentration at each level. Accuracy and precision were evaluated in terms of percent relative error (%RE) and percent coefficient of variation (%CV) respectively with respect to the nominal concentration. The dilution integrity experiment was performed with an aim to validate the dilution test to be carried out on higher drug concentrations (more than ULOQ), which may be encountered during real subject sample analysis. This is to ensure that the dilution of sample with same matrix does not have any impact on the actual results. To carry out this experiment, double the ULOQ concentration was diluted 5 and 10 times in blank human plasma. Their back-calculated concentrations were obtained by applying the dilution factor of 4. The percentage recovery of both the analytes was determined by comparing the mean area of five replicates each of extracted quality control samples (LQC, MQC, and HQC) with mean area of freshly prepared un-extracted QC samples (spiked with aqueous spiking stock solution in extracted plasma). Stability experiments were performed to evaluate the analyte stability in stock solutions and in plasma samples under different conditions, simulating the same conditions, which occurred during study sample analysis. Stock solution stability was performed by comparing area response of stability sample of analytes and IS with the area response of sample prepared from freshstock solutions. Bench top stability (room temperature stability), autosampler stability, freeze thaw stability, and long-term stability were performed at LQC and HQC levels using six replicates at each level.
3. Results and Discussion
3.1. Method Development
The aim of this work was to develop and validate a rapid, rugged, and adequately sensitive assay for the quantitative extraction and simultaneous estimation of SIT and PIO in plasma for the analysis of routine samples. To realize this sample extraction procedure, chromatographic conditions, and MS detection parameters were optimized. To obtain better method specificity and reproducibility, the mass spectrometry was initiated using ESI as the ionization technique in the MRM mode. Also to keep the method simple it was decided to work in either positive or negative mode for both the analytes and IS. Due to the basic nature of STG, PIO and IS, the response in the positive mode was much higher compared to the negative mode. Careful manipulation of mass spectrometry parameters helped in achieving a stable and consistent response in the positive mode for both the analytes and IS. To accomplish this, it was found that tube lens offset is an important parameter. Thus, it was optimized at 107, 90, and 106 V for STG, PIO and IS respectively. Further, to enhance the response the ion spray voltage was raised from 2800 V (kept initially) to 4000 V. Auxiliary and sheath gas were optimized at 30 and 40 psig, respectively. STG, PIO and IS gave predominant precursor ions at m/z 408.1, 357.3 and 271.1 respectively, in full scan mode. By optimizing collision energy (30 eV, 39 eV and 17 eV) to precursor ions in Q3 MS, most abundant product ions obtained at m/z 127.0, 119.0 and 155.0 for the analytes and IS respectively. Chromatographic analysis of the analytes and IS was initiated under gradient conditions with an aim to develop a simple separation procedure with a short run time. Because of the high response factor of analytes in both methanol and ACN in presence of 2 mM ammonium acetate buffer various trials are done with methanol: 2 mM ammonium acetate mobile phase composition in isocratic and gradient mode using C18, 30 mm length, 4.6 mm internal diameter, and 4.0 μm particle size as stationary phase. Further trial with Liquid-Liquid extraction (LLE) using Tert-Butyl Methyl Ether (TBME) and Ethyl acetate (EtOAc) was also showing the interference at Sitagliptin Retention tine. This trial involved 50 µL plasma and 750 µL TBME or Ethyl acetate as an extracting solvent with methanol 100 µL reconstitution. Binary gradient of methanol and 2 mM ammonium acetate finally tried to solve the interference problem with 5 min. run time. In all the trials except mobile phase variation remaining parameters were kept constant like flow rate, injection volume, column temperature, autosampler temperature, splitter to flow etc. The chromatograms obtained with the final optimized conditions were shown in Figure 3.
3.2. Optimization of Sample Preparation
After optimization of mass spectrometric conditions and chromatographic conditions next step was tried for optimization of sample processing technique. Keeping the 50 µL plasma volume constant, protein precipitation and liquid-liquid excitation techniques were tried to get better & simple sample processing technique to get better recovery and sensitivity of analytes. Figure 4 depicts the overview of sample preparation methods. It has been found that recovery for PIO with EtOAc and recovery for STG with TBME is less in comparison to protein precipitation technique. Protein precipitation technique and

Figure 4. Sample preparation trails (Trail-A, B and C) for LC-MS/MS injection, because of high recovery and precision protein precipitation technique was finally considered for injection.
both LLE techniques are free of matrix effect to both analytes but because of high recovery and simplicity protein precipitation technique was finalized for sample processing. Ideally, an internal standard should mirror the analytes in as many ways as possible. It should track the analyte during extraction and compensate for any analyte on the column and any inconsistent response due to matrix effects. To compromise the processing level atongoing analysis level due to instrument for quantitation of both analyte by method Tolbutamide was tried as an internal standard (IS). Because of its ionization in positive ionization mode, high & precise recovery from plasma and its ability to give precise results on preliminary precision accuracy trials, Tolbutamide was finalized as IS. The results of method validation support the use of Tolbutamide and were acceptable in this study based on FDA guidelines.
3.3. Sensitivity
The Sensitivity of the method was evaluated by analyzing 6 LOQ QC (Lower Limit of Quantification) at 10.98 ng·mL−1 for STG and 8.25 ng·mL−1 for PIO The precision and accuracy for STG at LOQ QC level were found to be 7.1% CV and 106.57% nominal respectively. The precision and accuracy for PIO at LOQ QC level were found to be 10.1% CV and 102.81% nominal respectively.
3.4. Linearity, Precision Accuracy and Dilution Integrity
The STG calibration curves were linear from 10.98 - 2091.77 ng·mL−1 with correlation coefficient (r2) of 0.9975, while for PIO the linear dynamic range was from 8.25 - 1571.63 ng·mL−1 with correlation coefficient (r2) of 0.9975 between five calibration curves, wherein the results are shown in Table 3. The precision values observed for the back-calculated concentrations are presented in Table 4. Intra-day and inter-day precision was less than 9.0% at the three QC levels for both the analytes. The precision values calculated at LLOQ level were 15.07% and 9.59% (intra-day); 10.18% and 6.10% (inter-day) for STG and PIO respectively. Intra-and inter-day accuracy values expressed in terms of %RE were within −5.0% to 11.0% for both the analytes. The mean back-calculated concentrations for 1/4 dilution samples was within 85% - 115% of their nominal concentration, while the coefficient of variation (%CV) for this dilution was less than 3.7% for both the analytes.
3.5. Stability Study
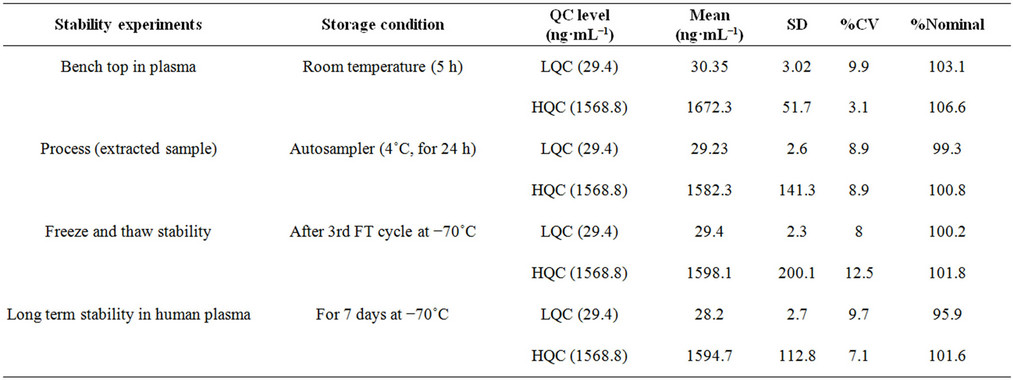
Stability experiments were performed to evaluate their stability in stock solutions and in plasma samples. The conditions which occurred during actual study sample analysis were simulated in method validation stability studies, such as: stock solution stability of STG and PIO; stability in plasma at room temperature; extracted sample stability (Auto-sampler stability at 15˚C); freeze thaw stability and long term stability at −80˚C. Stock solution of STG and PIO were stable at room temperature for 5 h and at 2˚C - 8˚C for 7 days with mean percent change within ±5%. SIT and PIO in control rat plasma were stable for at least 6 h at room temperature; upto 24 h (process stability) in the autosampler maintained at 15˚C and for minimum three freeze and thaw cycles. The long term stability was also established for 14 days at −80˚C. The observed and acceptable percent change for the stability experiments are shown in Tables 5(a) and (b).
3.6. Application of the Method to Pharmacokinetics Study
The method was successfully applied to estimate the plasma concentration versus time profile of selected
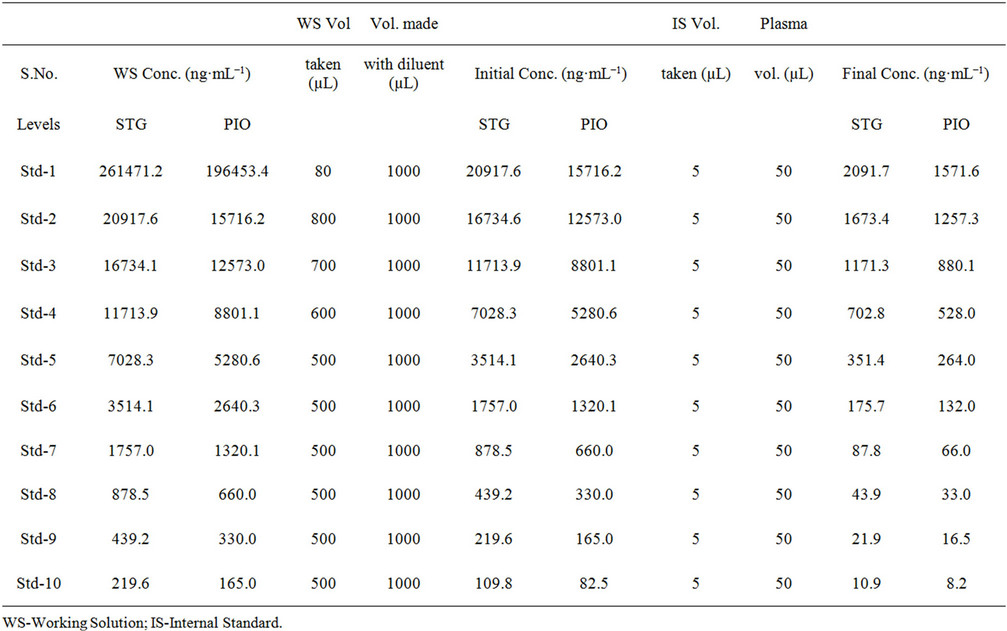
Table 3. Back-calculated concentration of Calibration Standards (CS) from respective calibration curves for STG and PIO.

Table 4. Precision and range of the proposed method.
 (a)
(a)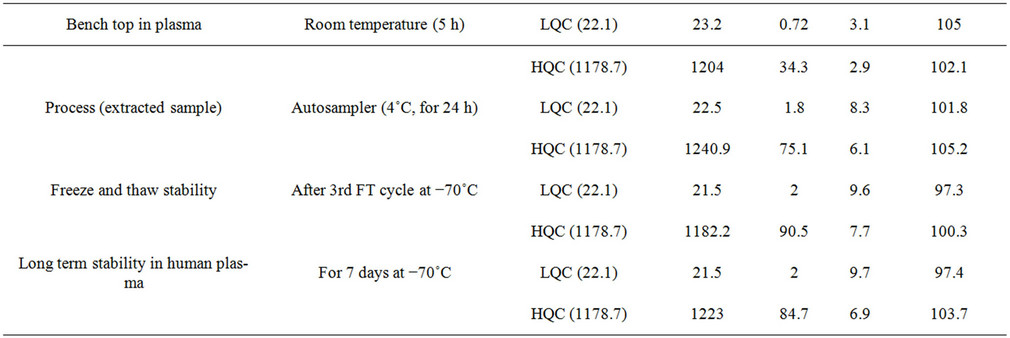 (b)
(b)
Table 5. Stability experiments of PIO (a) and STG (b) in plasma.
drugs (STG and PIO) in plasma following simultaneous oral administration at 10 mg·kg−1 doses of STG and PIO in Wistar rats (n = 2). Pharmaco-kinetic study was done on two Wistar rats after IAEC (Institutional Animal Ethics Committee) approval. Oral formulation were prepared separately in suspension form (1 mg·mL−1) by triturating accurately weighed amount of STG and PIO powdered compound in methyl cellulose solution (0.5%, w/v water) in gravimetric dilution pattern using suspending agent Tween 80 1.25 µL for each 1 mL Oral suspension. Dosesof STG and PIO (10 mg·kg−1) were administered simultaneously using an oral gavage at 10 mL·kg−1 volume in Wistar rats after overnight fasting (12 hr) and these animals were continued for fasting till 4 hr post dose.
The blood samples (0.17 mL) were collected from retro orbital sinus at predose, 15, 30 min and 1, 2, 4, 6, 10, 12, 24 hrs post dose of simultaneous administration of STG and PIO. After blood collection samples were kept on ice bath till further processing. These samples were separated for plasma by centrifuging at 4˚C for 10 min at 4000 rpm and then stored at −80˚C till further analysis. These samples were analyzed for estimation of the levels of STG and PIO. Results for plasma levels (ng·mL−1) of STG and PIO after administration in male Wistar rats respectively. Pharmacokinetic parameters data generated for non-compartment modeling with WinNonlin 5.1 software are tabulated for STG and PIO respectively. Summary PK profile of STG and PIO after single dose administration in male Wistar rats is shown in Table 6 and mean plasma concentration-time profile for STG and PIO is shown in Figure 5.
4. Conclusion
The objective of this work was to develop a simple, high throughput, and sensitive method to simultaneously estimate STG and PIO in plasma following simultaneous oral administration of 10 mg·kg−1 doses of STG and PIO in Wistar rats. Moreover, the sensitivity of this method is good for simultaneous estimation of SIT and PIO. Also, the chromatographic run time of 5.0 min makes it possi-
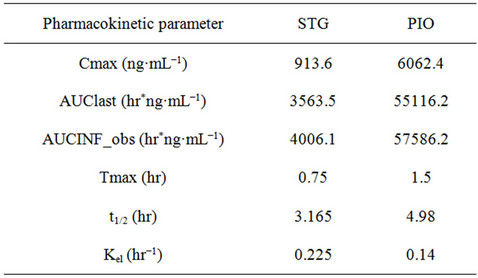
Table 6. Mean Pharmacokinetic profiles of STG and PIO after oral administration at 10 mg·kg−1 doses in Wistar rats.
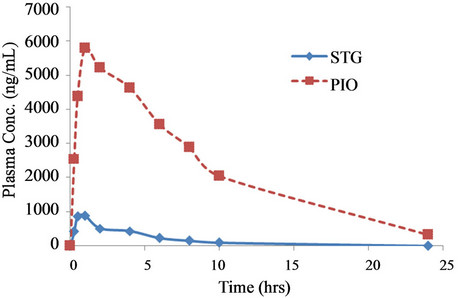
Figure 5. Mean pharmacokinetic profile of STG and PIO after oral administration of 10 mg·kg−1 doses of STG and PIO in Wistar rats.
ble to analyze 200 samples in a day. From the results of the validation parameters, we can conclude that the method can be very useful for therapeutic drug monitoring both for analysis of routine samples of single dose or multiple dose pharmacokinetics and also for the clinical trial samples with desired precision, accuracy and high throughput.
5. Acknowledgements
The authors are indebted to Dr. Swaroop Kumar Vakkalanka, MD & CEO, Incozen therapeutics Private Limited, for providing the necessary facilities to carry out this work. The authors gratefully acknowledge NIPER-Hyderabad for motivation and assistance during the course of dissertation work.
REFERENCES
- A. Bergman and D. Ebel, “Absolute Bioavailability of Sitagliptin, an Oral Dipeptidyl Peptidase-4 Inhibitor in Healthy Volunteers,” Biopharmaceutics & Drug Disposition, Vol. 28, No. 6, 2007, pp. 315-322. doi:10.1002/bdd.560
- G. A. Herman and A. Bergman, “Pharmacokinetics and Pharmacodynamic—Effects of the Oral DPP-4 Inhibitor Sitagliptin in Middle-Aged Obese Subjects,” Journal of Clinical Pharmacology, Vol. 46, No. 8, 2006, pp. 876- 886. doi:10.1177/0091270006289850
- M. L. Christensen, B. Meibohm, E. V. Capparelli, P. Velasquez-Mieyer, G. A. Burghen and W. V. Tamborlane, “Singleand Multiple-Dose Pharmacokinetics of Pioglitazone in Adolescents with Type 2 Diabetes,” Journal of Clinical Pharmacology, Vol. 45, No. 10, 2005, pp. 1137- 144. doi:10.1177/0091270005279578
- S. Bala and R. Prameela, “Development and Validation of Spectrophotometric Method for the Determination of DPP4 Inhibitor, Sitagliptin in Its Pharmaceutical Dosage Forms,” International Journal of Pharmacy and Pharmaceutical Sciences, Vol. 2, No. 4, 2007, pp. 138-142.
- R. S. Mehta and D. M. Patel, “UV and Visible Spectrophotometric Analysis of Pioglitazone Hydrochloride in Bulk and Tablets,” Indian Journal of Pharmaceutical Sciences, Vol. 67, No. 4, 2005, pp. 487-489.
- A. J. Meeta, S. S. Pandya and G. Vidyasagar, “A Simple and Sensitive HPTLC Method for Estimation of Pioglitazone in Bulk and Tablet Dosage Forms,” Asian Journal of Research in Chemistry, Vol. 2, No. 2, 2009, pp. 207-209.
- W. Zeng, D. G. Musson, A. L. Fisher, L.Chen, M. S.Schwartz, E. J. Woolf and A. Q. Wang, “Determination of Sitagliptin in Human Urine and Hemodialysate Using Turbulent Flow Online Extraction and Tandem Mass Spectrometry,” Journal of Pharmaceutical and Biomedical Analysis, Vol. 46, No. 3, 2008, pp. 534-542.
- T. Radhakrishna, R. D. Sreenivas and G. Om Reddy, “Determination of Pioglitazone Hydrochloride in Bulk and Pharmaceutical Formulations by HPLC and MEKC Methods,” Journal of Pharmaceutical and Biomedical Analysis, Vol. 29, No. 4, 2002, pp. 593-607. doi:10.1016/S0731-7085(02)00036-5
- E. I. Ramzia, E. F. Ehab and A. M. Bassam, “Liquid Chromatographic Determination of Sitagliptin Either Alone or in Ternary Mixture with Metformin and Sitagliptin Degradation Product,” Talanta, Vol. 85, No. 1, 2011, pp. 673-680. doi:10.1016/j.talanta.2011.04.051
- M. Shyamala, S. Mohideen, T. Satyanarayana, C. NarasimhaRaju, K. P. Suresh and K. Swetha, “Validated RP-HPLC for Simultaneous Estimation of Sitagliptin Phosphate and Metformin Hydrochloride in Tablet Dosage Form,” American Journal of PharmTech Research, Vol. 2, No. 1, 2011, pp. 93-101.
- K. Dipak and K. Rajendra, “Simultaneous Determination of Pioglitazone, Metformin and Glimepiride in Pharmaceutical Preparations Using HPTLC Method,” Journal of Planar Chromatography, Modern TLC, Vol. 24, No. 4, 2011, pp. 331-334.
- K. Ghazala, S. Dinesh, Y. P. Agrawal, S. Neetu, J. Avnish and A. K. Gupta, “Simultaneous Estimation of Metformin and Sitagliptin in Tablet Dosage Form,” Asian Journal of Biochemical and Pharmaceutical Research, Vol. 2, No. 2, 2011, pp. 352-358.
- M. Jemal, “High-Throughput Quantitative Bioanalysis by LC/MS/MS,” Biomedical Chromatography, Vol. 14, No. 6, 2000, pp. 422-429. doi:10.1002/1099-0801(200010)14:6<422::AID-BMC25>3.0.CO;2-I
- R. N. Xu, L. Fan, M. J. Rieser and T. A. El-Shourbagy, “Recent Advances in High-Throughput Quantitative Bioanalysis by LC-MS/MS,” Journal of Pharmaceutical and Biomedical Analysis, Vol. 44, No. 2, 2007, pp. 342-355. doi:10.1016/j.jpba.2007.02.006
NOTES
*Corresponding author.

