American Journal of Analytical Chemistry
Vol.3 No.11(2012), Article ID:24937,5 pages DOI:10.4236/ajac.2012.311103
Development and Validation of Bioanalytical Method for Determination of Telmisartan and Hydrochlorothiazide Using HPTLC in Human Plasma
Department of Pharmaceutical Chemistry, M. G. V’s Pharmacy College, Pune University, Nashik, India
Email: *roteambadas@gmail.com
Received November 1, 2011; revised December 9, 2011; accepted December 13, 2011
Keywords: HPTLC; Telmisartan; Hydrochlorothiazide; Human Plasma; Liquid-Liquid Extraction
ABSTRACT
A simple, sensitive, rapid and economic high performance thin layer chromatographic method has been developed for determination of telmisartan and hydrochlorothiazide in human plasma using paracetamol as an internal standard. The plasma sample was extracted using mixture of methanol-acetonitrile (3.0:0.1, v/v). A concentration range from 200, 400, 600, 800, 1000, 1200 ng/spots were used for calibration curve of hydrochlorothiazide and telmisartan respectively. The percent recovery of telmisartan and hydrochlorothiazide was found to be 75.98% and 81.91%. The mobile phase consists of chloroform: methanol: toluene (8:2:4 v/v/v). Densitometric analysis was carried out at wavelength 278 nm. The Rf values for hydrochlorothiazide, paracetamol and telmisartan were 0.28 ± 0.05, 0.50 ± 0.05, 0.66 ± 0.05 respectively. The stability of telmisartan and hydrochlorothiazide in plasma were confirmed during three freeze-thaw cycles (−20˚C), on bench during 24 hours and post preparative during 48 hours. The proposed method was validated statistically and by performing recovery study for determination of telmisartan and hydrochlorothiazide in human plasma.
1. Introduction
Chemically hydrochlorothiazide (Figure 1) (HCTZ) (is 6-chloro-3,4-dihydro-2H-1,2,4-benzothiadiazine-7-sulphonamide-1, 1-dioxide and telmisartan (TEL) is 4-[6- (1-TELhyl-1H-benzimidazole-2-yl)2-propyl-1H-benzimidazole-1-yl] methyl] biphenyl-2-carboxyllic acid. Hydrochlorothiazide is one of the oldest thiazide diuretics used to treat hypertension. It is often prescribed in combination with other antihypertensive drugs such as β- blockers, angiotensin converting enzyme inhibitors or angiotensin II receptor blockers [1]. A combination of dosage form of HCT with TEL is more effective than either drug alone in the management of hypertension. For the determination of TEL HPLC and fluorescence [2] detection, LC-MS/MS [3,4] and liquid chromatography with column switching [5] have been reported. Similarly a number of methods for the determination of HCT in human plasma have been developed on HPLC [6-8] with UV or diode array detection [9,10] and LC-MS/MS [11, 12]. No simultaneous estimation method was developed for determination of HCTZ and TEL in human plasma. So a simple, sensitive, rapid and economic high performance thin layer chromatographic method has been developed for determination of HCTZ and TEL in human plasma using paracetamol as an internal standard (IS).
2. Materials and Methods
2.1. Instrumentation
HPTLC Camag with precoated silica gel Plate 60F254 (20 cm × 10 cm) 250 µm thicknesses (E. Merck, Darmstadt, Germany) was used as stationary phase. Sample application was done by using Camag 100 µl syringe and Camag Linomat V applicator. The sample was sprayed in
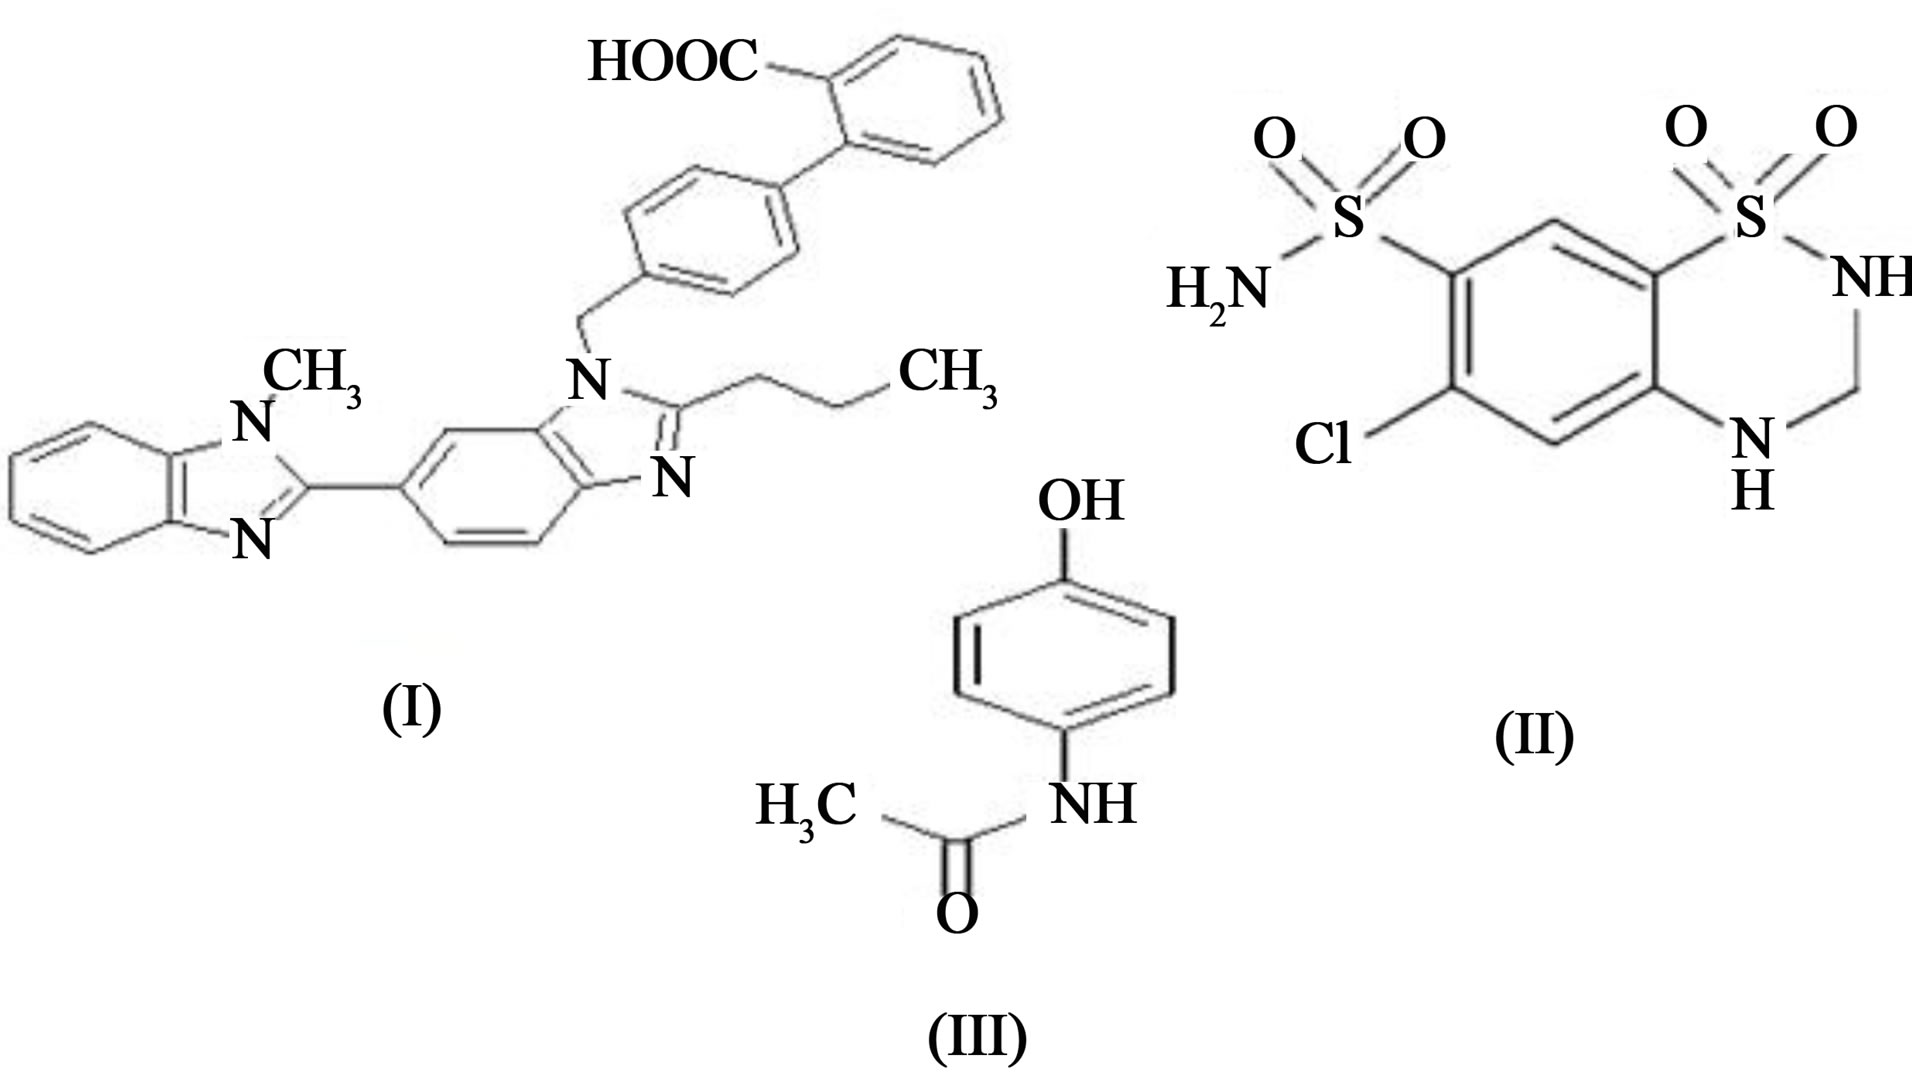
Figure 1. Structure of telmisartan (I), hydrochlorothiazide (II) and paracetamol (IS) (III).
the form of narrow bands of 8 mm length at a constant rate 2 µl/s. Linear ascending development was carried out in 20 cm × 10 cm twin trough glass chamber (Camag, Muttenz, Switzerland). The densitometric scanning was performed by using Camag TLC scanner III supported by win CATS software (V1.4.2.8121Camag). Evaluation of chromatogram was done by using ratio of peak areas of drugs with internal standard.
2.2. Chemicals
Telmisartan (Glen mark Pharmaceuticals, HP, India), hydrochlorothiazide (Elder Pharmaceuticals, Mumbai, Maharashtra, India) and Paracetamol (Kirti Pharmachem Ltd., Sinnar, Maharashtra, India) were received having 99.80%, 98.70% and 100.1% purity respectively. They were used as such by without checking their purity. The HPLC grade methanol and Analytical Reagent grade chloroform and toluene were purchased from S D Fine Chem. Ltd., Mumbai, India. Human plasma used for research work was supplied by Arpan Blood Bank, Nashik, Maharashtra, India.
2.3. Preparation of Stock Solution and Working Standard Solution
Stock solutions 1.0 mg/ml each of telmisartan, hydrochlorothiazide and paracetamol were prepared in methanol.
2.4. Preparation of Plasma Sample
In a 15 ml centrifuge tube 2, 4, 6, 8, 10, 12 µl of working stock solution of hydrochlorothiazide and telmisartan was added to drug-free plasma to provide calibration standards of 200, 400, 600, 800, 1000, 1200 ng/spot and 1000 ng/spot of paracetamol (internal standard)was kept constant. The quality control (QC) samples were prepared in plasma in concentration range 400, 800, 1200 ng/spot. Protein precipitation and extraction was carried out by using mixture of methanol-acetonitrile (3.0:0.1, v/v) on by vigorous vortex using remi mixer for 1min and centrifuged at 5000 rpm at 10 min. The organic phase was recovered and evaporated to dryness on hot plate. The residual mass was reconstituted with 1 ml methanol. The analysis was carried on HPTLC.
2.5. Chromatographic Condition
Mobile phase was selected as mixture of chloroform, methanol and toluene in the ratio of (8:2:4, v/v/v) for the development of plates. Time for chamber saturation was optimized to 30 min. The length of chromatographic development was 70 mm. The densitometric scanning was performed at 278 nm.
2.6. Method Validation
The method was validated for sensitivity, selectivity, precision, accuracy, linearity, recovery and stability. The validation of the method was based on FDA guidelines and on standard Bioanalytical method validation recommendation. The selectivity of method was investigated by analysing six blank plasma samples. Each blank sample was tested for interference using proposed extraction procedure. Five replicate of three QC sample low, mid and high were used for the determination of precision and accuracy. Intra-day and inter-day precision were carried out. Precision and accuracies showed 15% relative standard deviation from nominal values at LLOQ these were both 20%. The recovery of HCT and TEL was calculated by comparison of the peak areas of low, mid, and high quality control sample (400, 800, 1200 ng/spot) prepared in plasma (extracted) with unextracted HCT with TEL respectively.
Stability studies were performed to detect degradation of telmisartan and hydrochlorothiazide under certain condition. Freeze-thaw stability was determined at two QC concentrations (low, high) after freezing (−20˚C) and thawing for three cycles and compared with nominal value. Bench-top stability was assessed for low and high QC samples by comparing with nominal value which stored at room temperature for 12 h. The effect of storage within the auto-sampler was assessed by comparing QC samples injected immediately after preparation with those left in auto-sampler for 48 h.
3. Result and Discussion
3.1. Extraction Procedure Optimization
One of the most difficult task during the method development was to achieve a high and reproducible recovery from the solvent which is used for extraction of the drug and also difficult task to select such single extracting solvent from which both the drugs are extracted. Different solvents were tried for the extraction of HCTZ and TEL from human plasma. First 3 ml each of chloroform and toluene were tried for the precipitation of plasma but the recovery was very less. It gave 50% - 70% of recovery because of less precipitation of protein from plasma. At the last methanol was tried and 70 % - 85% of recovery was obtained. It was found that the addition of acetonitrile (0.1 ml) increases the precipitation of protein and also the recovery which is reproducible and high as compare to other solvents. So methanol and acetonitrile (3.0:0.1, v/v) was kept as final solvent for extraction of HCTZ and TEL.
3.2. Optimization of Chromatographic Condition
Initially plane solvents like methanol, ethyl acetate, chloroform, toluene, acetone, formic acid were tried. The spots were developed with chloroform and methanol but no proper resolution observed between HCTZ, TEL and PARA also shows the tailing. Then chloroform and methanol in the ratio of (9:1, v/v) was tried but again there is no proper resolution obtained. By adding toluene as non polar solvent telmisartan shows good resolution and also decreases tailing effect and good resolution with symmetrical peaks of HCTZ, PARA and TEL were obtained. Finally mobile phase consists of chloroform: methanol: toluene (8:2:4, v/v/v) which gave good resolution of peaks for HCTZ, TEL and PARA. The Rf values for HCTZ, PARA and TEL were found to be 0.28 ± 0.05, 0.50 ± 0.05 and 0.66 ± 0.05 respectively. Well defined spots were obtained by prewashing the plate using meanol followed by activating at 120˚C for 20 min. Chamber was saturated with mobile phase for 30 min at room temrature, which gave reproducible Rf values for hydrolorothiazide, paracetamol and telmisartan respectively (Figure 2).
3.3. Calibration Curves
The six point calibration curve was constructed by plotting the peak response ratio of hydrochlorothiazide to IS and telmisartan to IS in plasma. Correlation of coeffients is 0.9958 and 0.9981 for HCTZ and TEL respectvely. Linearity’s were found over the range 200, 400, 600, 800, 1000 and 1200 ng/spot for HCTZ and TEL respectively. The lower limit of quantification was defined as lowest concentration in the calibration curve. The hydrochlorothiazide and telmisartan can be determined at LLOQ 2 µl/ml.
3.4. Recovery
Absolute recovery was calculated by comparing peak areas obtained from freshly prepared sample extracted
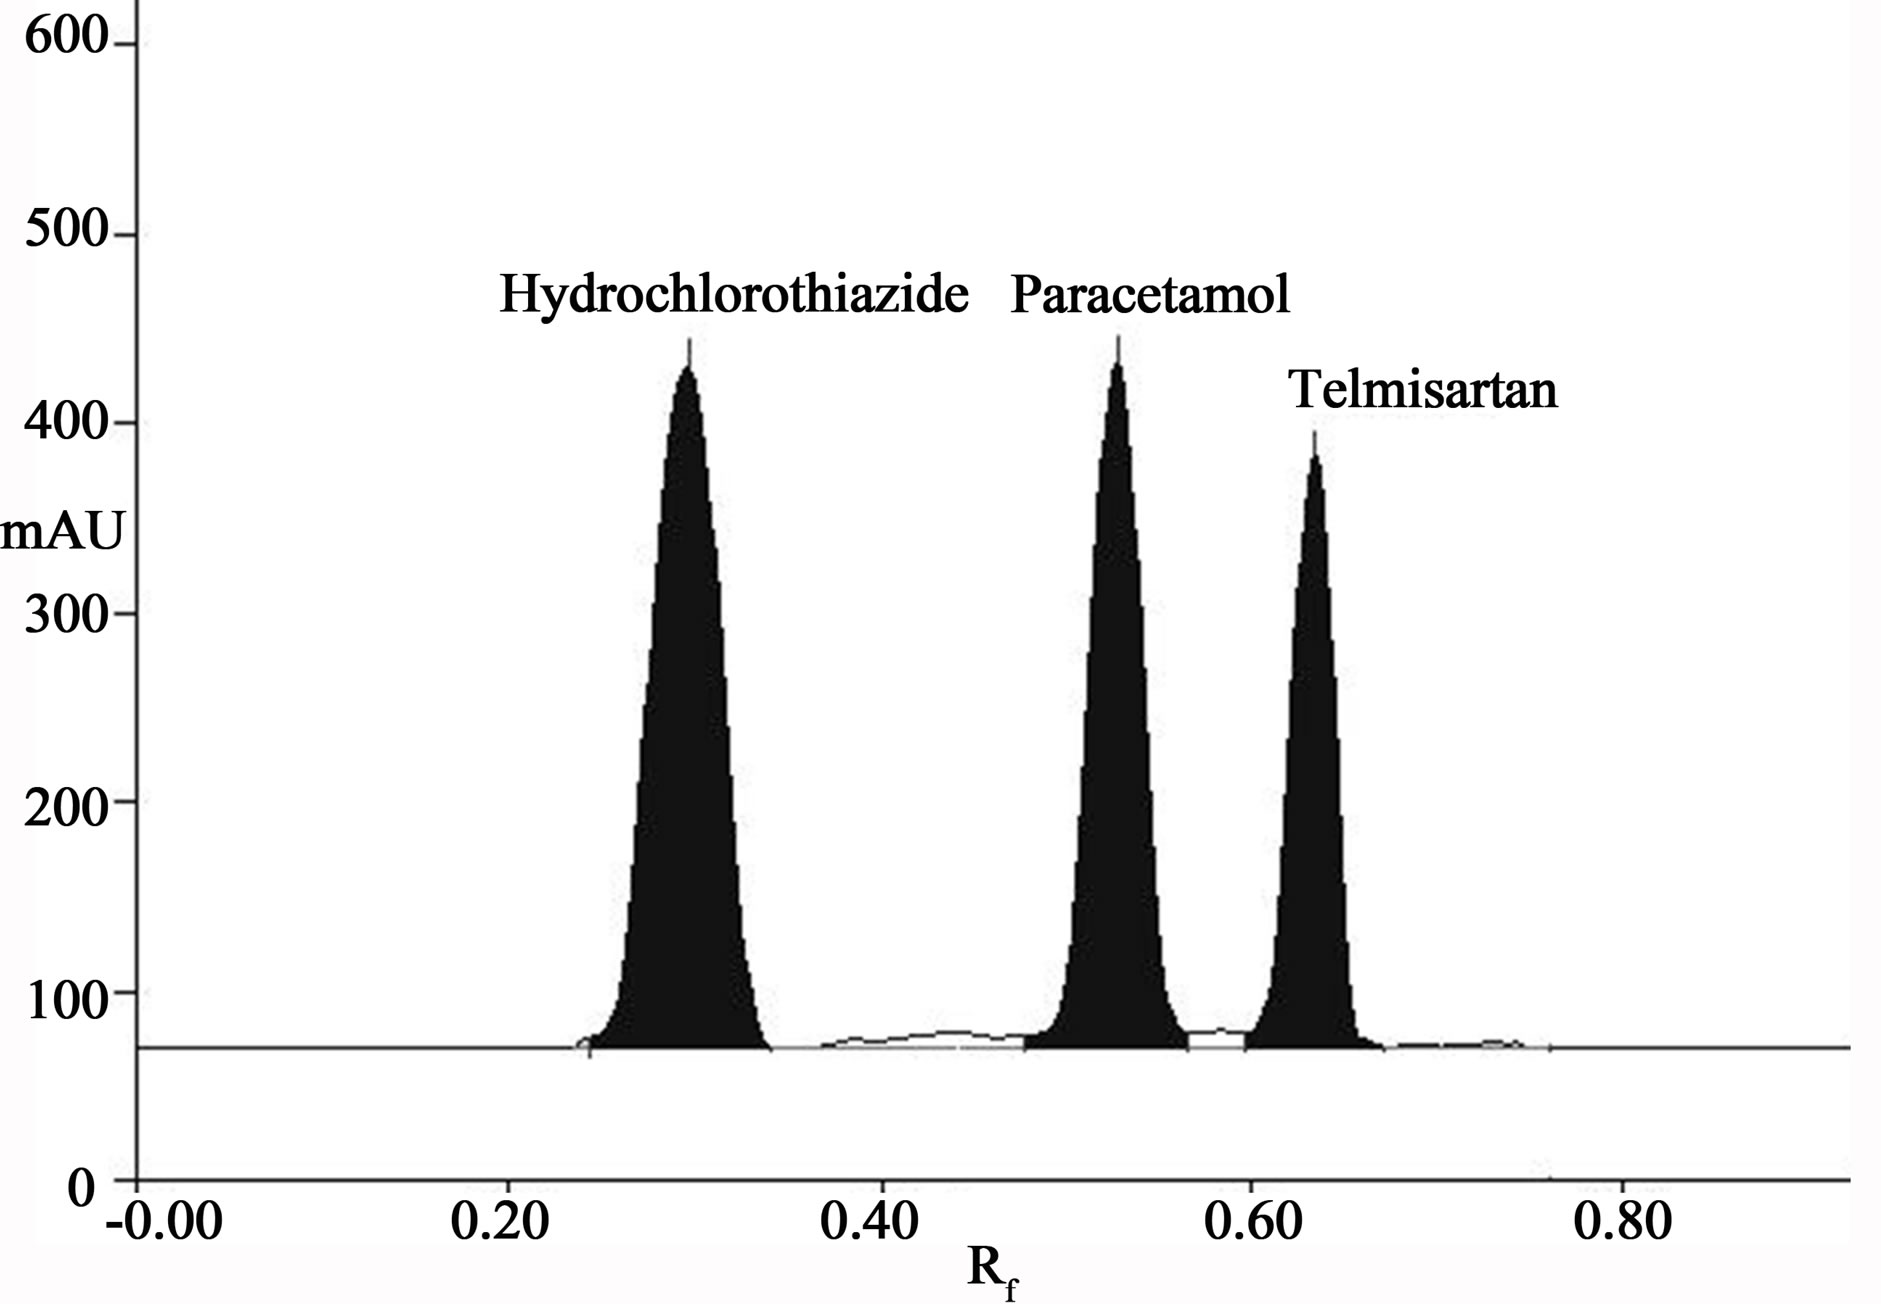
Figure 2. Densitogram of hydrochlorothiazide (Rf = 0.28 ± 0.05), paracetamol (Rf = 0.50 ± 0.05) and telmisartan (Rf = 0.66 ± 0.05).
with unextracted standard solutions of the same concenation. Recovery data was determined in triplicates at three concentrations (low, mid, high) as recommended by FDA guidelines [12]. The recovery of hydrochlorothiazide and telmisartan for HPTLC recovery at the three concentrations 400, 800, 1200 ng/spot were found to be 90.09%, 71.77% and 66.08% and 71.44%, 93.39% and 80.92% respectively (Table 1).
3.5. Precision and Accuracy
Precision of the method was determined by repeatability (intraday) and intermediate precision (inter-day) and accuracy for set of quality control (QC) sample (low, mid, high) in replicate (n = 5).The inter-day, intra-day precision was found to be in the range of 2.39% - 6.03% and 2.44% - 17.28% and the inter-run precision was 5.46% - 8.49% and 1.06% - 6.78%, and accuracy was within 4.59% - 10.63%. In this assay the inter-day, intra-day precision and accuracy values were within the acceptable range, it shows that the method is accurate and precise. The low percent relative standard deviation and percent relative error were within the acceptable limit. The results of inter-day, intra-day precision and accuracy for the HCTZ and TEL are shown in Table 2.
3.6. Sensitivity and Selectivity
Selectivity or specificity should be assessed to show that the intended analytes are measured and their quantitation
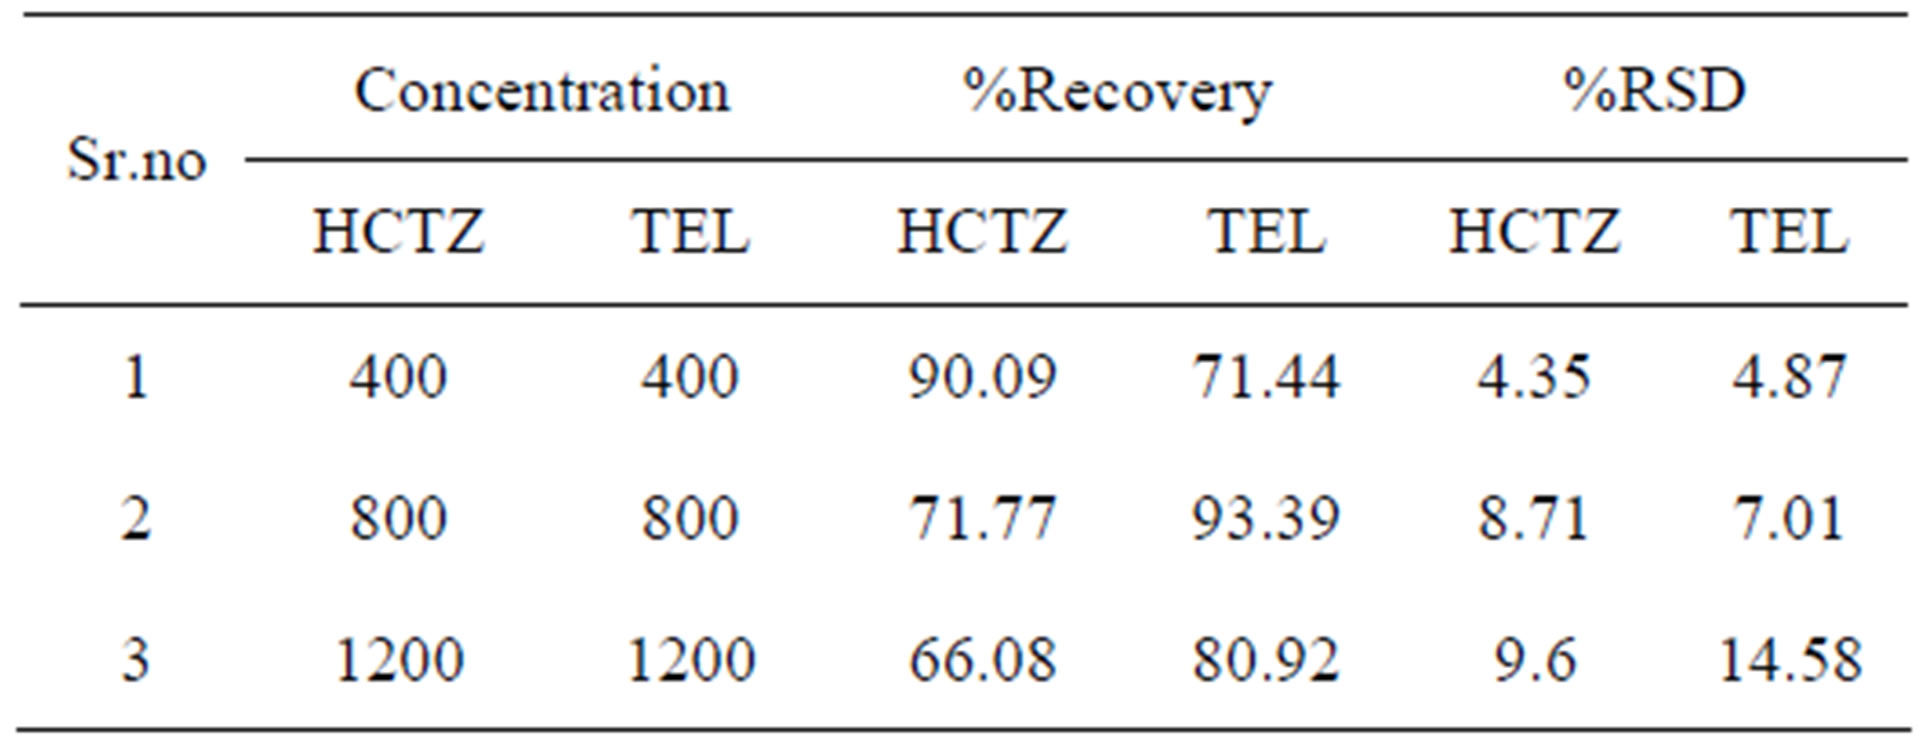
Table 1. Result of recovery of hydrochlorothiazide and telmisartan in human plasma.
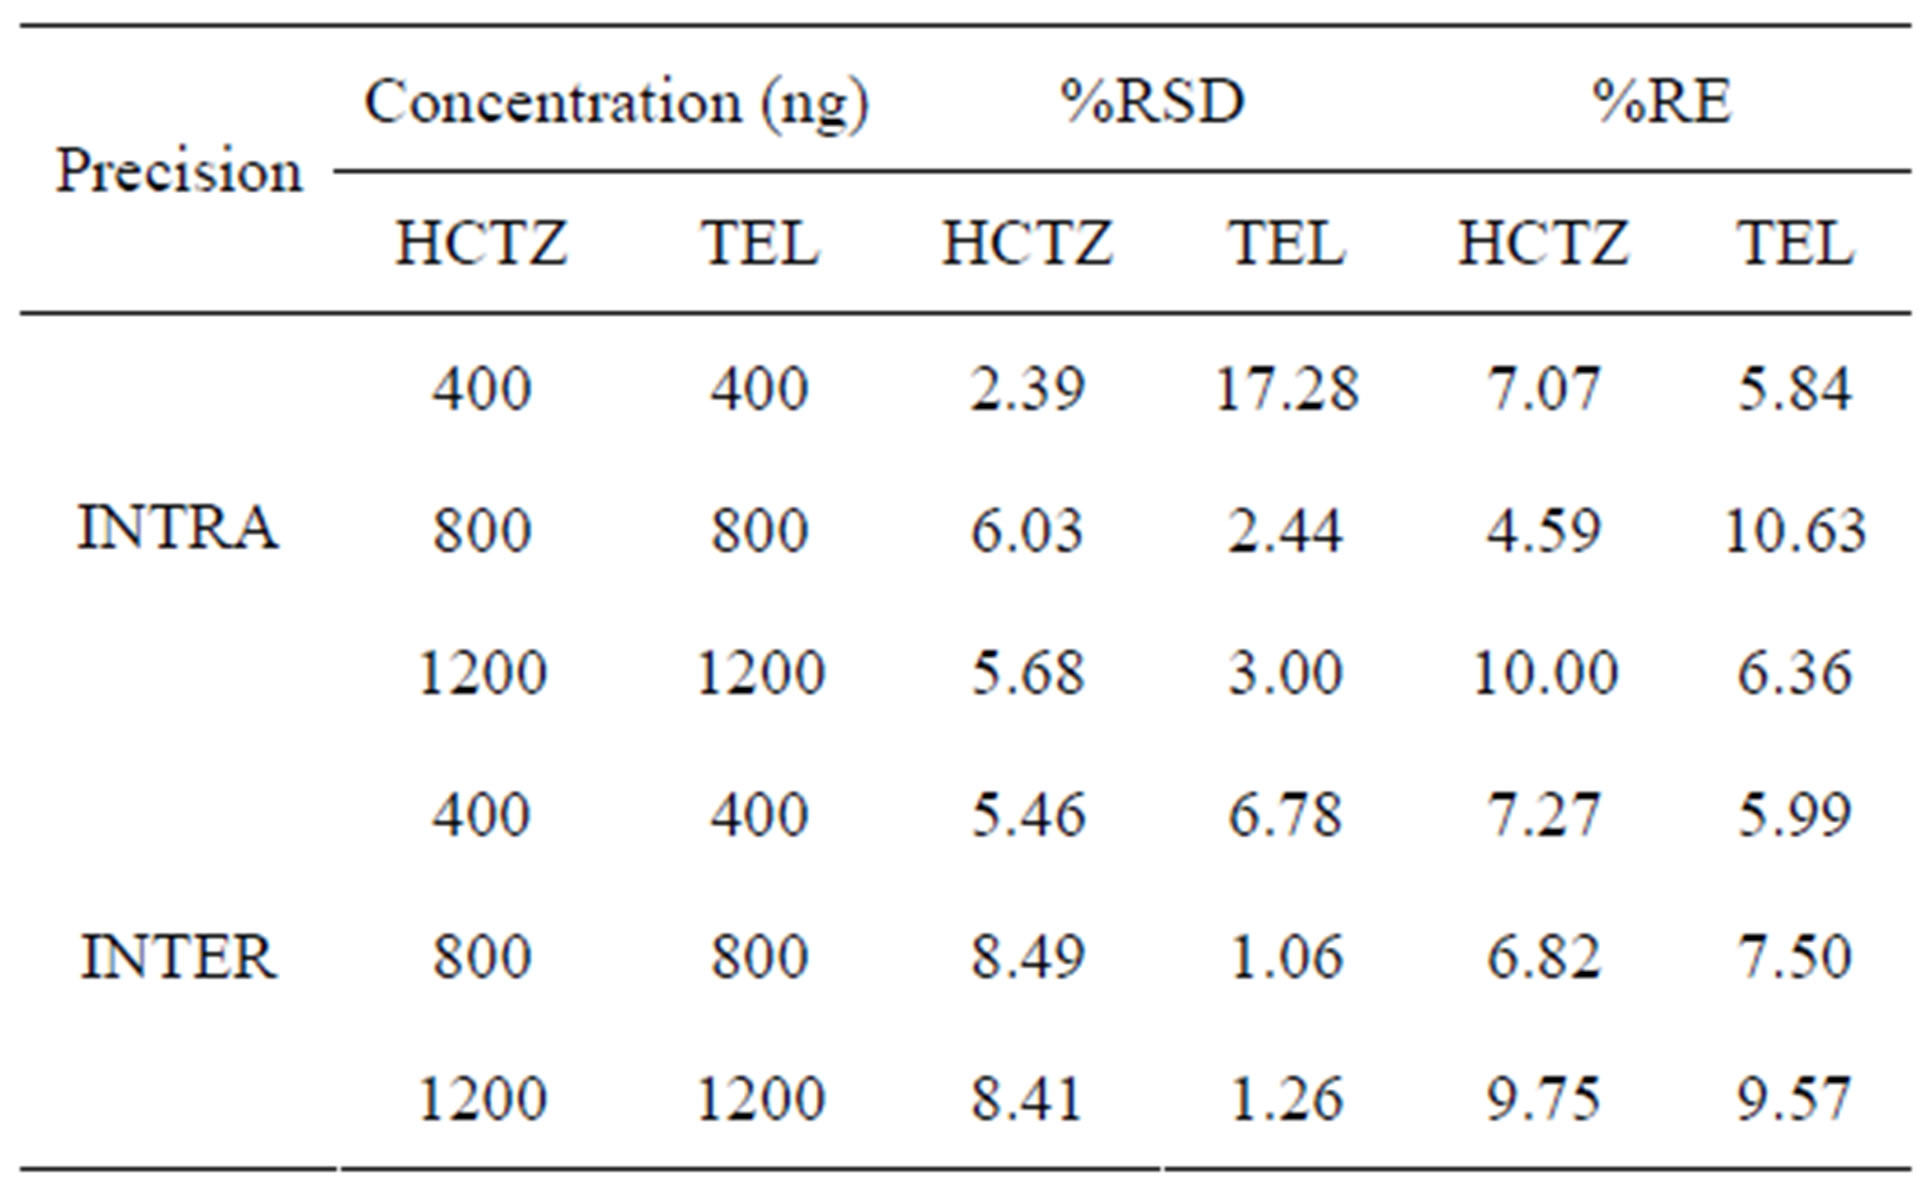
Table 2. Results of precision of hydrochlorothiazide and telmisartan in human plasma.
is not affected by the presence of the biological matrix for HPTLC method by LLE as shown in Figure 2, there is no any interference of the biological matrix in the quantitation of HCTZ and TEL, the method is selective. Sensitivity of the method is defined as the lowest concentration that can be measured with an acceptable limit of accuracy and precision which is lower than 20% [11]. The accuracy and precision at lower limit of quantitation (LLOQ) analyzed by using five replicate (n = 5) of the sample at the LLOQ concentration. The accuracy is determined by %RE at this LLOQ concentration. The lower limit of quantitation which could be detected were found to be 200 ng/spot with %RE = 8.38%, 14.72% and %RSD = 2.2%, 4.78% for HCTZ and TEL is within acceptable limit.
3.7. Analysis Speed
In case of HPTLC 18 spot can be applied on one plate so less time consuming.
3.8. Stability
In bench top stability the low and high QC sample were thawed and left at room temperature for 12 h. Comparison of the results for QC sample (low and high) with freshly prepared stock solution showed that there was no significant difference between response of freshly prepared solution and sample of HCTZ and TEL after 12 h. Freeze-thaw stability was determined after two freezethaw cycles for three replicate of low and high QC sample. The samples were stored at −20˚C temperature for 24 h. Then thaw at room temperature. No significant difference between freeze-thaw sample and freshly prepared sample was observed. The result of stability studies shows that no significant degradation occurred at ambient temperature for 48 h for post-preparative stability. Results of stability studies for HPTLC method are shown in Table 3.
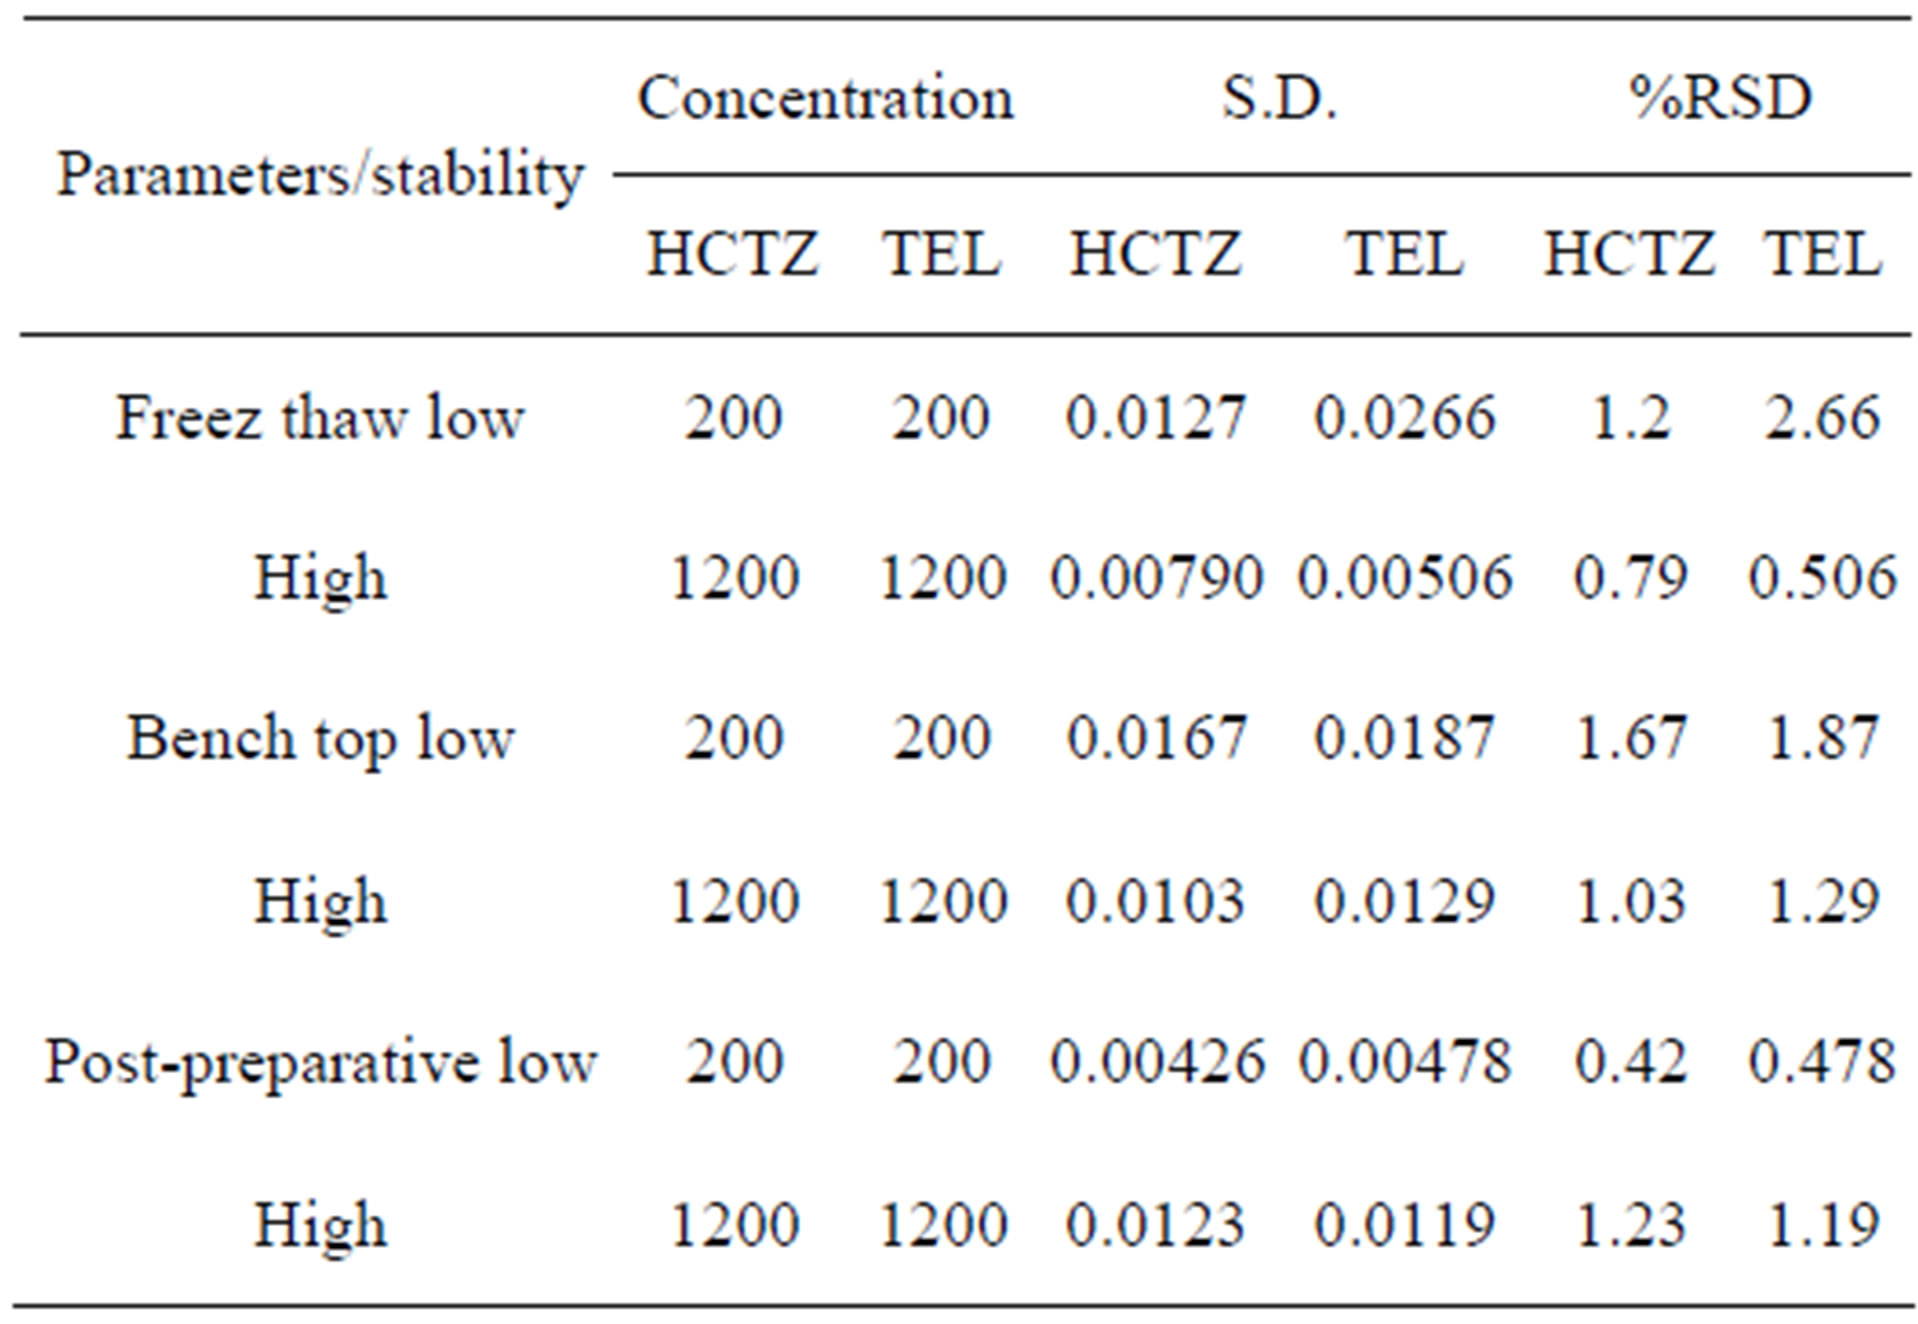
Table 3. Stability study of telmisartan and hydrochlorothiazide in human plasma.
4. Conclusion
The proposed HPTLC method for the estimation of telmisartan and hydrochlorothiazide in human plasma are selective and sensitive. Sensitivity of the method is suitable for handling various plasma levels of the drug. The method is economical and faster than earlier published methods. In future we can use this method for bioequivalence study.
5. Acknowledgements
The authors are thankful to the Management and Principal, Dr. Rajendra S. Bhambar of M G V’s Pharmacy College, Nashik for providing necessary facilities for the research work. The authors are also thankful to Arpan Blood Bank, Nashik for providing human plasma, (Glenmark Pharmaceuticals, HP, India.) for providing telmisartan, (Elder pharmaceuticals, Mumbai, Maharashtra, India) for providing hydrochlorothiazide and paracetamol (Kirti Pharmachem, Sinner, Maharashtra, India) as a gift sample for the research work.
REFERENCES
- K. Wellington and D. M. Faulds, “Valsartan/Hydrochlorothiazide: A Review of Its Pharmacology, Therapeutic Efficacy and Place in the Management of Hypertension,” Drugs, Vol. 62, No. 13, 2002, pp. 1983-2005. doi:10.2165/00003495-200262130-00015
- H. Zhang, Y.-Y. Jiang, J. Wen, T. T. Zhou, G. R. Fan and Y. T. Wu, “Rapid Determination of Telmisartan in Human Plasma by HPLC Using a Monolithic Column with Fluorescence Detection and Its Application to a Bioequivalence Study,” Journal of Chromatography B, Vol. 877, No. 29, 2009, pp. 3729-3733. doi:10.1016/j.jchromb.2009.08.028
- B.-M. Chen, Y.-Z. Liang, Y.-L. Wang, F.-L. Deng, P. Zhou, F.-Q. Guo and L.-F. Huang, “Development and Validation of Liquid Chromatography-Mass Spectrometry Method for the Determination of Telmisartan in Human Plasma,” Analytica Chimica Acta, Vol. 540, No. 2, 2005, pp. 367-373. doi:10.1016/j.aca.2005.03.004
- H. Christel, L. Gläsle-Schwarz, U. Kunz and U. Karst, “Determination of Telmisartan in Human Blood Plasma Part II: Liquid Chromatography-Tandem Mass Spectrometry Method Development, Comparison to Immunoassay and Pharmacokinetic Study,” Analytica Chimica Acta, Vol. 560, No. 1-2, 2006, pp. 41-49.
- M. del Rosario Brunetto, Y. Contreras, S. Clavijo, D. Torres, Y. Delgado, F. Ovalles, C. Ayala, M. Gallignani, J. M. Estela and V. C.Martin, “Determination of Losartan, Telmisartan, and Valsartan by Direct Injection of Human Urine into a Column-Switching Liquid Chromatographic System with Fluorescence Detection,” Journal of Pharmaceutical and Biomedical Analysis, Vol. 50, No. 2, 2009, pp. 194-199
- A. R. Rote and S. P. Pingale, “Reverse Phase-HPLC and HPTLC Methods for Determination of Gemifloxacin Mesylate in Human Plasma,” Journal of Chromatography B, Vol. 877, No. 29, 2009, pp. 3719-3723. doi:10.1016/j.jchromb.2009.08.013
- D. Zendelovska, T. Stafilov and P. Milosevski, “Development of Solid-Phase Extraction Method and Its Application for Determination of Hydrochlorothiazide in Human Plasma Using HPLC,” Biomedical Chromatography, Vol. 18, No. 2, 2004, pp. 71-76. doi:10.1002/bmc.293
- N. Erk, “Simultaneous Determination of Irbesartan and Hydrochlorothiazide in Human Plasma by Liquid Chromatography,” Journal of Chromatography B, Vol. 784, No. 1, 2003, pp. 195-201. doi:10.1016/S1570-0232(02)00759-6
- N. V. Ramakrishna, K. N. Vishwottam, S. Manoj, M. Koteshwara, S. Wishu and D. P. Varma, “Sensitive Liquid Chromatography-Tandem Mass Spectrometry Method for Quantification of Hydrochlorothiazide in Human Plasma,” Biomedical Chromatography, Vol. 19, No. 10, 2005, pp. 751-760. doi:10.1002/bmc.510
- F. Liu, Y. Xu, S. Gao, J. Zhang and Q. Guo, “Determination of Hydrochlorothiazide in Human Plasma by Liquid Chromatography/Tandem Mass Spectrometry,” Journal of Pharmaceutical and Biomedical Analysis, Vol. 44, No. 5, 2007, pp. 1187-1191. doi:10.1016/j.jpba.2007.04.020
- S. Bansal and A. DeStefano, “Key Elements of Bioanalytical Method Validation for Small Molecules,” The AAPS Journal, Vol. 9, No. 1, 2007, pp. E109-E114. doi:10.1208/aapsj0901011
- US Department of Health and Human Services, “FDA Guidance for Industry: Bioanalytical Method Validation,” US Department of Health and Human Services, Rockville, 2001.
NOTES
*Corresponding author.