Journal of Geoscience and Environment Protection
Vol.05 No.11(2017), Article ID:80352,21 pages
10.4236/gep.2017.511009
Perimeters of Protection Demarcation for New Boreholes of Bonoua Aquifer (Southeastern, Côte d’Ivoire) through Hydrogeological Modeling
Kouamé Kan Jean1, Aké Gabriel Etienne1, Koblan Armel Kouadio1, Djé Kouakou Bernard2, Jourda Jean Patrice1
1Water and Environment Sciences and Technical Laboratory (LSTEE), UFR of Earth Sciences and Mineral Resources, University of Félix Houphouët-Boigny, Abidjan, Côte d’Ivoire
2Department of Climatology and Meteorological Applications, National Meteorological Direction, Abidjan, Côte d’Ivoire

Copyright © 2017 by authors and Scientific Research Publishing Inc.
This work is licensed under the Creative Commons Attribution International License (CC BY 4.0).
http://creativecommons.org/licenses/by/4.0/


Received: September 13, 2017; Accepted: November 13, 2017; Published: November 16, 2017
ABSTRACT
Located in the southeastern of Côte d’Ivoire, Bonoua aquifer contains an enormous groundwater potential. The new boreholes have been realized in this region to support the water supply of the populations. Moreover, in this region, agriculture is the main activity, whose pesticides used to guarantee the productivity, constitute a threat for groundwater. Thus, this study was undertaken in order to design a hydrogeological model able to simulate the piezometry of the Bonoua aquifer and determine the perimeters of protection for the new boreholes. The model, carried out under the Visual Modflow interface, was designed in steady-state mode and calibrated manually from the piezometry of the year 2000. The value of the standardized root mean squared residual of 4.86% (<10%) allows to say that the calibration obtained is considered satisfactory. Also, the correlation coefficient between observed and simulated heads of 0.95 permits to confirm a good calibration of the model. Perimeters of protection values were determined by simulating the paths of the virtual particles of water from the calibrated model. The simulations show that generally, the groundwater of Bonoua aquifer flows from north to south and the piezometric levels obtained vary between 65 m in the north and 5 m in the south. Upstream radius of the closed perimeters of protection calculated from the model varies from 172 to 482 m. However, those of distant perimeters of protection vary from 2877 to 6441 m.
Keywords:
Boreholes, Hydrogeological Modeling, Perimeters of Protection, Visual Modflow, Bonoua Aquifer

1. Introduction
Water is a factor of development for our society. In recent decades, the State of Côte d’Ivoire has made important efforts to improve the supply of drinking water in some cities. In Abidjan, groundwater exploitation permits to ensure the equalization of cubic meter price in Côte d’Ivoire. However, this resource is facing threats due to the accelerated expansion of Abidjan District and the rapid growth of this population that contribute to the quantitative and qualitative degradation of groundwater. This has resulted in the stop of some boreholes whose nitrate concentration was more than 50 mg/L [1] . That has induced a deficit in the supply of drinking water to the population of Abidjan. In view to reinforce water supply of this population, the State has been oriented to the exploitation of the Bonoua aquifer [2] . This aquifer, with a capacity of 13.9 billion m3 of water [3] , will help to reduce the drinking water deficit in Abidjan District [4] . This very important aquifer is already used to reinforce the supply of drinking water to the populations of Abidjan in its southern part (Communities of Marcory, Koumassi, Treichville and Port-Bouët) and those of Bonoua and Grand-Bassam. However, the town of Bonoua is an agricultural area where agricultural inputs and other fertilizers are used to increase production. Also, future developments for the establishment of industrial zones are planned in this region. This situation exposes the groundwater of the Bonoua aquifer to agricultural pollution [5] . In order to prevent possible contamination of the new boreholes, and to guarantee at long-term good water production, it is important to set up protection perimeters around the boreholes. Therefore, perimeters of protection are an essential component of the groundwater management policy in Côte d’Ivoire. Thus, it has appeared necessary to undertake this study to contribute to the protection of this very strategic aquifer. It was carried out within the framework of the funded project by the Strategic Support Program for Scientific Research (PASRES). The general objective of this study is to realize a hydrogeological model allowing to determine the perimeters of protection around the new boreholes of Bonoua in order to guarantee an efficient management in the perspective of the sustainable development of Bonoua aquifer.
1.1. General Presentation of Bonoua Region
Bonoua is a region located in the southeast of Côte d’Ivoire and composed of three departments: Grand-Bassam, Adiaké and Aboisso. The study area is between 5˚08'N and 5˚33'N latitudes and 3˚13'W and 3˚51'W longitudes (Figure 1). This region has a surface measuring approximately 2.209 km2. On the climatic

Figure 1. Localization of Bonoua region.
level, four seasons that characterize the south forestry of Côte d’Ivoire, are emerging. It is essentially two rainy seasons with a peak in the month of June and two dry seasons. At the geological and hydrogeological level, two geological domains have been differentiated in the Bonoua region: the sedimentary basin in the south and the crystalline bedrock in the north [3] . The study area is located in the sedimentary basin (Figure 2). Three main aquifers are distinguished in the Bonoua region: the aquifers of the bedrock, the Mio-Pliocene (Continental Terminal) and the Quaternary. The Continental Terminal aquifer represents the main aquifer of the Ivorian sedimentary basin and is widely present in the Bonoua area. It is the aquifer that is exploited to ensure the drinking water supply to the populations of the Abidjan District, in its southern part and those of Bonoua and Grand-Bassam [3] .
1.2. Perimeters of Protection Concept
The perimeter of protection defines a territory including the surface and the subsoil around a structure through which the contaminants can migrate and reach the groundwater pumped by the borehole [7] . The purpose of perimeters protection is to protect boreholes intended for drinking water supply against
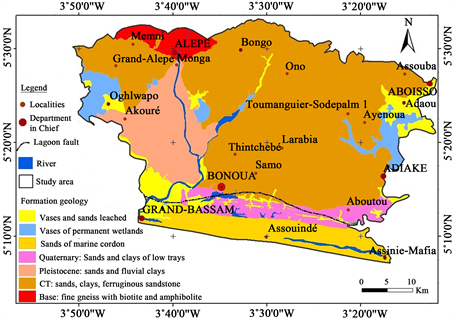
Figure 2. Geological map of Bonoua region extracted from the geological map of Grand-Bassam square degree [6] .
some pollution that may come from the surface of the soil. They are designed to protect the immediate sectors of the boreholes and to prohibit or regulate activities that could adversely affect the quality of water. In Côte d’Ivoire, Law n˚ 98-755 of 23 December 1998 on the Water Code, article 38, provides that the protection of water points for public use, is to be carried out. For a borehole, it envisages three concentric zones in which more or less strong constraints are instituted to avoid degradation of the resource. This involves the establishment of immediate, closed and distant perimeters of protection (Figure 3). It should be noted that the new boreholes in Bonoua benefit an immediate protection zone which is estimated at 30 m. Thus, in this study, it was a question of determining values of closed and distant protection of perimeters through hydrogeological modeling.
2. Material and Method
The following sections describe the material and the methodology used in this study.
2.1. Material
The establishment of the hydrogeological model of Bonoua aquifer required a database. The data used result from geological and hydrogeological works carried out on Bonoua aquifer by several authors ( [3] , [6] , [9] , [10] ). From a synthesis of this work, hydrodynamic parameters such as hydraulic conductivity (permeability), coefficient of storing and porosity of the coarse sand layers have been obtained. Piezometric data from 2000 have been used in the implementation of this model. Also, the rates of old boreholes have been collected from

Figure 3. Presentation of perimeters of protection around a borehole [8] .
previous works and those of new boreholes from the National Office for Drinking Water (ONEP) and the Water Distribution Company in Côte d’Ivoire (SODECI). These rates concern 16 boreholes of Bonoua divided into two captured fields: 11 boreholes at Tchintchébé and 5 boreholes at Ono. Finally, the technical logs of old boreholes were collected in the works of [3] and new ones, provided by SODECI with a view to determine the geological layer captured by these boreholes.
Groundwater flow of the Bonoua aquifer modeling and protection perimeters determination were carried out using Visual ModFlow version 3.0 provided by Waterloo Hydrogeologic [12] . This software integrates three codes [13] :
− ModFlow for the groundwater flow simulation;
− ModPath simulates the pathways of water particles;
− MT3D for mass transfer simulation.
The mathematical digital models of hydrodynamic flow are based on finite differences or finite elements. ModFlow allows to approximate flow equation solution through finite-difference method.
2.2. Methodological Approach
The model is a numerical schematization of the hydrogeological system. It allows you to go from a natural complex system, the ground, to a whole digital, the model. Consequently, it’s a question of two very different realities [11] . The digital model development requires several steps, such as the determination of objectives to be achieved, the choice of the software used, the design of conceptual models and digital, model calibration and finally the realization of predictive simulations. However, the execution of all those steps is conditioned by the obtaining of data. The following sections describe the methodology used in this study to achieve our objectives (Figure 4).
2.2.1. Modeling Objectives
Bonoua aquifer exploitation through the new boreholes in an agricultural zone requires a management and a protection of its groundwater. In order to manage groundwater resources, it is necessary to understand the aquifer functioning in natural conditions and to predict the impact of human intervention (exploitation) on groundwater quality and quantity. Thus, Bonoua aquifer modeling will allow to simulate the level of this aquifer and to determine the perimeters of

Figure 4. Flow chart for the design of the numerical model of Bonoua aquifer.
protection around the new boreholes of Ono and Tchintchébé, two villages of Bonoua.
2.2.2. Hydrogeological Model
Bonoua aquifer is an unconfined aquifer and has a hydrogeological comportment similar to Abidjan aquifer [3] . The bottom of the aquifer is constituted by the granitic bedrock whose elevations vary between +20 and −220 m [10] . The top of the aquifer is constituted by the topography surface which varies between 0 and 100 m [10] . The mean thickness is 115 m [3] . The aquifer thickness varies from 25 m in the N-W to 230 m in the S-E. The large thickness in the south is due to the subsidence of the bedrock which could be linked to the fault of the lagoons [3] . To the north of the study area, the small thickness is probably due to the rise of the bedrock with in particular the granitic outcrops.
2.2.3. Hydro-Stratigraphic Units Description of the Mode
Conceptual model of Bonoua aquifer was defined from boreholes logs collected at SODECI and has constituted mainly by two hydrogeological units:
・ The unit constituted by the coarse sands that covers the entire zone to be modeled. It is the unit used to supply drinking water to the population;
・ The unit formed by the bedrock and which represents the impermeable base of the aquifer.
The modeled area in this study is 50 km × 40 km. Its limits are constituted of (Figure 5):
・ the outcrops of the granitic bedrock at the north;
・ the tertiary sand at the south;
・ Comoé river at the west;
・ Aby lagoon at the east.
These limits are identical to those adopted by [10] .
The hydrogeological model of this study is monolayer represented by the coarse sands captured in all the new boreholes of Ono and Tchintchébé. The aquifer hydrodynamic parameters assigned to the model are obtained from the synthesis of the various works carried out by different authors [3] , [4] , [10] , in the region and are recorded in Table 1.

Figure 5. Grid of the numerical model of Bonoua aquifer.

Table 1. Hydrodynamic parameters of bonoua aquifer [4] .
For the space discretization (grid) of the model, square (irregular) cell 500 m × 500 m side were used. The shape and size of cell have been chosen depending on the aquifer extent. The size of the grid has been refined to 250 m × 250 m size around the new boreholes in exploitation (Figure 5). For a better representation of the limits of the modeled domain, cells that do not belong to the aquifer, are inactivated. Thus, the model is made of 6 720 cells distributed in 84 rows and 80 columns.
2.2.4. Boundary Conditions
Solving the general flow equation by Modflow code imposes the assignment of boundary conditions to the model. Thus, considering the work of [3] , the following boundary conditions were assigned to the model (Figure 6):
・ at the northern limit, the outcrop of the bedrock is supposed to be a constant head limit (h = 65 m);
・ at the southern part, the fault of the lagoons is materialized on the surface by the front of the tertiary sands. This is a limit at constant head (h = 3 m);
・ In the west part, Comoé river drains the groundwater: an imposed flow condition has been assigned;
・ In the east part, Aby lagoon drains the aquifer: an imposed flow condition has also been assigned.
Recharge-type boundary conditions are assigned uniformly on all modeled domain. Water quantity that contributes to the recharge of the aquifer corresponds to 111 mm/year. This recharge value was calculated through the Thornthwaite method using the precipitation and temperature data from 2000 to 2015 at the Adiaké meteorological station.

Figure 6. Boundary conditions of Bonoua aquifer model.
2.2.5. Model Calibration in Steady-State Mode
Model calibration aims at reproducing the best hydrodynamic operation of Bonoua aquifer, by adjusting the various parameters that can be vary while remaining in the range of realistic values [11] . The parameters to be adjusted are of two types:
・ Hydrodynamic parameters (permeability, porosity, storage coefficient);
・ Boundary conditions (initial heads, recharge, conductance).
The adjustments of the various parameters must always be close to the field measurements. In this study, the calibration is done “manually” or by “trial and error” because the insufficiency of piezometry data. This type of calibration follows this process:
・ Adjustment of hydrodynamic parameters;
・ Simulation of the model;
・ Comparison of the calculated heads versus measured heads (if differences are large then we retry the operation).
These operations are executed until they get low error of calibration thus reflecting a good calibration between heads “observed” on the ground and those “calculated” by the model [14] [15] . Other parameters provided by the software also allow to appreciate the quality of model calibration. Normalized Root Mean Squared residual or NRMS, expressed as a percentage, is the representative parameter of the model and must be less than 10% for an adequate calibration [16] . In addition to this parameter, a comparison has been made between piezometric values simulated by the model in 2000 and those observed in 2000 in reality. When the steady-state model is considered sufficiently calibrated, it is used as a simulation tool. It will help simulate the piezometric level of Bonoua aquifer and above all to determine the perimeters of protection of the new boreholes of Tchintchebé and Ono.
2.2.6. Simulation of Piezometry in 2000
The reconstitution of piezometry of Bonoua aquifer in 2000 has been carried out from 39 piezometric data of 2000 collected in the work of [3] . It was conducted in steady-state mode in exploitation conditions (take into consideration pumping). In exploitation conditions in the year 2000, only three boreholes of SODECI were in operation and they have been taken into account, assigning to the model the different rates of boreholes in 2000 (Table 2).
From the piezometry of year 2000, piezometric maps of different years have been simulated in steady-state mode by assigning to the boreholes of the model
Table 2. Pumping rates of boreholes at 2000.
the pumping rates collected from SODECI. The pumping rates of the new boreholes of Tchintchebé and Ono and industrial boreholes (Olgane and Celeste) have been used for predictive simulations of Bonoua aquifer piezometry from 2000 to 2020. These pumping rates are shown in Table 3. These simulations allow to calculate the evolution of Bonoua aquifer level face to the gradual increasing of the pumping proposed by SODECI to satisfy the high demand in water. They have been executed steady-state mode over a period of 20 years. The period of 20 years was been divided into 3 periods depending on the years of boreholes:
・ 2000 to 2007;
・ 2007 to 2015;
・ 2015-2020.
The projections from 2015 to 2020 correspond to the SODECI prevision. The pumping rates of the boreholes have been considered to be constant in the various simulation periods on the numerical model.
Table 3. Pumping rates of boreholes from 2000 to 2020.
2.2.7. Boreholes Perimeters of Protection Determination
To determine the perimeters of protection (closed and distant) around the new boreholes of Ono and Tchintchébé, the simulation of water virtual particles has been made from periphery of the cells where the boreholes have been assigned. ModPath module has been used. This module traces the path of the water particles from its infiltration point to the capture point. The results sought by the numerical model are groundwater flow direction and the lines of equal transfer time (isochronous).
The parameters taken into account in the determination of the boreholes perimeters of protection are: the radius around the boreholes and the water travel time. The radius around the boreholes must correspond to the cell size inside which the borehole is located. The grid size 250 m × 250 m around the boreholes has been adopted to facilitate the determination of this radius. It is fixed at 220 m because the virtual particles of water must not be inside the cell that contains the borehole but they must be as close as possible.
The water travel time (isochronous) corresponds to the time that a virtual particle of water takes from its infiltration point to the capture point. The 60-days and 9-years isochronous allowed to determine closed and distant perimeters of protection, respectively. The 60-day isochronous take into account microbiological pollutants (time permitting the disappearance of pathogenic bacteria) while the 9-years consider persistent pollutants such as pesticides [17] . Thus, in order to preserve new boreholes water’s quality against these pollutants, the area to be protected against a pollution due to an agricultural activity, is located in upstream of the latter (Figure 7). Then the perimeters of protection (closed and distant) have a form of an ellipse characterized by three distances of protection [18] (Figure 8):
・ Distance of protection in the upstream part of the borehole or upstream radius (rupstream);
・ Distance of protection in the downstream part of the borehole or downstream radius (rdownstream);
・ Distance of protection perpendicular to the flow direction (rp).
It will be necessary to determine the value of the three radius (perpendicular, downstream and upstream) for all new boreholes of Tchintchébé and Ono.

Figure 7. Illustration of the contribution zone and the normal surface to the natural groundwater flow [19] .

Figure 8. Characteristics of perimeters protection according to [8] .
3. Result and Discussion
3.1. Numerical Model Calibration Result
After calibration, the values obtained from hydrodynamic parameters of Bonoua aquifer are given in Table 4. During the calibration process, the initial hydraulic conductivity value has been adjusted while the porosity and coefficient of storage values remained identical to data from previous studies. This new value of the hydraulic conductivity is included in the range determined by [3] . The calibration parameters provided by the software were judged acceptable based on those values.
3.1.1. Graph of Observed versus Calculated Heads
The calibration carried out manually, allowed obtaining a good correspondence between observed and calculated heads. The graph presented in Figure 9 illustrates this good correspondence. Indeed, all the points are near to the first bisectrix, excepting few points that are little bit far. The calculation of the correlation coefficient (R) has gave 0.97 (around 1) and it shows that observed and calculated heads through the model are very well correlated. Thus, this model allows to simulate the head close to those observed in reality. Figure 10 shows a comparison between observed and calculated heads in steady-state mode for some piezometers. It also illustrates the degree of concordance between observed and calculated heads, even though some differences are observed at certain points such as Aboutou, Adiaho, Akromianbla, Kouakoukro and Yapokro.
As Bonoua aquifer model was considered to be well calibrated in steady-state mode and so some simulations on Bonoua aquifer level were carried out and the model served as basis for the determination of perimeters protection.

Figure 9. Graph of calculated heads vs. observed heads in year 2000 in steady-state mode of Bonoua aquifer.

Figure 10. Comparison between observed and calculated heads in steady-state mode in year 2000 of Bonoua aquifer.
Table 4. Adjusted hydrodynamic parameters of Bonoua aquifer.
3.1.2. Calibration Statistics Related to the Residual
Error values associated to the graph presented in Figure 9 are in Table 5. The value of the normalized RMS depends on the other parameters because it represents the parameter indicative of the calibration performance and its value must be less than 10%. The calibration in steady-state mode indicates a normalized RMS value equal to 4.86% (<10%), indicating that the model is calibrated.
3.2. Piezometry Simulation in 2000
The piezometry of 2000 was reconstructed from the steady-state model in exploitation conditions (Figure 11). This map shows a direction of groundwater flow from the North to the South. The heads oscillate between 65 (North) and 5 m (South).
3.3. Perimeters of Protection Values of the New Boreholes of Bonoua
For each borehole, 20 virtual particles of water were considered in order to better appreciate the contours of contribution area. The path of the different particles

Figure 11. Piezometry of Bonoua aquifer simulated in 2000 in steady-state mode.
Table 5. Calibration statistics in steady-state mode in year 2000.
obtained is illustrated in Figure 12. In order to better observe the path of the water particles, an exaggeration has been carried out. The virtual particles of water captured by different boreholes come from the North at different distances. The paths obtained as well as their piezometric configuration are different. Particle tracing follows a simple principle. It runs backwards of water particles perpendicular to the equipotential lines at a speed which is function of the hydraulic gradient, the hydraulic conductivity and the effective porosity at each point of the path. The hydrodynamic parameters (hydraulic conductivity and effective porosity) are identical throughout the model. Thus the difference observed in the particles comes from the hydraulic gradient at these different places.
Based on the tracing of the water virtual particles, the perimeters of protection radius (closed and distant) have been determined. The 60-day and 9-year equal- time transfer markers (isochronous) corresponding respectively to the closed and distant perimeters of protection, have allowed to obtain the characterizing radius of the perimeters of protection (Table 6). The Analysis of Table 6 reveals that:
・ upstream radius of the closed perimeters of protection (CPP) vary from 172 to 403 m and from 176 to 482 m respectively for the boreholes of Ono and Tchintchébé;
Table 6. Perimeters of protection (closed and distant) radius of the new boreholes of Ono and Tchintchébé.

Figure 12. Path of water virtual particles captured by the boreholes and delimiting the protection zones.
・ downstream radius of CPP vary from 112 to 301 m and from 0 to 268 m respectively for the boreholes of Ono and Tchintchebé;
・ upstream radius of the distant perimeters of protection (DPP) vary from 5554 to 6441 m and from 2877 to 4505 m for the boreholes of Ono and Tchintchébé.
It should be noted that downstream of the distant protection from the boreholes for NPP and DPP are very close. These values can be used by the Ivorian legislator for boreholes in the sedimentary basin because the Water Code does not mention any value for the delimitation of the boreholes perimeters of protection in Côte d’Ivoire. A visit of these perimeters reveals that the perimeters to be protected are occupied by oil palm, rubber and coconut plantations. For the preservation of these crops, phytosanitary products such as herbicides and pesticides containing potassium sulfate and urea are used. These products are susceptible to infiltrate into the soil and degrade the groundwater quality. These agricultural activities must be controlled and regulated by the State authorities in order to avoid any risk of contamination of the new boreholes by phytosanitary products since Bonoua region is an agricultural zone.
3.4. Discussion
Groundwater modeling flow of Bonoua aquifer has been produced from historical data (geological, hydrogeological, piezometric) and boreholes data supplied by SODECI and ONEP. These data were used to develop digital model and determine the perimeters of protection (closed and distant) of the new boreholes of Ono and Tchintchébé. Bonoua aquifer is free and it has a hydrogeological comportment similar to that Abidjan. So the main aquifer captured in Bonoua is the Tertiary sands [3] . Steady-state calibration of Bonoua model gave a normalized RMS which is 4.86% (<10%), indicating that the model is well calibrated [16] . The main adjustment during the manual calibration adopted, consisted in an increase of the recharge value by referring to the climatic conditions of the study area. The recharge calculated from the climatic data of the Adiaké station over 2000-2015 period is 111 mm/year. But the best calibration has been obtained with 140 mm/year as aquifer recharge. Manual calibration was also used by [20] on Abidjan aquifer and obtained a normalized RMS equal to 4.63% and the simulations carried out from this model gave good results. The recharge calculated by [3] over 1980-1999 period was 186 mm/year. The recharge of 140 mm/year is supposed to be representative of the study area in a climate change context. From this value of the recharge, a good correlation between calculated heads through the model and observed heads on the ground was established. However, the assumption on the constancy and recharge uniformity (2000-2020) seems to be an optimistic condition. Thus, the hypothesis stipulating that aquifer recharge would remain constant during the whole simulation (2000-2020) and would be evenly distributed, does not reflect completely the reality of the situation on the ground at all place. Indeed, land use (urbanization) in the study area can make the soil impermeable. The high potency of clays varying from 24 to 40 m [3] , [4] can produce a recharge decreasing in certain sectors of the model as well. But this observation does not question the results obtained. The well calibration of the model is also confirmed by a good correspondence between observed and simulated heads. Differences in some heads may be due in part to the impact of the boreholes exploitation because it should be noted that no piezometers have been used in this study. In addition, boreholes exploitation during piezometric campaigns could disrupt the water level in the boreholes.
The path of the virtual water particles used to determine contribution areas of the new boreholes of Ono and Tchintchebé revealed that all these water particles came from the north of the aquifer. The pollutants transport in the saturated zone of the aquifer is controlled essentially by the flow direction. So the protection zones have been defined exclusively on the basis of this direction, independently of a specific pollutant. However, this assimilation appears to be reasonable for the majority of persistent mobile and water-soluble pollutants [21] . Thus, for the boreholes protection against possible pollution, it is advisable to provide the perimeters of protection. These perimeters are generally delimited on the basis of analytical or numerical models [22] . The latter can be deterministic or stochastic ( [22] , [23] , [24] ). ModPath code of the Visual Modflow software used in this project was used to determine two perimeters of protection (closed and distant). The results that are searched are flow lines and lines of equal transfer time. Indeed, the pathlines (particle path) and the isochronous (line of equal transfer time) are not influenced in steady-state mode ( [17] , [25] ). So Bonoua aquifer model was designed only on steady-state mode.
Each state is responsible for protecting its groundwater and has its own guidelines protection. In the majority of cases, three perimeters of protection; immediate, closed and distant, are distinguished and delimited from analytical or numerical models [22] of the groundwater flow equation. The protection areas dimensions vary according to the country. In France, immediate perimeter of protection is based on a distance of 15 m, in Belgium and Germany it is 10 m, in Holland and in Quebec it is 30 m [21] . In Bonoua area (Côte d’Ivoire), the immediate protection perimeter is 30 m, identical to that used in Holland and Quebec.
In most countries, the immediate perimeter of protection is defined from isochronous period of 50 days (England, Germany and France) or 60 days for a minimum distance of 100 m (Holland, Quebec) [21] . For the Bonoua aquifer model, the 60-days isochronous has been chosen in view of agricultural activities near the new boreholes and the fact that the value of the immediate protection perimeter of Bonoua boreholes is the same used in Holland and Quebec. Thus, for the closed perimeter of protection (CPP), the upstream radius determined varies from 172 to 403 m and 176 to 482 m respectively for Ono and Tchintchébé boreholes. Downstream radius of these same boreholes varies from 112 to 301 m and from 0 to 268 m for the closed perimeters of protection. These values are higher than the minimum distance of 100 m recommended for all boreholes [21] except Tchintchébé F7. For distant perimeters of protection (DPP), 5 to 10 years isochronous in Quebec and 10 to 25 years isochronous can be used to define the dimensions of the zone. Distant perimeters of protection have been determined from a transit time of 9 years. Upstream radius of the boreholes varies from 5554 to 6441 m and from 2877 to 4505 m respectively for Ono and Tchintchébé. These values are all higher than the minimum distance of 800 m recommended. Indeed, in the case of the preventive perimeters of protection, a study according to [21] suggests taking into account of the concession pumping rate, whereas in the case of a protection zone for sanitation, it is better to consider the current mean pumping rate. An overestimation of the perimeter of protection dimensions is desirable because of the increase of the pumping rate exploitation to meet the water needs of the populations and the agricultural activities close to those perimeters. CPP and DPP values obtained are all higher than the recommended values and they can therefore be considered as acceptable. These results are valid in the hypotheses formulated at the beginning of the study.
5. Conclusions
This study was undertaken with the aim of determining the perimeters of protection of Bonoua new boreholes. To reach this objective, groundwater modeling flow of Bonoua aquifer has been designed on Visual Modflow software environment. Model simulation allowed to estimate the hydraulic heads of the boreholes used as piezometers. The calculated heads are near to the observed heads. From this model, considered as calibrated, perimeters of protection (closed and distant), with the spherical form, have been determined. Upstream radius values of closed perimeters of protection vary from 172 to 403 m and from 176 to 482 m respectively at Ono and Tchintchébé boreholes. On the other hand, downstream radius from these same boreholes vary from 112 to 301 m and from 0 to 268 m. Upstream radius values of distant perimeters of protection vary from 5554 to 6441 m and from 2877 to 4505 m respectively at Ono and Tchintchébé boreholes. These values can be used by the Ivorian legislator for the delimitation of the protection perimeters of the boreholes in the sedimentary basin.
Agricultural activities are the main activities carried out inside and/or at the proximity to the perimeters of protection of the new boreholes of Bonoua. Therefore, for a best protection and a good monitoring of the groundwater quality of the Bonoua aquifer, it is recommended to regulate agricultural activities and/or to ban all agricultural activities currently located in the protection areas and the establishment of well-distributed piezometers to facilitate regular monitoring of groundwater level.
Acknowledgements
We hold to express our gratitude to the staff of the National Office of Drinking Water (ONEP), Water Distribution Company of Côte d’Ivoire (SODECI) for giving data. Also we thank the Secretariat of the Strategic Support Program for Scientific Research (PASRES) for funding this study.
Cite this paper
Jean, K.K., Etienne, A.G., Kouadio, K.A., Bernard, D.K. and Patrice, J.J. (2017) Perimeters of Protection Demarcation for New Boreholes of Bonoua Aquifer (Southeastern, Côte d’Ivoire) through Hydrogeological Modeling. Journal of Geo- science and Environment Protection, 5, 118-138. https://doi.org/10.4236/gep.2017.511009
References
- 1. Jourda, J.P., Kouamé, K.J., Saley, M.B., Kouadio, B.H., Oga, Y.S. and Deh, S. (2006) Contamination of the Abidjan Aquifer by Sewage: An Assessment of Extent and Strategies for Protection. In: Xu, Y. and Usher, B., Eds., Ground Water Pollution in Africa, Taylor and Francis/Balkema, London, 291-300.
- 2. Djaa, K.A., Tapé, Z.P. and Karim, B. (2014) Le secteur de l’eau en République de Côte d’Ivoire, dans Swelia, le réseau des entreprises du cycle de l’eau, 15 p. [Water sector in the Republic of Côte d'Ivoire.]
- 3. Aké, G.E. (2001) Evaluation des ressources en eau souterraine de la région de Bonoua, Mémoire de DEA. [Assessment of Groundwater Resources in the Bonoua Region.] Université de Cocody, 72 p.
- 4. Aké, G.E. (2010) Impacts de la variabilité climatique et des pressions anthropiques sur les ressources hydriques de la région de Bonoua (Sud-Est de la Côte d’Ivoire). [Impacts of Climate Variability and Anthropogenic Pressures on Water Resources of the Bonoua Region (South-east of Côte d’Ivoire).] Thèse de Doctorat, l’Université de Cocody en Sciences de la Terre, 207 p.
- 5. Anani, T.A., Kouamé, K.J., Saley, M.B., Anoh, K.A., Deh, K.S., Koua, T.J.J., Effini, A.T., Signo, K.H., Jourda, J.P. and Biémi, J. (2012) Contribution of Multicriteria Analysis and GIS for the Specific Vulnerability Mapping to Agricultural Inputs of Groundwaters in Bonoua Area (Southeast of Côte d’Ivoire). Journal of Page, Engineering Studies and Research, 18, 11-19.
- 6. Delor, C., Diaby, I., Siméon, Y., Yao, B., Tastet, J.-P., Vidal, M., Chiron, J.-C. and Dommanget, A. (1992) Notice explicative de la Carte Géologique de la Côte d’Ivoire au 1/200 000. Feuille de Grand-Bassam. [Explicative Note of Geological Map of Côte d’Ivoire to 1/200 000. Sheet of Grand-Bassam.] Mémoire de la Géologie de Côte d’Ivoire, No. 4, Abidjan, 30 p.
- 7. Karanta, G., Martel, R., Nastev, M., Therrien, R., Lefebvre, R. and Paradis, D. (2001) Etude comparative de méthodes de détermination de périmètres de protection autour des ouvrages de captage dans les aquiferes de roc fractures. [Comparative Study of Determining the Perimeters of Protection Methods around Catchments in Rock Aquifers Fractures.] INRS-Géoressources, Centre géoscientifique de Québec, Commission géologique du Canada, Centre géoscientifique et le Département de géologie et génie géologique, Université Laval, Ste-Foy, Québec au.
- 8. Krijgsman, B. and Lobo-Ferreira, J.P. (2001) A Methodology for Delineating Wellhead Protection Areas. Vrije Universiteit, Amsterdam and LNEC, Lisboa, Laboratorio Nacional de Engenharia Civil. Informaçao de hidraulica INCH7, 81.
- 9. Tastet, J.-P. (1979) Environnements sédimentaires et structuraux quaternaires du Littoral du Golfe de Guinée (Côte d’Ivoire, Togo, Bénin). [Sedimentary Environments and Quaternary Structural of the Gulf of Guinea Coast.] Thèse de Doctorat, d’Etat ès Sciences Naturelles, Université de Bordeau I, no. 621, 181 p.
- 10. HYDROEXPERT (2000) Réalisation d’un modèle hydrodynamique de la nappe Sud-Comoé, 51 p. [Realization of a Hydrodynamic Model of the South-Comoé Aquifer.]
- 11. Leduc, C. (2005) Modélisation hydrogéologique Orsay 2004-2005. [Hydrogeological Modeling, Orsay 2004-2005.] Notes de cours de modélisation numérique en hydrogéologie, 16 p.
- 12. Mac Donald, M.G. and Harbaugh, A.W. (1988) A Modular Three Dimentional Finite-Difference Ground Water Flow Model. USGS, Book 6 Modeling Techniques, A1, Washington DC.
- 13. Waterloo Hydrogeologic (1999) Visual MODFLOW Version 2.8.1. Waterloo, Ontario.
- 14. Anderson, M. and Woessner, W. (1992) Applied Groundwater Modeling and Advective Transport. Academic Press, Inc., London, 234-350.
- 15. Gurwin, J. and Lubczynski, W. (2004) Modeling of Complex Multi-Aquifer Systems for Groundwater Resources Evaluation. Swidnica Study Case (Poland). Hydrogeology Journal, 13, 627-639. https://doi.org/10.1007/s10040-004-0382-9
- 16. Leblanc, Y. (1999) Prédiction de l’effet du décapage d’une mine à ciel ouvert sur l’hydrogéologie locale à l’aide de la modélisation numérique dans Systèmes Geost. [Prediction of the Effect of Stripping an Open Pit on Local Hydrogeology Using Numerical Modeling.] International, Laval, Québec, 23 p.
- 17. Rasmussen, H. and Rouleau, A. (2003) Guide de détermination d’aires d’alimentation et de protection de captage d’eaux souterraines. [Guide for the Determination of Supply and Protection Areas of Groundwater Catchment.] Centre d’étude sur les ressources minérales, Université de Québec à Chicoutimi; Contrat du ministère de l’environnement du Québec, 182 p.
- 18. Verreault, M. (2003) Etude méthodologique pour l’estimation de l’aire d’alimentation de captage d’eau souterraine en milieu complexe. [Methodological Study for the Estimation of the Groundwater Catchment Supply Area in a Complex Environment.] Mémoire présenté à l’Université du Québec à Chicoutimi comme exigence partielle de la maitrise en sciences de la terre, 144 p.
- 19. Bear, J. and Jacobs, M. (1965) On the Movement of the Water Bodies Injected into Aquifers. Journal of Hydrology, 3, 37-57. https://doi.org/10.1016/0022-1694(65)90065-X
- 20. Kouamé, K., Jourda, J.P., Leblanc, Y., Deh, S., Anani, A. and Biémi, J. (2009) Implication of Hydrogeologic Modeling in the Estimate of Pollutants Transfer Time towards Groundwater of Abidjan District: Case of Toxic Waste. European Journal of Scientific Research, 32, 6-24.
- 21. Bussard, T. (2005) Méthodologie de dimensionnement des zones de protection des captages d’eaux souterraines contre les polluants chimiques persistants. [Design of Protection Zones Methodology for Groundwater Catchment against Persistent Chemical Pollutants.] Thèse de Doctorat, Sciences école Polytechnique Fédérale De Lausanne, 220 p.
- 22. USEPA (1987) Guidelines for Delineation of Wellhead Protection Areas. US EPA/440/6-87/010 Report, 212 p.
- 23. Vassolo, S., Kinzelbach, W. and Schaefer, W. (1998) Determination of a Well Head Protection Zone by Stochastic Inverse Modeling. Journal of Hydrology, 206, 268-280. https://doi.org/10.1016/S0022-1694(98)00102-4
- 24. Feyen, L., Dessalegn, A.M., Smedt, F.D., Gebremeskel, S. and Batelaan, O. (2004) Application of a Bayesian Approach to Stochastic Delineation of Capture Zones. Ground Water, 42, 542-551. https://doi.org/10.1111/j.1745-6584.2004.tb02623.x
- 25. Xu, Y. and Tonder, G.J.V. (2002) Capture Zone Simulation for Boreholes Located in Fractured Dykes Using the Linesink Concept. Water SA, 28, 165-169. https://doi.org/10.4314/wsa.v28i2.4882