American Journal of Industrial and Business Management
Vol.08 No.02(2018), Article ID:82595,18 pages
10.4236/ajibm.2018.82021
Impact of Information Technology on the Supply Chain Performance of the Car Segmentation Companies with Emphasis on the Integrity and Flexibility
Mahshid Mashreghi1, Ebrahim Kalani1,2, Alireza Elhami2, Abas Farajpoor Alamdari2, Iraj Bakhtiyari2, Ehsan Kamrani3
1Department of Industrial Engineering, Tarbiat Modarres University, Tehran, Iran
2Department of Management, Khatam Al-Anbiya University, Tehran, Iran
3Institute of Medical Science and Technology, Shahid Beheshti University, Tehran, Iran

Copyright © 2018 by authors and Scientific Research Publishing Inc.
This work is licensed under the Creative Commons Attribution International License (CC BY 4.0).
http://creativecommons.org/licenses/by/4.0/


Received: December 21, 2017; Accepted: February 23, 2018; Published: February 26, 2018
ABSTRACT
Companies are struggling in a highly competitive environment to accelerate their operations and operations. Discussions such as globalization and the expansion of networks such as the Internet are important issues that affect the resources, marketing, and other issues that companies engage with. The effects of information technology in industries, in the supply chain areas and in the value chain, are evident from the relationship with suppliers to production and communication with customers, including the impact of information technology on the supply chain performance. The purpose of this study was to investigate the relationship between information technology variables, integration and flexibility function in the automotive supply chain and the effect that information technology has on the supply chain performance. After collecting the data through a questionnaire from automobile manufacturers and analysis of the obtained model, the results show that the information technology which in this research includes the Internet, the organization’s network systems and combine system has a positive and direct effect on integration and flexibility. These results indicate that the use of information technology increases the integrity and flexibility of supply chain components and improves communication between them.
Keywords:
Information Technology, Supply Chain, Integrity, Performance, Flexibility

1. Introduction
Today, the existence of global competition to capture the market on the one hand and resource constraints on the other, necessitates the need to pay attention to the use of various aspects of information technology (IT) in global organizations. Information technology is one of the important environmental factors that have serious effects on the success, performance and fate of societies, organizations and individuals [1] [2] [3] . In general, the supply chain consists of two or more organizations that are formally separated from each other and are related to each other through the flows of materials and information [4] [5] . These organizations can be firms that produce raw materials, components, end products, or services such as distribution, storage, wholesaler and retailer [6] [7] [8] . Even the final consumer himself can be considered one of these organizations [9] [10] [11] [12] . Companies in the global class relate many of their successes to supply chain management, widely supporting information technology.
2. Explanation of the Problem
The importance of using information technology in a report by M. Roberts in 2000 [13] indicates a reduction of 8% - 35% in supply chain costs, 22% - 85% reduction in inventories, 12% - 42% improvement in deliveries, and 17% - 68% improvement in time cycle. For this purpose, managers must familiarize themselves with the new methods so that they can get closer to their goals by making better coordination with suppliers and consumers. Supply chain management is based on a customer-centric approach, therefore the timely and complete communication between all the elements of the chain is required to meet the needs of the customer and the extent of meeting the supply chain needs [14] [15] [16] . In order to facilitate the flow of information and its accurate management, an appropriate set of integrated software and information systems and Extranet and Intranet networks are needed [17] [18] . Considering the importance of finding information technology in the supply chain and its positive impacts, this study attempts to examine its impact on supply chain variables [19] [20] [21] [22] . The purpose of this study is to investigate the impact of information technology on performance variables, integrity and supply chain flexibility, and for other purposes of this research, it is possible to name the measures of performance measurement, integration and flexibility in the supply chain of the automobile segmentation companies [23] [24] [25] [26] .
3. Research Methodology
In terms of nature and method, the present study is a descriptive study and we investigate the existing situation using field research and library method.
3.1. Research Statistical Society and Sample
The statistical population in this research is the automotive parts companies in a province of Iran, Khorasan Razavi, which are cooperating with ISKO affiliated with Iran-Khodro. The total number of these companies is 50. They were randomly assigned to the sample questionnaire. In order to conduct the research, in addition to the above resources, a questionnaire was also used. With the help of experts, professors and experts working on the creation of a questionnaire, a questionnaire with 40 questions was developed. Each of the variables was measured using the Likert scale. After assessing the validity and reliability of the questionnaire, the number of questions reduced to 32. After collecting about 94 questionnaires and reviewing them, 86 questionnaires were analyzed based on the statistical sample size.
3.2. Selection of Statistical Sample
Considering that the evaluated variable in this research is measured on the basis of a ratio scale, we can use the following relationships to determine the sample size:
(1)
(2)
In these relationships, r is the upper limit of the relative error that is predetermined, N is the number of people in the community, S and are the parameters of the society, which if not known, should be derived from the preliminary sample of their estimation, and Z is the length of the corresponding point of the cumulative probability of or percentile th of the normal distribution Standard. As mentioned above, for substitution of Z and , in the above relations, because of the uncertainty of the variance values and the average of the variable of IT in society, we use a preliminary sample (pre-test). At this stage, according to a preliminary sample of 15 members, and , an estimated 150 population and a coefficient of error r = 0.01 with a confidence coefficient of 99%, ( ), are obtained. In fact, the required specimen was considered 86. The reliability of the questionnaire used in this study was Cronbach’s alpha coefficient. The relation between Cronbach’s alpha is as follows:
(3)
In which the is Cronbach’s Alpha coefficient, k is the number of
questions, is the sum of the variances in each of the questions, and is
the variance in all the questions. To test the reliability of the questionnaire after performing a Cronbach’s alpha, each of the variables was calculated separately. The Cronbach’s alpha was 0.82, the integration coefficient was 0.91, the flexibility variable was 0.87, but Cronbach’s alpha information technology was about 0.5, which eliminated questions Inaudible Cronbach alpha has been changed to 0.76.
4. Descriptive Analysis
4.1. Descriptive Analysis of Respondents’ Viewpoints Regarding to the Independent Information Technology Variable
Considering that the main variable of this research is Information Technology (IT), in the first step, the descriptive study of this variable and the behavior of the constructors of this variable are discussed. Figure 1 shows the distribution of responses to the variables of the information technology. This chart illustrates the fact that approximately 82% of respondents use the Internet a lot on a daily basis. 52% of respondents use a lot of networked software. Similarly, the selection of “high” and “very high” options in 61% of respondents indicates the high efficiency of the combine system in the supply chain. Therefore, considering the table and observing the high percentage of the vast majority of questions for “high” and “very high” options, we notice the application and high requirements of information technology in the industrial processes. As you can see in the graph, the space occupied by each column is high for the other two options.
Table 1 describes the characteristics of the information technology variable. The results of the table indicate the high concentration of this variable or, in other words, the small dispersion of this variable from the mean. As we know, this variable is obtained according to the Likert scale and the mean of responses. As a very low-number of one, a small number of two, an average of three, a high number of four, and a very large number of five. Therefore, the smallest amount this variable can have is one and the maximum is five, but according to the focus mentioned above and the relatively low standard deviation of this variable, the
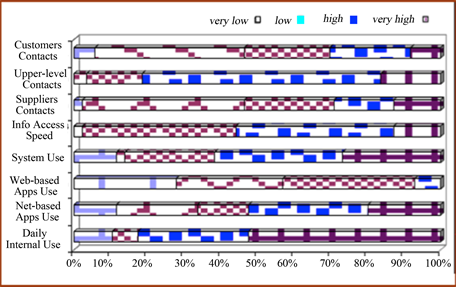
Figure 1. Percentage of percentage of respondents’ views about IT indicators.

Table 1. Indicators of the independent information technology variable.
minimum score is 2.33 and the maximum is 4.56.
4.2. Descriptive Analysis of Respondents’ Viewpoints regarding to the Dependent Variable of Supply Chain Performance
In Figure 2, we see the distribution of the frequency of the responses presented to the variables of the supply chain variable. For example, 79% of respondents believe that using IT greatly increases the timely completion of processes in the supply chain. Also, 60% of them believe that information technology reduces product delivery time to customers, and 50% of them consider IT to be highly effective in improving the quality of products and services provided to consumers. Figure 2 also confirms the explanations provided for the responses given to the variables of the supply chain performance variable. It can be seen that in all of the horizontal columns of the graph, the sections relating to “high” and “very high” options than the rest of the dedicated space. So we can imagine the high impact of information technology on the supply chain performance. Table 2 describes the descriptive indicators of the dependent variable of the supply chain performance and reports the behavior of this variable intuitively. It’s worth noting that all the numbers presented in the table only represent sample indices and can not yet be extended to the community of automotive parts manufacturers. The reported numbers in Table 2 indicate that the supply chain performance variable is much more distributed than the average for the information technology variable. The score of 2.50 also confirms this to 2.3. (The score is a fraction of the minimum score of the maximum score).
4.3. Descriptive Analysis of Respondents’ Viewpoints regarding to the Dependent Variable of Supply Chain Integration
Figure 3 shows the distribution of the frequency of the responses provided to the variables of the supply chain. In most of the responses, respondents by choosing a large number of alternatives, as a source of information, are somehow effective in integrating the supply chain. For example, in the first question of this variable, 71% of accountable experts believed that the use of IT greatly contributed to the coordination of information between them and the supply chain partners. Also, 84% of the experts believe that the use of information technology reduces the cost of the coordination mentioned uses it. Also, on average, 88% of these experts have come to the conclusion that information technology, or IT, has created better coordination in predicting market demand. With a little more carefulness in the answers to the questions posed by the variability of the supply chain integration, we find that most of the vast majority of accountable experts in the existing sample, believing that if they use information
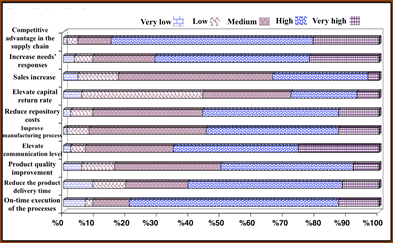
Figure 2. Percentage volumes of respondents’ views on supply chain performance indicators.
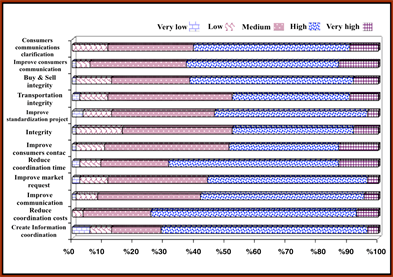
Figure 3. Percentage of volumes of respondents’ views about supply chain integration indices.
Table 2. Descriptive indicators of the dependent variable supply chain performance.
technology, can greatly improve the integrity of their organization’s supply chain, they will use it. In one of the most important questions, 60% believed that information technology had clarified communication with consumers in the supply chain. The explanations presented above are clearly and prominently shown in Table 3. This confirmed by the fact that in all the horizontal columns, the column Figure 3, duplicated to the right of the column representing the space of “high” and “very high” options, occupies most of the column. Therefore, from the graph it is easy to guess the opinion of the experts about the
Table 3. Descriptive indicators of the associated variable supply chain integrity.
impact of information technology on the supply chain integrity and stated that at least in the existing IT sample, the positive effect was on the integrity variable. In order to generalize this statement to the vehicle manufacturers community, we will test it in the inferiority section. The table describes the three variables of the supply chain integrity variable and examines the numbers presented in the table.
Given the fact that the number 3 in the answers provided shows the average option score, we can say that the mean of the integrity variable is higher than the average and upward. This mean is greater than 3 indications of the positive impact of information technology on the supply chain integration in this sample, which is decided in the inferential section to generalize this point to the community. Also, the relatively low standard deviation in the integration variable of this sample suggests that the average presented in the table can be largely relied on and thus it is stated that most of the answers given are around the mean of the sample.
4.4. Descriptive Analysis of Respondents’ Viewpoints on Supply Chain Flexibility
Figure 4 reports the status of the responses to the flexible formulation questions. Referring to the chart, we are accountable for the high impact of information technology on the supply chain flexibility from the point of view of the experts. If we look more closely at Figure 4, in most of the questions, more than 50% of the responding experts have chosen “high” and “very high” choices. This is clearly visible in the graph. For example, in the first question of this variable, 53.5% of the experts agree that information technology is highly influenced by the ability to change the order of consumers, or that about 51% of them believe that this technology will enable them to change. The delivery schedule has increased based on the needs of consumers.
Table 4 describes the descriptive indicators of the supply chain flexibility. As described in the descriptive indicators of the supply chain integration variable, the mean of over 3 means the beliefs of the experts that respond to the high impact of information technology on the supply chain flexibility. Given that the average reported in the table above is 3.162, it can be said that in this sample IT respondents consider the supply chain to be flexible.
5. Inferential Analysis of the Research Variables
In this section, we examine the inferential variables and try to test all the results obtained in the descriptive study of the variables inferential and to decide on the generalization of these results to the automobile component community. Therefore, all assumptions are tested in later sections, which are supposed to be
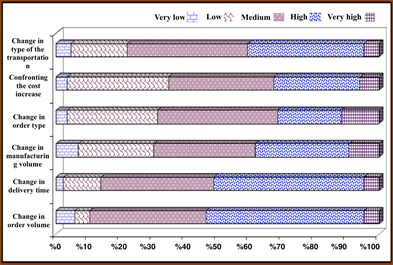
Figure 4. Percentage of respondents’ views on supply chain flexibility indicators.
Table 4. Descriptive Indicators of the Associated Variable Supply Chain Flexibility.
explained and interpreted. Most research often begins with questions and hypotheses. A kind of inferential statistics technique used to answer research questions is “statistical estimation,” according to which it has to pass through the questionnaire and construct a statistical hypothesis. The guesses hypothesis is about the population parameter and the appropriate statistical techniques for checking the validity of the hypotheses are the “statistical test hypothesis”.
In general, the purpose of the statistical hypothesis test is to determine whether, according to the information obtained from the sample data, the conjecture that has been confirmed about the attribute of the community is confirmed. This conjecture as a research goal typically contains a claim about the value of a community parameter. In fact, every ruling about society is called a statistical hypothesis that its acceptability should be investigated based on information obtained from sampling of society. Because the claim may be correct or false, then there are two complementary assumptions in the mind: the assumption (usually the opposite of the claim), and the assumption (usually asserted in it). Therefore, according to the information obtained from the sample, the decision maker must choose one of two decisions or inferences:
1) Reject and conclude that is verified by the data.
2) Do not reject and conclude that is not approved by data.
The process of choosing one of these two decisions is called statistical test. The most important step in the test of statistical hypothesis is to convert the “question or research hypothesis” into a “statistical hypothesis” [26] . The preliminary assumptions in this research examine the impact of information technology on the three variables of supply chain performance, supply chain integration, and supply chain flexibility.
In this regard, it is stated that, according to the experts of the automobile manufacturing industry:
1) Information technology is effective in supply chain performance.
2) Information technology is effective in the integrity of the supply chain.
3) Information technology is effective in supply chain flexibility.
4) Integration in supply chain performance is effective.
5) Flexibility in the supply chain performance is effective.
5.1. Inference on H1 Hypothesis
In the first step, we will examine the inferential statistics of the first hypothesis (hypothesis 1) proposed in the previous section. If we want to decide on the effect of the IT or IT variable on the supply chain performance variable, we must examine the correlation coefficient of these two variables and make a relevant statistical test regarding the significance of this correlation coefficient. In this regard, using Pearson correlation coefficient test, we examine the existence or non-existence of linear relationship between these variables. Therefore, we present the statistical hypothesis as follows.
Which X indicates the variable of information technology and Y indicates the variable of supply chain performance. To test the above hypothesis, the following test statistic is used:
(4)
In this case, n is the sample size and r is the correlation coefficient of the Pearson sample are calculated using the following equation:
(5)
Accordingly, after calculating of for judgment of the zero assumption, we must obtain the value of from the t-student table (this value is obtained with respect to the length of the corresponding point of with the cumulative probability ( ) or percentile of the t-student distribution with the degree of freedom) which, as in the present study, and are considered from t-student and to be derived from the table. Therefore, in order to make a decision to reject or accept the null hypothesis, we can use the relation if then (the assumption of zero is rejected) or, if we calculate P-value, we can use the relation if then (the assumption of zero is rejected).
According to the above explanations, is larger than the test statistic mentioned above. Also, relation established, there is a relationship and the assumption that the information technology does not affect the supply chain performance can be assumed to be zero, and so it has been assumed that information technology affects the supply chain performance. Therefore, considering the correlation coefficient in Table 5 and the results of the test, it can be assumed that information technology has a positive effect on the supply chain performance and has increased the ability to supply the supply chain. Distribution shown in Figure 5, also draws a linear relationship between these two variables.
5.2. Inference on the H2 Hypothesis
In the second hypothesis, the existence or non-existence of a linear relationship between the two variables of information technology and the integrity of the supply chain is examined. This hypothesis is presented as follow:
H0: Information technology affects the supply chain integrity.
H1: Information technology does not have an effect on the integrity of the supply chain.
We now look at and examine the implications of deciding whether to accept or reject the table in Table 6, where test results are included.

Figure 5. Distribution scale between it scores and supply chain performance.
Table 5. Investigating the Linear Relationship between Two-Tier Information Technology and Supply Chain Performance.
Considering the explanations in the previous section about the correlation coefficient test and also the results of the table, it should be said that if then the assumption of zero is not confirmed, and in the second hypothesis it should be stated that information technology affects the supply chain integrity. Also, since the Pearson correlation coefficient reported in the table is equal to 591 and greater than zero, it can be stated that information technology has a positive and upward effect on the supply chain integrity. Figure 6 illustrates the distribution of the two variables of information technology and supply chain integrity.
5.3. Inference on the H3 Hypothesis
If the third main hypothesis, or the hypothesis of IT communication and supply chain flexibility, is confirmed, IT can play a role in the function, integrity and flexibility of the supply chain. Therefore, in order to authorize such a claim about this role, we present the third main hypothesis as follows:
We can see Table 7 and compare the test statistic with or compare of P-value with everything for the rejection of the zero assumption, and we state that information technology affects the supply chain flexibility. Given the fact that the impact of information technology on the supply chain flexibility is established, and given that the Pearson correlation coefficient for these two variables is a positive number and greater than zero
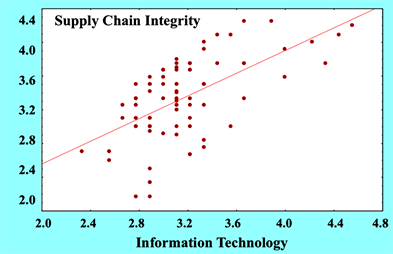
Figure 6. Distribution scale between it scores and supply chain integration.
Table 6. Investigation of the linear relationship between two-turnaround information technology and supply chain integrity.
Table 7. Investigating the linear relationship between information technology and supply chain flexibility.
( ), it can be stated that the effect of information technology on the supply chain flexibility One effect is positive, and the more IT is used and the more accurate programming, the more flexible the supply chain is, the more clearly it is seen in the image of the image in the distribution chart in Figure 7. By examining the three initial hypotheses, it should be concluded that IT has a positive effect on the three variables of the performance, integrity and flexibility of the supply chain, and their increase.
5.4. Inference on the H4 Hypothesis
In this section, we examine the relationship between the two variables of supply chain function and integration and decide on the significance of this relationship by testing the three initial hypotheses. Table 8, shows the factors associated with this test.
H0: Integration in supply chain performance is not affected.
H1: Integration in the supply chain performance is affected.
The test statistic and reported P-value in the table indicate a rejection of the assumption that there is no effect on the supply chain performance, and it should be noted that due to the rejection of the zero assumption and the reported Pearson coefficient in the table, supply chain integrity has a positive effect on the supply chain performance. By increasing the score in this variable, a high-ranking supply chain can be achieved. In Figure 8, the two variables are plotted to illustrate the distribution of this statement.
5.5. Inference on the H5 Hypothesis
This hypothesis, as shown in Table 9, examines the existence or absence of a linear relationship between the two performance variables and the supply chain flexibility that is expressed in the following way:
H0: Flexibility in the supply chain operation is not affected.
H1: Flexibility in the supply chain operation affects.
The numbers reported in the table indicate the rejection of the zero assumption and the existence of a positive linear relationship between the two supply chain performance variables and the supply chain flexibility. In Figure 9, which
Table 8. Investigation of linear relationship between two-turnaround performance and supply chain integrity.
Table 9. Investigation of linear relationship between two-way performance and flexible supply chain.
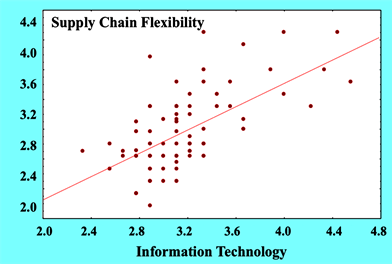
Figure 7. Distribution scale between it scores and supply chain flexibility.
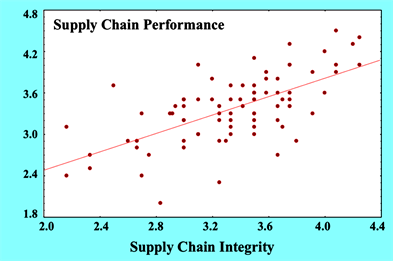
Figure 8. Distribution score between performance scores and supply chain integration.
shows the distribution of these two variables, the existence of this positive linear relationship is clearly seen.

Figure 9. Distribution scale between performance points and flexible supply chain.
6. Regression Analysis
After examining the relationships between each of the variables of the research with the information technology variable, it was found that there is a significant linear relationship between the variable of information technology with the variables of performance, integrity and flexibility of the supply chain (main research questions). But the discussion here is whether these variables (simultaneously) can be related to the dependent variable by taking into account the effect of the interacting factors of independent variables with each other? Therefore, in this section, the simultaneous effect of three independent variables of this research on the dependent variable (information technology) is evaluated and multivariate regression is used for this purpose. Regression analysis is a method used to study the relationships between variables, and in particular understanding the dependence of one variable on other variables. Linear regression model is based on hypotheses. After estimating regression coefficients and fitting the regression line, the validity of these assumptions should be checked, in order to ensure the reliability of its results as much as possible. Based on this, Darwin-Watson statistics are used to study the lack of self-correlation between the residuals, the normal probability diagram to check the normality of residues, and the fitted-value graph of the residuals to verify the variance constant.
In order to measure the coherent relationship between the three variables of performance, integrity and flexibility of the supply chain with the information technology variable, a multivariable regression model with three independent variables is fitted on the data, and the least squares error method, one of the common methods for estimating model parameters Is used to estimate regression coefficients. The steps are performed by statistical software and a summary of the results is reported in Table 10. Therefore, by looking at this table, the final regression model is reported
According to the probability value of each of the regression coefficients, it is
Table 10. Summary of multivariate regression model.
clear that the constant of the regression (the width of the origin) and all three variables of performance, integration and flexibility of the supply chain are significant in the model. Also, the amount of regression coefficient that is obtained in and its approximate equality with the amount of adjusted adjustment coefficient ( ), expresses the absence of unnecessary independent variables in the model, and confirms the results. Therefore, the final regression model is fitted as follows.
In which,
: the fitted value of the dependent variable of information technology,
: is the variables of the supply chain performance scores,
: the variables of the supply chain integration, and
: the variables of the supply chain flexibility.
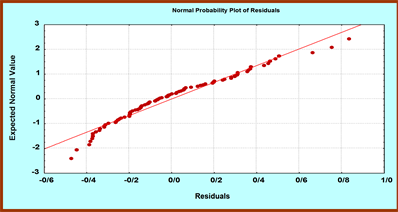
As previously stated, these basic assumptions in the regression include the lack of self-correlation of the remainders, the normalization and the constant of their variance. To study the validity of the first hypothesis, the Darwin-Watson statistic has been used. According to the findings, the value of the Darwin- Watson statistic is 1.565, which confirms this non-correlation between the residues. The other two conditions are also examined by plotting the normal probability charts of the residues and the charts of gravity values against the residuals.
In the analysis of the diagram of Figure 10(a) or the graph of the fitted values against the residuals, as the points are randomly distributed around the zero line and do not show a particular trend or state, the assumption of the constant of the variance of the remainders is also not compromised and acceptable. Because in the graph of Figure 10(b) or normal probability charts, the residuals of the points are located almost in the same direction, so the normality of the remainders is not questioned. Therefore, in general it can be assumed that the fundamental hypotheses of regression are significant and fitted regression and presented model is correct and has a license.
7. Conclusions
Today, the role, importance and status of information is obvious to everyone. Proper circulation and proper transmission of information will make the
 (a)
(a) (b)
(b)
Figure 10. (a) Characterized gradient values against multiplier regression residues (b) Normal probability charts of residues obtained from the fitting of the multivariate regression model.
processes more efficient and efficient, and make their management easier. In the supply chain discussion, the importance of coordination in activities is very important. This point is also true in the management of information in the supply chain, information system management and information transmission. The purpose of this study was to investigate the impact of new technologies such as the Internet and software that provide a faster and better communication between supply chain components. The results of data analysis showed that information technology has a positive effect on the supply chain performance. Whatever is considered as information technology in the supply chain of component makers and the criteria of each of the variables of the research were presented and summarized. The results show the relationship between independent information technology variable and dependent variables of performance, integrity and flexibility. The results of this research can be divided into two parts: the first part is the criteria based on the study of past research and coordination with the companies investigated and experts’ view to assess the variables of integration function and flexibility in the chain. The supply was made in a questionnaire. The second part confirms the research hypotheses and confirms previous research after collecting questionnaires, analyzing them and using statistical software like SPSS. The hypotheses in this research was to examine the effect of information technology on three variables of supply chain performance, supply chain integration and supply chain flexibility.
It is stated in this way that according to the experts of the automobile manufacturing industry:
1) Information technology is effective in supply chain performance.
2) Information technology is effective in the integrity of the supply chain.
3) Information technology is effective in supply chain flexibility.
4) Integration in the supply chain operation is effective.
5) Flexibility in the supply chain performance is effective.
All hypotheses were proved based on descriptive analyzes as well as inferential tests. Descriptive analyzes indicate the respondents’ opinion that the high average of total questions indicates the importance of using information technology in each of the supply chain variables. Inference should be used to generalize the results to the vehicle manufacturer’s community.
Acknowledgements
The research has been supported by TarbiatModarres University, ShahidBeheshti University, and Khatam Al-Anbiya University of Tehran.
Cite this paper
Mashreghi, M., Kalani, E., Elhami, A., Alamdari, A.F., Bakhtiyari, I. and Kamrani, E. (2018) Impact of Information Technology on the Supply Chain Performance of the Car Segmentation Companies with Emphasis on the Integrity and Flexibility. American Journal of Industrial and Business Management, 8, 341-358. https://doi.org/10.4236/ajibm.2018.82021
References
- 1. Alvani, S.M. and Nasrollah, M. (2008) Production Management. 10th Edition, Astan Quds Razavi Publishing.
- 2. Rood, I. (1996) Another Look at Industrial Export. Industry and Development, No. 9.
- 3. Mahdi, S. (2006) TadinShabnam, Information Technology Management.
- 4. Hejazi, A. (2008) Application of Organizational Portals in Supply Chain Management. Second International Conference on Supply Chain Management and Information Systems.
- 5. Khaki, G. (2003) Research Method with Approach to Thesis Writing.
- 6. Dahft, R.L. (1998) Theory and Design of the Organization, Ali Parsaeian and Seyyed Mohammad Arabi. Publishing the Office of Cultural Research.
- 7. Armistead, C.G. and Mapes, J. (1993) The Impact of Supply Chain Integration on Operating Performance. Logistics Information Management, 6, 9-14. https://doi.org/10.1108/09576059310045907
- 8. Brynjolfsson, E. and Yang, S. (1996) Information Technology and Productivity: A Review of Literature. Advances in Computers, 43, 179-214. https://doi.org/10.1016/S0065-2458(08)60644-0
- 9. Aviv, Y. (2001) The Effect of Collaborative Forecasting on Supply Chain Performance. Management Science, 47, 1326-1343. https://doi.org/10.1287/mnsc.47.10.1326.10260
- 10. Bagchi, P. and Skjoett-Larsen, T. (2003) Integration of Information Technology and Organizations in a Supply Chain. The International Journal of Logistics Management, 14, 89-108. https://doi.org/10.1108/09574090310806477
- 11. Bayraktar, E., Demirbag, M, LennyKoh, S.C., Tatoglu, E. and Zaim, H. (2009) A Causal Analysis of the Impact of Information Systems and Supply Chain Management Practices on Operational Performance: Evidence from Manufacturing SMEs in Turkey. International Journal of Production Economics, 122, 133-149.
- 12. Bagozzi, R.P. and Yi, Y. (1988) On the Evaluation of Structural Equation Models. Journal of Academy of Marketing Science, 16, 74-94. https://doi.org/10.1007/BF02723327
- 13. Roberts, M. (2000) The Dawn of Next-Generation Digital Supply Chains. Chemical Week, Chemical Week Associates, New York, S8-S10.
- 14. Beamon, B.M. (1999) Measuring Supply Chain Performance. International Journal of Operations & Production Management, 19, 275-292. https://doi.org/10.1108/01443579910249714
- 15. Brito, C. and Nogueira, M. (2008) Capabilities Exchange through Business Interaction: An Empirical Investigation of a Client-IT Supplier Relationship. Journal of Purchasing and Supply Management, 15, 227-239.
- 16. Ayers, J.B. (2000) Supply Chain Management.
- 17. Barua, A., Konana, P., Whinston, A.B. and Yin, F. (2004) An Empirical Investigation of Net-Enabled Business Value. MIS Quarterly, 28, 585-620. https://doi.org/10.2307/25148656
- 18. Cachon, G.P. and Fisher, M. (2000) Supply Chain Management and the Value of Shared Information. Management Science, 46, 1032-1048. https://doi.org/10.1287/mnsc.46.8.1032.12029
- 19. Clark, T.H. and Lee, H.G. (2000) Performance, Interdependence and Coordination in Business-to-Business Electronic Commerce and Supply Chain Management. Information Technology and Management, 1, 85-105.
- 20. Devaraj, S. and Kohli, R. (2003) Performance Impacts of Information Technology: Is Actual Usage the Missing Link? Management Science, 49, 273-289. https://doi.org/10.1287/mnsc.49.3.273.12736
- 21. Gang, W., Juanzi, L., Ling, F. and Kehong, W. (2008) Identifying Potentially Important Concepts and Relations in an Ontology and Relations in an Ontology. 7th International Semantic Web Conference, Karlsruhe, 26-30 October 2008, Lecture Notes in Computer Science, Vol. 5318, 33-49. https://doi.org/10.1007/978-3-540-88564-1_3
- 22. Gunasekaran, A., Williams, H.J. and McGaughey, R.E. (2004) Performance Measurement and Costing System in New Enterprise. Technovation, 25, 523-533.
- 23. Ha, S.H. and Ramayya, K. (2007) A Hybrid Approach to Supplier Selection for the Maintenance of a Competitive Supply Chain. Expert Systems with Applications, 34, 1303-1311.
- 24. Hill, C.A. and Scudder, G.D. (2002) The Use of Electronic Data Interchange for Supply Chain Coordination in the Food Industry. Journal of Operation Management, 20, 375-387. https://doi.org/10.1016/S0272-6963(02)00017-7
- 25. Holten, R. and Dreiling, A. (2006) Provision of Customer Knowledge to Supply Chains. German Federal Ministry of Education and Research.
- 26. Azar, A. and Momeni, M. (2006) Application of Statistics and Management. Volume 2, 5th Edition, SAMT, Tehran, 1-324.