Open Journal of Civil Engineering
Vol.08 No.04(2018), Article ID:89010,11 pages
10.4236/ojce.2018.84034
Evolution of the Deflection According to Truck Overloading―Comparison between Benkelman Beam Method and FEM of Lateritic Pavements
Fatou Samb*, Ndiassé Diop, Baye Birane Thiam, Makhaly Ba
Laboratoire de Mécanique et de Modélisation, UFR Sciences de l’Ingénieur, Université de Thiès, Thiès, Sénégal

https://doi.org/10.4236/ojce.2018.84034
Copyright © 2018 by authors and
Scientific Research Publishing Inc.
This work is licensed under the Creative Commons Attribution International
License (CC BY 4.0).
http://creativecommons.org/licenses/by/4.0/


Received: November 7, 2018; Accepted: December 4, 2018; Published: December 7, 2018
ABSTRACT
The study of the deflection due to the passage of an axle on a pavement structure has the advantage to make possible to pronounce on the portance, the rigidity and the homogeneity of this one. In the case where the allowed axle load is not respected, surface deflection leads to premature deterioration of the roadway. In order to study the evolution of these deformations, deflection measurements were made by using the Benkelman method in the Fatick-Kaolack road in Senegal by varying the axle load with the following values: 10, 13 and 16 tons on three different zones. The results show a linear evolution of the deflection as a function of the axle load. Also, the impact of truck overloading was studied by considering different values of the axle load with comparison to the allowed axle load by using frequent types of vehicle. A numerical simulation of the Cast3M pavement was done first, in the case of an isolated single wheel with a radius of 12.5 cm, then in the case of an equivalent dual wheel with a radius of 18.1 cm for loads of 10 to 19 tons. In the same way, the pavement design software (ALIZE) is used to analyse the variation of the axle load. The results show a linear evolution of the deflection, which corroborates the measurements made in the field and those obtained by Samb (2014) with a slope coefficient equal to 1.7. Nevertheless, the case of an isolated single wheel of 12.5 cm radius is closest to the measurements with a straight line of slope coefficient equal to 1.9.
Keywords:
Deflection, Axle, Overload, Truck Overloading, Cast3M, ALIZE, FEM, Lateritic Gravel

1. Introduction
The prediction of road degradation is one of the most important points for road pavement design. According to Cruse and Skoke (1968) [1] , the variations of pavement strength throughout the year have been studied with the Benkelman beam each year since 1964. Studies of this relationship were reported by the Canadian Good Road Association (CGRA) and from the AASHO Road Test (1962) [2] . Considering these reports and the theoretical relationships developed from Boussinesq and Two-layer Elastic systems, it was decided that assuming a straight line relationship between loads and deflections would be satisfactory. In Senegal, the rehabilitation of roads initially built for a 15-year life span was a necessity. This is the case of the Fatick-Kaolack section of the Dakar-Bamako corridor, which in 2005, only one year after it was commissioned, exhibited degradations of varying intensity and magnitude that affected the entire road. For this purpose, one of the causes of this rapid deterioration seems to be related to the phenomenon of axle overload. Therefore, the prediction of the effect of Truck overloading and the evaluation of the deflections involved is an important issue as they can allow improving pavement design methods. This paper aims to study the evolution of the deflection as a function of the axle load. Therefore, deflection measurements were conducted on the newly constructed Fatick-Kaolack pavement by varying the axle load of 10, 13 and 16 tons and then comparisons were made with the results of the FEM of flexible lateritic pavement and truck overloading analysis (Samb, 2014 [3] ; Samb, 2015 [4] ) with consideration to the equivalent section the software Cast3M and the results obtained by the rational method with the Alizé Software. It is to note that correlations were to be made with the extreme overload recorded on the weighing stations.
2. Materials and Method
The principle of the point deflection measurement consists in reproducing the solicitation of the roadway due to the passage of a heavy vehicle and in measuring the reaction of the roadway. There are different devices for measuring the surface deflection: displacement sensor, measuring beam, deflectograph, inclinometer systems, Curviameter, ball deflectometer. The apparatus used to perform the deflection measurements is the Benkelman beam (NF P 98-200-2, 1992 [5] ). The Benkelman beam is a deflection-measuring device developed in 1953 by A.C. Benkelman of the Bureau of Public Roads. This device was introduced during the WASHO road test (1954 [6] , 1955 [7] ). The Benkelman beam measures at a given point of the roadway the deflection caused by a wheel load. Measurements are carried out in an ad hoc manner on thick flexible and bituminous roads. The Benkelman beam comprises a reference beam provided with two fixed supports and an adjustable support. A measuring beam freely pivots around a transverse axis integral with the beam, a comparator which is fixed to the measuring beam, and an electromagnetic vibrator (Figure 1). The measurement consists of fixing or laying at the point of the roadway to be measured a sensor intended to measure a vertical displacement at this point. The sensor is gradually approaching a rolling load which, at a given moment, passes in the immediate vicinity of the latter and then moves away from it. The moving load induces a deflection basin. The area of this area and its depth (amplitude) depends on the type and condition of the structure and the value of the load. The maximum value of the measured displacement is called maximum deflection (in 1/100 mm). The measurement step, which must be adapted to the visual heterogeneity of the roadway, must be less than or equal to 50 m. In practice in Senegal, it is often done a test on the beam every 50 m staggered (axis, right, left). When a heavy goods vehicle is traveling on a roadway, it causes occasional vertical movements on the different layers of the roadway (NFP 98 200-1, 1991 [8] ). The deflection is defined in unit length, in practice it is measured in micrometers. Figure 2 shows a deflection basin can be represented as the area between the roadway to its initial state and the deflection curve induced by a load (vehicles).
Measurements were made under an axle load of 10, 13 and 16 tons over a linear one kilometer (PK21 + 500 to PK22 + 500) cut into three zones. In each zone, seven measurements of fifty meters apart were made in staggered rows (Figure 3). The results have been subdivided into “homogeneous” sections with calculation of mean, standard deviation and characteristic d90 deflection by zone. The pavement structure on which the deflection measurements were made is shown in Figure 4.
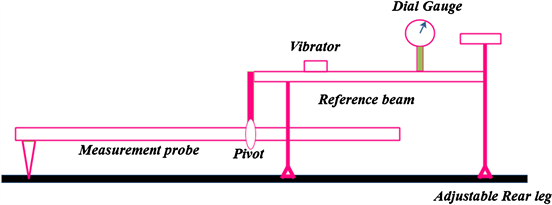
Figure 1. Schematic diagram of the Benkelman beam (L.N.T.P., 2007 [9] ).

Figure 2. Mechanism of degradation by the traffic (DLC, 1998 [10] ).

Figure 3. Distribution of staggered measurements on a section of 350 m.

Figure 4. Fatick-Kaolack road section.
3. Results and Discussion
3.1. Results of Deflection Measurement by Benkelman Beam Method and Determination of the Characteristic Deflection
The results of the deflection measurements from the Fatick-Kaolack road with modulation of the axle load of 10, 13 and 16 tons are given in Table 1.
The results showed that the values read on the beam in the case of the load of 10 tons to the axle vary between 7 and 16. They are maximum on the sides and minimum on the axis. In the same way it is found that the values read on the beam in the case of the loading of 13 and 16 tons to the axle vary respectively between 5 to 19 and 4 to 24. They are maximum on the sides and minimum on the axis. Therefore, the deflection seems to increase as a function of the axle load.
The characteristic deflection of the homogeneous zone is the arithmetic mean of individual value, to which is added the standard deviation of the distribution of values multiplied by a coefficient (K for example). The representative deflection will have the value d90 at which 10 percent of the results are considered

Table 1. Results of deflection measurements from PK21 + 050 to PK22 + 050 with load variation.
superior. And for the calculations, the formula used is given by the following relation (Bolivar Lobo Carneiro, 1966 [11] ):
where dm is the average deflection and is the standard deviation.
Figure 5 represents the evolution of the deflection of the three zones as a function of the axle load. Also, Table 2 gives the slope and correlation coefficient.
It can be seen that deflection increases with the increase of the axle load, and the trend of these curves shows a linear evolution with slope coefficients of straight lines equal to 1.7. However, the variation of the deflection is not regular, which is why in zone 3 there is a slight increase of the deflection between 10 tons and 13 tons, then a sharp increase for 16 tons, hence the coefficient of determination R2 is equal to 0.8033. The latter determines how well the regression equation is

Figure 5. Evolution of the deflection with the axle load.
Table 2. Summary of slope and correlation coefficients.
adapted to describe the distribution of points. For Zone 3, the line does not exactly describe the distribution of the measurements. This could be explained by a lack of implementation of the materials in this zone.
3.2. Simulation with the Finite Element Software Cast3M
Cast3M is a finite element calculation software for the mechanics of structures and fluids. It is a high-level instrument that can be used as a support for the design, sizing and analysis of structures and components. With this in mind, Cast3M integrates not only the resolution processes (solver) but also the construction functions of the system model (preprocessor) and exploitation of the results (post-processing). Cast3M is a “toolbox” software that allows the user to develop functions that meet his own needs.
The modeling is based on a flexible pavement 2D structure consisting of a 50 mm thick asphalt concrete surface layer followed by a 100 mm thick bitumen, a 2.5% grained lateritic base course, 200 mm thick cement, a 200 mm thick lateritic gravel subgrade and a platform of infinite thickness. The Poisson’s ratio is 0.35 for all materials except for the laterite, which is 0.25. The elastic moduli of the bituminous materials are taken from the Alizé software at an equivalent temperature of 30˚C and those of the lateritic gravel are derived from the geotechnical tests. The main parameters are given in Table 3.
The loading is carried out considering firstly a half-axle with a single wheel. Then a semi-axle of two twin wheels with an equivalent area of radius (Req) equal to 0.181 m can most likely represent the effect of dual wheels (Thiam, 2016 [12] , Thiam et al. (2018) [13] ). The distance between the two centers is 1.830 m (Figure 6). All of this load will be applied to the finely meshed footprint located at the surface layer and is varied by 10, 13, 16 and 19 tons. The displacements on the bituminous layer are recorded with the two loading cases (Req = 0.125 m and Req = 0.181 m). 8-knot elements (cub8) on a quarter of the carriage way, a twin-axle half-axle with an equivalent area of radius equal to 0.181 m and a single wheel of radius equal to 0.125 m was used for the loading. The resulting mesh is represented at Figure 7. From the simulation results, we have plotted the evolution curve of the deflection as a function of the axle load (Figure 8).
The trend of the two curves shows a linear evolution of the deflection. When
Table 3. Parameters of the different layers.
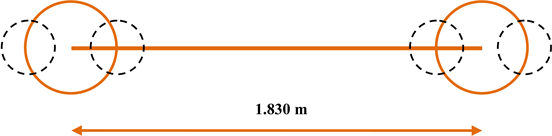
Figure 6. Simplified schematic of a single axle with dual wheels (Thiam, 2016 [12] ).

Figure 7. Mesh of the pavement structure.

Figure 8. Variation of the deflection for a single axle and a twin axle.
the axle load increases, the deflection increases. This increasing is greater in the case of a single wheel than in the case where the effect of twinning is taken into account.
3.3. Results of Calculations by the Rational Method with Alizé
Alize software is developed by LCPC and SETRA to implement the rational method of mechanical dimensioning of road structures. It uses mechanical methods for the analysis of pavement behavior considering a multilayer structure with elastic behavior, linear, homogeneous and isotropic with static loading. The French pavement design method (LCPC-SETRA, 1994 [14] ), based on a multilayer axisymmetric model of Burmister (Burmister, 1943 [15] ), is used in the ALIZE software (LCPC-SETRA, 1998 [16] ). In this static 2D model, each layer has a homogeneous and elastic behavior. The geometrical and elastic characteristics of this pavement structure are the same as for the FEM by Cast3M. The results are shown in Table 4.
3.4. Correlation between in Situ Measurements and Numerical Models
The evolution of the deflection as a function of the axle load is shown in Figure 9 and Figure 10 and the comparison is made on the results measured on the Fatick-Kaolack section and those calculated from Cast3M (Axisymmetric calculation with Req = 0.125 m and Req = 0.181 m) and from Alizé.
The analysis shows that the deflection obtained with Cast3M in the case of a single wheel of radius R = 0.125 m is closer to the deflection measured in situ than that obtained in the case where the effect is taken into account (two twin wheels of equivalent radius R = 0.187 m). For the single wheel, we have a straight line coefficient equal to 1.98 which is close to the slope coefficients of the values measured on the field and the coefficient of determination R2 = 1. So it is to further the research to validate the use of an equivalent radius and to have a better evaluation of this parameter.
Table 4. Deflection results calculated by Alizé.

Figure 9. Comparison between measured values and the values of the simulation with Cast3M.

Figure 10. Comparison graph between the measured results and the calculations with Alizé.
The analysis of the graphs shows a linear evolution of the deflection calculated with Alizé as a function of the axle load. The results obtained corroborate the measurements in situ because the deflection values vary practically in the same range as the values measured in situ. We can see that the modeling of a structure can allow us to get closer to the reality. The deflection measured on the Fatick-Kaolack section and that calculated by cast3M and Alizé show a linear evolution when the axle load is varied. However, the slight difference observed between the two methods could be related to the accuracy of the calculations built into the two programs. The effect of a single wheel of radius R = 0.125 m is closer to reality.
4. Conclusion and Perspectives
The objective of this study was to understand the evolution of the deflection when the axle load is varied. The analysis of the measurement results shows a linear evolution of the deflection for a variation of the axle load of 10, 13 and 16 tons on the Fatick-Kaolack road. However, in zone 3 it has been found that the linearity of the line does not reflect more than 95% of the distribution of measurements (R2 = 0.83). This can be related to a lack of implemented materials. The maximum deflection measured for a load of 16 tons shows that in the event of an extreme overload rate observed on the weighing stations (18.2 tons, approximately equal to 19 tons), the duration of the life of the pavement structure would be seriously threatened. Then a numerical simulation of the pavement with the Cast3M finite element calculation code and the Alizé pavement design software shows a linear behavior of the surface deformations when the axle load is varied from 10 to 19 tons. The results obtained by Cast3M in the case of a single wheel are closer to reality. This should make it possible to predict the deformation on the pavement surface when an extreme overload rate is recorded. It is also important to take into account the climate and to do measurements to accurately predict deflection in extreme overload conditions related to high temperature and extreme humidity (rainy seasons). Geophysical measurements should also be made to understand the causes of irregularities observed in some areas.
Conflicts of Interest
The authors declare no conflicts of interest regarding the publication of this paper.
Cite this paper
Samb, F., Diop, N., Thiam, B.B. and Ba, M. (2018) Evolution of the Deflection According to Truck Overloading―Comparison between Benkelman Beam Method and FEM of Lateritic Pavements. Open Journal of Civil Engineering, 8, 478-488.
References
- 1. Minnesota Department of Highway (1968) Flexible Pavement Evaluation with the Benkelman Beam, Department of Highway, Investigation N° 603 Summary Report.
- 2. National Academy of Sciences and National Research Council (1962) The AASHO Road Test, Report 5. Pavement Research. Highway Research Board Special Report 61E, Washington DC.
- 3. Samb, F. (2014) Modélisation par éléments finis des chaussées en graveleuxlatéritiquestraitésou non et application au dimensionnement Mécanistique-Empirique. Thèse de doctorat Géotechnique, Université de Thiès, Thiès, 173 p.
- 4. Samb, F., Fall, M., Berthaud, Y. and Bendboudjema, F. (2015) Evaluation of the Impact of Truck Overloading on Flexible Compacted Gravel Lateritic Soil’s Pavements by FEM with Cast3M©. Geomaterials, 5, 19-24. https://doi.org/10.4236/gm.2015.51002
- 5. Association Francaise de Normalisation AFNOR (1992) Essai relatif au chaussée, Mesure de la déflexion engendrée par une charge roulante—Partie 2. NF P98-200-2, 9 p.
- 6. Highway Research Board (1954) The WASHO Road Test, Part 1: Design, Construction and Testing Procedures. Special Report nr. 18, Washington DC.
- 7. Highway Research Board (1955) The WASHO Road Test, Part 2: Test Data, Analysis, Findings. Special Report nr 22. Washington DC.
- 8. Association Francaise de Normalisation AFNOR (1991) Essai relatif au chaussée, Mesure de la déflexion engendrée par une charge roulante—Partie 1. NF P98-200-1, 6 p.
- 9. Laboratoire National des Travaux Publics LNTP (2007) Direction des Routes.
- 10. Direction du Laboratoire des Chaussées (1998) Variations saisonnières de l’endommagement structural de quelques chausses souples. Bulletin d’Information Technique, 3.
- 11. F. Bolivar Lobo Carneiro Benkelman Beam (1966) Auxiliary Instrument of the Maintenance Engineer. Highway Research Record No. 129.
- 12. Thiam, B.B. (2016) Prise en compte de l’effet des pneus jumelés sur le comportement des chausses en graveleux latéritiques. Mémoire de Master Recherche, UFR Sciences de l’Ingénieur, Thiès, 52 p.
- 13. Thiam, B.B., Samb, F. and Dione, A. (2018) Determination of an Equivalent Loading Circle Which May Represent the Loading of the Dual Wheels. Open Journal of Civil Engineering, 8, 234-244. https://doi.org/10.4236/ojce.2018.82018
- 14. Lcpc-Setra (1994) Conception et dimensionnement des structures de chaussée. Guide Technique.
- 15. Burmister, D.M. (1943) The Theory of Stresses and Displacements in Layered Systems and Applications to the Design of Airport Runways. Highway Research Record 23, TRB, National Research Council, Washington DC, 126-144.
- 16. Lcpc-Setra (1998) Catalogue des structures types de chaussées neuves. Guide Technique.