Open Journal of Political Science
Vol.09 No.03(2019), Article ID:93811,14 pages
10.4236/ojps.2019.93033
Diagnostic Study on the Satisfaction of the Quality of the Service Granted to Clients of Mexican Hospitals (SMEs)
Tirso Javier Hernández-Gracia, Danae Duana Avila, Ma del Rosario García Velázquez, Enrique Martínez Muñoz
Universidad Autónoma del Estado de Hidalgo, Pachuca, México

Copyright © 2019 by author(s) and Scientific Research Publishing Inc.
This work is licensed under the Creative Commons Attribution International License (CC BY 4.0).
http://creativecommons.org/licenses/by/4.0/


Received: June 5, 2019; Accepted: July 20, 2019; Published: July 23, 2019
ABSTRACT
The diagnostic study presented was aimed at companies classified as SMEs (Small and Medium Enterprises), which offer a health service and belong to the private sector, since most do not have mechanisms to evaluate the health service. They lend and that is important for feedback and decision making. The objective was to determine the relationship that exists between the perception of the quality of the service provided to their patients and/or users by the Mexican hospitals located in the state of Hidalgo and the importance attributed to the dimensions that integrate the quality of it. The Servqual model designed by Zeithaml, Valerie & Berry, Leonard in 1988 was used. The sample consisted of 450 patients and the main findings show that it was detected that the Response Capacity dimension was the one that had the highest correlation with the global perception of the quality in the service, which points out the importance of the general willingness of the staff to help the clients of the hospitals to provide an expedited service.
Keywords:
Satisfaction, Quality, Small and Medium Enterprises of the Health Sector, Response Capacity

1. Introduction
The main reason for the evolution of the Mexican health system is reflected in the patient’s well-being, that is, all efforts related to coverage, infrastructure, treatment, type of specialization, among others, would not be palpable, but translate into satisfaction for the user who receives a level of quality and warmth associated with the service that is provided during their stay in a health center or hospital. In this context, satisfaction and quality are related, however it is difficult to establish a general concept that meets all the expectations of a person, since it will depend on the location within the health chain, without losing sight of it your profitability and position in the market (Agha, Alrubajee, & Jamhour, 2012; Collins & Clark, 2012) . According to Buitrago (2007) cited in Sánchez (2012) , satisfaction is the result of what the patient expects to happen and what he says he obtained, the perception of the experience, that is, the difference between the expectation and the perception of the patient service provided, hence the level of satisfaction. Likewise, Álvarez (2006) cited in (Solórzano & Aceves, 2013) comments that quality represents a process of continuous improvement, in which it seeks to satisfy the needs of the patient and anticipate them, participating in the development of the products or services.
It is necessary that a hospital or health center, public or private, have effective, timely and current information regarding the service it provides to its clients (patients or users) and address claims and nonconformities reduce litigation and accelerate the closure of said petitions in which there is responsibility (Norelli et al. (2015) , it is more common for public institutions to have reporting systems to assess and show indicators related to the services they provide to society, however, private health companies know little about it, hence the main reason for carrying out an investigation to know the level of satisfaction of the quality of the service provided to its patients and/or users by the Mexican hospitals (SMEs) located in the state of Hidalgo.
Table 1 shows some important dates and points, belonging to the medical history of Mexico from the 20th century.
The basic health models are dispositions created and designed by public organisms of the government, with the purpose of carrying out actions that allow them to promote and inform the population, of attention to diseases, preventive care and, transforming unhealthy environments and conditions. of people's lives (Secretaría de Salud, 2004, 2006, 2013) . Table 2 shows a classification of the models that are managed in the health system in Mexico.
Quality has been one of the predominant factors in organizational processes over several centuries, not only in industrial (productive) areas, but also shows great interest on the part of service organizations. In particular, the health sector has increased its utility by achieving adequate levels in terms of its control within hospitals and clinics in order to obtain patient satisfaction. As discussed in Jappelli, Pistaferri, & Weber (2007) , the quality of health services varies from one place to another, depending on the level of poverty of the place in question, in which case patients from areas with greater lag can receive an effective treatment, with the limitation of a longer waiting time compared to more developed areas. Donabedian (1980) defines a high-quality care as one that maximizes an understandable measure of the patient’s welfare after taking into account the balance of the gains and losses incurred in the care process of all its parts. Luft & Hunt (1986) define quality as the degree to which medical care processes increase the likelihood of desired outcomes by patients and decrease the likelihood

Table 1. Contemporary history of the health system in Mexico.
Source: (Ruiz, 2011) .
Table 2. Health system model.
Source: Soto, Lutzow, & González, (2011) .
of unintended outcomes. The Baldrige Model of Excellence, makes use of a self-evaluation mechanism for promotion in organizations, which has optimized the principles of total quality management (TQM) (Fallah et al., 2014 ), not only in organizations productive, but also in those of services such as those of the health sector (Osman, 2014) .
The public health system faces challenges to improve the quality of care and to achieve this, it requires the training of doctors and nurses, the professionalization of public administrators in this competition, the efficient planning and execution of drug supply chains, and inputs, a framework of correct incentives for medical performance, better technologies and information systems to manage clinical files and produce better diagnoses for users of this type of service (Arce, 2015) . As stated by the Ministry of Health (2006), quality in patient service includes ensuring adequate care or consultation, the most appropriate therapy, with the availability and delivery of medicines so that patients do not have the need to assume extra costs for the health service. On the other hand, the professionalization of human resources guarantees the quality of the service in the health sector. In Bustos et al. (2015) considers the importance of the professionalization of the members of the health sector and its management through an area specialized in this work. The efficient use of resources is important given that health care centers can even be affected by the public policies of different governments, especially in developing countries.
However, measuring the quality of the service is complex, because it is intangible and subjective elements are handled. Customer satisfaction is achieved when the expectations that are generated before receiving a service are exceeded by the value that is perceived once it has been received, hence the perception of quality varies from one client to another and it determines it. The model used to measure the quality of service is the SERVQUAL proposed by Zeithaml, Valerie & Berry, Leonard in 1988, which is made up of five internal dimensions for the construction of service quality which are: the tangible elements (appearance of physical facilities, equipment, employees and communication materials), reliability (Ability to provide the promised service accurately), responsiveness (desire to help clients and to serve them quickly), security (knowledge of the service provided and courtesy of the employees, as well as their ability to transmit confidence to the client) and empathy (individual attention to the client).
This model and its application methodology can be adapted and applied to different types of services, provided that the adjustments made determine reliability. The results obtained allow identifying and prioritizing the categories where improvement actions should be implemented. The SERVQUAL model is the most widely used and accepted for the measurement of the quality of services in which only the perception of the same received is evaluated (Parasuraman, Zeithaml, & Berry, 1994) .
The study hypotheses are formulated as follows:
Ho: There is no significant difference between the real perceptions of the service in a global way and the established goal value.
H1: If there is a significant difference between the actual perceptions of the service in a global way and the established goal value.
2. Method
For this work it is necessary to determine the relationship that exists between the perceptions of the quality of the service provided to their patients and/or users by the Mexican hospitals (SMEs) located in the state of Hidalgo and the importance attributed to the dimensions that integrate the quality of it, by patients and/or users. The independent variable is: The level of customer satisfaction. The dependent: The quality of the services provided by the Mexican hospitals. The type of research that was used was correlational because it studies the relationships between dependent and independent variables, if there is an increase or decrease in one of the variables, it also coincides with an increase or decrease in the other variable, which are quality and service. It is considered that the quality of the service, in general terms, is the result of comparing what the patient and/or user expects from a service with what it receives, together with the SERVQUAL model that only considers the perception of the quality of the service received, which as already mentioned, consists of 5 dimensions broken down into 22 items.
The population was composed of 1250 patients from various Mexican hospitals (SMEs) located in the state of Hidalgo. Using a formula for finite populations and determining from the experience of the researchers a 95% confidence, a maximum variability and a percentage of admissible error of 3%, a sample of 576 was obtained, however only 450 users agreed to answer the instrument.
Formula (Castañeda, De la Torre, Morán, & Lara, 2002) :
n = 576 (only 450 people participated)
where:
n = sample size
Z2 = confidence level (calculated from 95%)
p = positive variability (50%)
q = negative variability (50%)
N = population size (1250)
e2 = accuracy or error (3%)
It is important to mention that the participants signed a letter of acceptance and where those responsible for the present study committed to respect the anonymity of their responses and handle the information with ethics and responsibility. Subsequently, the reliability of the instrument was obtained through Cronbach’s Alpha coefficient, which was 0.92.
3. Results
The first element of interest was whether men or women are the ones who used the hospital service most, and in Graph 1 it can be seen that women are the majority with a percentage of 55.6% (250 cases), while men they reach 44.4% (200 cases).
Regarding the age groups of the sample, Graph 2 shows that the highest percentage corresponds to people who are between 36 and 45 years old with 36.20% (163 cases), followed by the group that is over 45 years old, with 26.70% (120 cases). Third, users who are between 26 and 35 years of age are observed with 24.90% (112 cases) and finally those who are less than 25 years of age with 12.20% (55 cases).
In Graph 3, you can see the schooling of the participants in the study, with the majority of the academic level below Bachelor with a 39.80, that is, 179 people. In second place are those who have at least a degree of 28.20% or 127 cases. Then, with 24.40%, there are those with a specialty of 110 cases and finally those with a master’s and doctorate, with 1.6% and 6%, respectively, adding a total of 34 people.
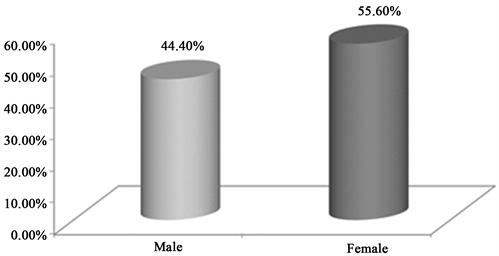
Graph 1. Gender. Source: Own elaboration based on results of instruments applied in SPSS.
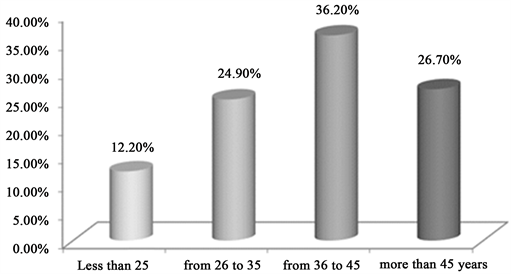
Graph 2. Age. Source: Own elaboration based on results of instruments applied in SPSS.
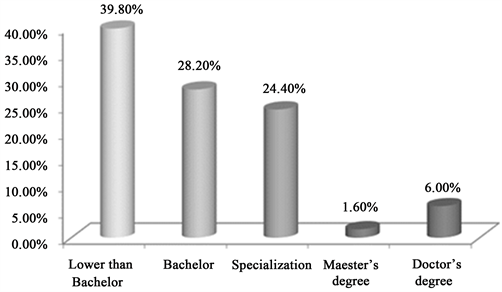
Graph 3. Scholarship. Source: Own elaboration based on results of instruments applied in SPSS.
In Graph 4, related to the type of service requested by patients, who went to the private hospital, 32.40% said that it was through emergencies, that is, 146 people normally go to a hospital when they have a health emergency. With 30.40%, corresponding to 137 cases, the patients who received an outpatient service are located. Finally, 20.20% (91 cases) and 17.00% (77 individuals) went to a private hospital to receive a laboratory and hospitalization service, respectively. In relation to this section it is observed that the users or patients usually go to request a medical service in a corrective rather than a preventive way, which stands out as part of a culture rooted in the little preventive health care.
Checking the hypothesis
To carry out this procedure, a nonparametric test called Mann Whitney U was carried out, which consists in contrasting two parts of the study sample, that of a good perception of quality and one that considers a bad or regular perception of the quality. quality (Group 1 and Group 2).
The study hypotheses are formulated as follows:
H0: There is no significant difference between the real perceptions of the service in a global way and the established goal value.
H1: If there is a significant difference between the actual perceptions of the service in a global way and the established goal value.
Considering the SERVQUAL Model proposed by Zeithaml, Valerie & Berry, Leonard, the constructs that make up the included variables are the following:
GET: Tangible Elements
GFI: Reliability
GCR: Response Capacity
GSE: Security
GEM: Empathy
GGLOB: Global
When performing the test, the information was obtained in the following Table 3 with the statisticians to perform the interpretation:
Table 3. Results of the test in a global way and by dimension.
Source: Own elaboration based on results of instruments applied in SPSS.
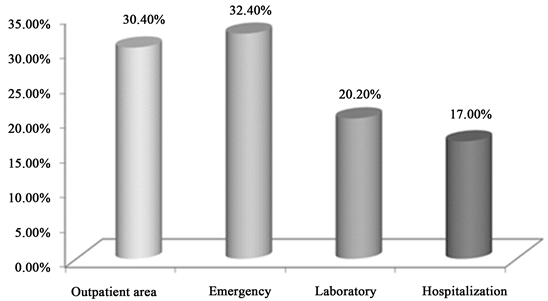
Graph 4. Type of service requested. Source: Own elaboration based on results of instruments applied in SPSS.
As can be seen in Table 3, the dimensions of Tangible Elements (GET) and Response Capacity (GCR) had a significance lower than 0.05, it can be said that there is a significant difference between the real values perceived by customers and the target value established for this case, so the hypothesis Ho is rejected and H1 is accepted. It can be concluded that these dimensions do not reach the quality of the established value (goal). The significance of the Reliability dimension (GFI) was 0.087, the Security (GSE) of 0.572 and the Empathy (GEM) of 0.069, which are greater than 0.05. So it can be concluded that these dimensions did reach the level of quality of the established target value.
Graph 5 shows the Spearman correlation coefficients for each one of them in relation to the overall perception of quality in the hospital service. This test is useful to measure the degree of association between two variables that are at least of the ordinal type. It consists of measuring two variables in each of the individuals in a sample and then determining the range of each individual in each variable. The Response Capacity dimension is the one that shows a higher correlation coefficient, 0.798. This means that the willingness to help clients to provide an expedited service is good and is more related to the overall perception of satisfaction and quality in the hospital service of various Mexican hospitals (SMEs) located in the state of Hidalgo (Table 4).
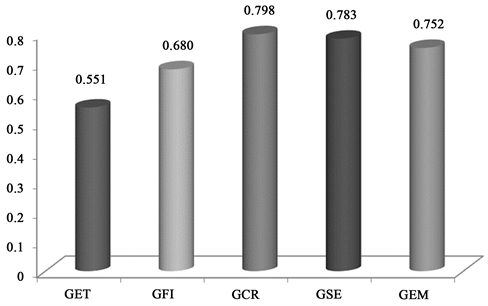
Graph 5. Correlations by dimension with respect to global perception. Source: Own elaboration based on results of instruments applied in SPSS.
Table 4. Means and correlations of the dimension: tangible elements.
Source: Own elaboration based on results of instruments applied in SPSS.
In general terms, it is observed that the ET dimension shows a perception of quality by patients and/or users as REGULAR, only in the case of item ET33 there is a tendency towards GOOD satisfaction, according to the scale used (Likert). It is observed that item with higher coefficient refers to ET_29 of 0.522, this means that there is a strong relationship between the service offered by hospitals with a good perception of quality satisfaction (Table 5).
In general terms, it is observed that the FI dimension shows a perception of satisfaction of the quality by the patients and/or users as GOOD, because on average it approaches the scale of 4 of the measurement criterion used in the applied instrument. This is because the ability to provide reliable services and correct information to patients and/or users of various Mexican hospitals (SMEs) located in the state of Hidalgo, remains in a good position to determine satisfaction with quality of service. It is observed that the item that has a higher relation with a good satisfaction in the service corresponds to FI_8 with a coefficient of 0.575; this corresponds to the patients and/or users considered to have received a good service from the hospitals in the promised time (Table 6).
Table 5. Socks and correlations of the reliability dimension.
Source: Own elaboration based on results of instruments applied in SPSS.
Table 6. Means and correlations of the response capacity dimension.
Source: Own elaboration based on results of instruments applied in SPSS.
It is generally observed that the Response Capacity (CR) dimension shows a REGULAR perception of the satisfaction of the service quality of patients or users of various Mexican hospitals (SMEs) located in the state of Hidalgo, which means that There is a regular perception of the will to help patients and/or users effectively and efficiently. Regarding the item with the highest coefficient, the one corresponding to CR_24 of 0.558 is located, which refers to the fact that the medical and nursing staff is never too busy to answer the concerns of patients and/or users.
The average of the means reflects that there is a tendency towards a REGULAR perception of the satisfaction of the quality of patients or users of several Mexican hospitals (PYMES) located in the state of Hidalgo, Mexico in the dimension of Security (SE). This statement is supported by the results of the Table 7.
At the same time, it is shown that the item with the greatest relation to the global perception is SE_14 with a coefficient of 0.531, which refers to the confidence inspired by the personnel working in hospitals towards patients and/or users receiving the service.
In the case of the last dimension, the following Table 8 shows that in general, empathy reflects a perception that goes from REGULAR to GOOD of the quality of the hospital service of SMEs in Hidalgo. That is to say, the service reflects an almost good personalized attention by the staff of the hospitals.
Table 7. Stockings and correlations of the security dimension.
Source: Own elaboration based on results of instruments applied in SPSS.
Table 8. Stockings and correlations of the empathy dimension.
Source: Own elaboration based on results of instruments applied in SPSS.
Regarding the item that is most related to the global perception, it is located at EM_26 and EM_27 with a correlation coefficient of 0.596; this means that the medical and nursing staff is always friendly with the patients and/or users, and that they are able to adequately answer the questions of patients and/or users.
In order to determine the characteristics most valued by patients and/or users, having performed a partial analysis by dimension, the most relevant item for the perception of the quality of the hospital service was shown; this is summarized in Graph 6.
It can be seen that the most valued characteristics by dimension are the following:
• ET_32. Appropriate prices of the hospital for its services, which is sent in a perception of the Tangible Elements in the satisfaction of the quality of the hospital service.
• FI_5. When the hospital staff promises to do something at a certain time, it complies, corresponding to the Reliability dimension.
• CR_23. The medical and nursing staff is always willing to help the patient and/or user that is reflected in a good Response Capacity.
• SE_14. The confidence inspired by patients and/or users of hospitals by administrative staff, which favors the Security dimension.

Graph 6. Most valued features in the quality of hospital service. Source: Own elaboration based on results of instruments applied in SPSS.
• EM_22. The administrative staff understands the needs of patients and/or users, which affects the perception of the Empathy dimension.
The coefficients shown in the graph are the approximate measurements of the level of satisfaction, which indicate a greater relationship with the satisfaction of quality in global terms. The trust that is generated in the patients/users and the willingness of the staff of the hospitals to help, are the elements that were the most powerful to explain the quality in the service to patients or users of various Mexican hospitals (SMEs) located in the state from Hidalgo.
4. Conclusion
The use of the statistical tool allowed the elaboration of an analysis that would identify the characteristics of the service of different Mexican hospitals (SMEs) located in the state of Hidalgo, most valued by patients and/or users, at the same time obtaining a measurement of indicators on the levels of satisfaction in each one of the items of the instrument applied to the sample of 450 patients or users. In the first place, through the Mann Whitney U test, the hypothesis of this research was verified and it is determined that the satisfaction of the service received is generally positive, derived from a good quality of the service of patients or users of various Mexican hospitals (SMEs) located in the state of Hidalgo.
Subsequently, it was detected that the Response Capacity dimension was the one that had the highest correlation with the overall perception of quality in the service, which allows pointing out the importance of the general willingness of the staff to help customers of the service. Hospitals provide them with an expeditious service.
It is important to point out that in future investigations it would be important to consider the responses of both the patients and users who receive a service from a public hospital and compare them with the opinion of the workers and managers who work in these institutions, in order to have both opinions and analyze the convergences and divergences.
Conflicts of Interest
The authors declare no conflicts of interest regarding the publication of this paper.
Cite this paper
Hernández-Gracia, T. J., Avila, D. D., del Rosario García Velázquez, M., & Muñoz, E. M. (2019). Diagnostic Study on the Satisfaction of the Quality of the Service Granted to Clients of Mexican Hospitals (SMEs). Open Journal of Political Science, 9, 557-570. https://doi.org/10.4236/ojps.2019.93033
References
- 1. Agha, S., Alrubaiee, L., & Jamhour, M. (2012). Effect of Core Competence on Competitive Advantage and Organizational Performance. International Journal of Business and Management, 7, 192-204. https://doi.org/10.5539/ijbm.v7n1p192 [Paper reference 1]
- 2. Arce, S. (2015). La construcción del sistema universal de salud en México 2012-2018: Logros y retos por resolver. https://www.pan.org.mx/wp-content/uploads/downloads/2015/06/594.pdf [Paper reference 1]
- 3. Bustos, V., Villarroel, G., Ariza, F., Guillou, M., Palacios, I., Cortez, L., Cañizares, R., Núñez, M., & Huamán, L. (2015). Análisis de la gestión de recursos humanos en los modelos de salud familiar, comunitaria e intercultural de los países andinos. Anales de la Facultad de Medicina, 76, 49-55. https://doi.org/10.15381/anales.v76i1.10971 http://www.scielo.org.pe/scielo.php?script=sci_arttext&pid=S1025-55832015000100006 [Paper reference 1]
- 4. Castañeda, J., De la Torre, M., Morán, J., & Lara, L. (2002). Metodología de la Investigación. México: McGraw Hill. [Paper reference 1]
- 5. Collins, C., & Clark, K. (2012). Strategic Human Resource Practices, Top Management Team Social Networks, and Firm Performance: The Role of Human Resource Practices in Creating Organizacional Competitive Advantage. Academy of Management Journal, 46, 740-751. https://doi.org/10.2307/30040665 http://www87.homepage.villanova.edu/kevin.d.clark/CollinsClark%20SHRM%20networks %20and%20performance%20AMJ%202003.pdf [Paper reference 1]
- 6. Donabedian, A. (1980). The Definition of Quality and Approaches to Its Assessment. Explorations in Quality Assessment and Monitoring. Rockville, MD: Agency for Healthcare Research and Quality, U.S. Department of Health and Human Services. https://psnet.ahrq.gov/resources/resource/1567 [Paper reference 1]
- 7. Fallah, M., Dopeykar, N., Tofighi, S., Azami, Z., Amini, H., & Barouni, M. (2014). Evaluation of Quality Clinical Training in the Baqiyatallah Hospital Based on the Baldrige Excellence Model. Magazine of ELearning Distribution in Academy, 5, 22-28. https://www.researchgate.net/publication/272833597_Evaluation_of_Quality_Clinical_ Training_in_the_Baqiyatallah_Hospital_Based_on_the_Baldrige_Excellence_Model [Paper reference 1]
- 8. Jappelli, T., Pistaferri, L., & Weber, G. (2007). Health Care Quality, Economic Inequality, and Precautionary Saving. Health Economics, 16, 327-346. https://doi.org/10.1002/hec.1172 [Paper reference 1]
- 9. Luft, S., & Hunt, S. (1986). Evaluating Individual Hospital Quality through Outcome Statistics. US National Library of Medicine National Institutes of Health, 256, 22-29. http://www.ncbi.nlm.nih.gov/pubmed/3701992 [Paper reference 1]
- 10. Norelli, G., De Luca, F., Focardi, M., Giardiello, R., & Pinchi, V. (2015). The Claims Management Committees Trial: Experience of an Italian Hospital of the National Health System. Journal of Forensic and Legal Medicine, 29, 6-12. https://doi.org/10.1016/j.jflm.2014.10.004 [Paper reference 1]
- 11. Osman, N. (2014). La transplantation des outils de gestion d’un contexte social, culturel à un autre: Le cas de la démarche qualité dans les hôpitaux publics égyptiens. https://halshs.archives-ouvertes.fr/tel-00859644/document [Paper reference 1]
- 12. Parasuraman, A., Zeithaml, V., & Berry, L. (1994). Reassessment of Expectations as a Comparison Standard in Measuring Service Quality: Implications for Further Research. Journal of Marketing, 1, 111-124. https://doi.org/10.1177/002224299405800109 [Paper reference 1]
- 13. Ruiz, M. (2011). Políticas públicas en salud y su impacto en el seguro popular en Culiacán, Sinaloa, México. Tesis Doctoral, Culiacán: Universidad Autónoma de Sinaloa. http://www.eumed.net/tesis-doctorales/2012/mirm/indice.htm [Paper reference 1]
- 14. Sánchez, L. (2012). Satisfacción de los usuarios de consulta externa en una institución de seguridad social en Guadalupe, Nuevo León. Tesis de Maestría, Monterrey: Universidad Autónoma de Nuevo León. http://eprints.uanl.mx/3332/1/1080256485.pdf [Paper reference 1]
- 15. Secretaría de Salud (2004). Financiamiento Justo y Protección Social Universal: La Reforma Estructural del Sistema de Salud en México. http://www.salud.gob.mx/unidades/evaluacion/seguropopular/reforma.pdf [Paper reference 1]
- 16. Secretaría de Salud (2006). Innovaciones en gestión hospitalaria en México: El caso de los Hospitales Regionales de Alta Especialidad. http://www.salud.gob.mx/unidades/cdi/documentos/DOCSAL7848.pdf
- 17. Secretaría de Salud (2013). Programa de acción específico. Protección contra Riesgos Sanitarios. https://www.gob.mx/cms/uploads/attachment/file/400539/pae_cofepris.pdf
- 18. Solórzano, G., & Aceves, J. (2013). Importancia de la calidad del servicio al cliente para el funcionamiento delas empresas. El Buzón de Pacioli, 1, 4-13. http://www.itson.mx/publicaciones/pacioli/Documents/no82/Pacioli-82.pdf [Paper reference 1]
- 19. Soto, G., Lutzow, M., & González, R. (2011). Rasgos generales del sistema de salud en México. In R. González, L. Moreno, & C. Juan (Eds.), La salud pública y el trabajo en comunidad (pp. 200-201). México: Mc-Graw Hill. [Paper reference 1]