Open Journal of Modern Hydrology
Vol.3 No.4(2013), Article ID:38959,12 pages DOI:10.4236/ojmh.2013.34028
Remote Monitoring of Surfaces Wetted for Dust Control on the Dry Owens Lakebed, California
![]()
HydroBio Advanced Remote Sensing, Santa Fe, USA.
Email: david@hydrobioars.com
Copyright © 2013 David P. Groeneveld, David D. Barz. This is an open access article distributed under the Creative Commons Attribution License, which permits unrestricted use, distribution, and reproduction in any medium, provided the original work is properly cited.
Received September 10th, 2013; revised October 10th, 2013; accepted October 18th, 2013
Keywords: Remote Sensing; Monitoring; Surface Wetness; Dust Control; Owens Dry Lake; California
ABSTRACT
Extensive dust control on the dry Owens Lake mainly uses constructed basins that are flooded with shallow depths of fresh water. This dust control is mandated by law as a minimum percent of the area of each individual wetting basin. Wetted surfaces are evaluated for area and degree of wetness using the shortwave infrared (SWIR) band of Landsat TM, or similar earth observation satellite sensor. The SWIR region appropriate for these measurements lies within the electromagnetic spectrum between about 1.5 and 1.8 μm wavelengths. A threshold value for Landsat TM5 band 5 reflectance of 0.19 was found to conform with surfaces having a threshold for adequate wetting at a nascent point where rapid drying would occur following loss of capillary connection with groundwater. This threshold is robust and requires no atmospheric correction for the effects of aerosol scatter and attenuation as long as the features on the image appear clear. Monthly monitoring of surface wetting has proven accurate, verifiable and repeatable using these methods. This threshold can be calibrated for any Earth observation satellite that records the appropriate SWIR region. The monitoring program is expected to provide major input for the final phase of the dust control program that will have a focus to conserve water and resources.
1. Introduction
The dry Owens Lakebed was formerly the largest single source of anthropogenic PM10 (known to be a health hazard) in the western hemisphere [1] (Figure 1). Owens Lake is the terminus of the Owens River that desiccated after nearly complete diversion of its surface water supply to the City of Los Angeles, first drying completely during 1927 [2].
Like other terminal lakes, Owens became the depository for salts that accumulated during the several thousand years since it last spilled [3,4]. The dominant cation is sodium and the dominant anions, in decreasing order of their presence are carbonate, bicarbonate, sulfate and chloride, with about 10% of other elements [5].
Salt chemistry and temperature-controlled efflorescence have been identified as being the causal factor for extreme levels of windborne dust through a temperature-controlled process that occurs during the winter [6,7]. Wetting of the lakebed surface by rain or snow during wintertime low temperatures induces salt dissolution and subsequent re-precipitation as decahydrates of sodium sulfate and carbonate that swell four to five times their volume. Subsequent drying during warm clear winter days cause these salt crystals to shed the majority of their hydration leaving void spaces and destroying soil structure and grain to grain contact. The resulting dry and powdery carbonate and sulfate rich surface is ablated by winds of only 7.5 m/s (15 kts) [6]. Active dust storms during frontal passage have entrained millions of metric tons of particulates each year before dust control [8].
As the party primarily responsible for lakebed desiccation, the Los Angeles Department of Water and Power (Department) is mandated by California State Health and Safety Code Section 42,316 (SB270) to perform dust control at the lake. Three dust control measures were identified by the agency responsible for enforcing SB270, the Great Basin Unified Air Pollution Control District [9]. These are (1) covering emissive portions of the lakebed with gravel, (2) covering the lakebed with vegetation, and (3) covering the lakebed with shallow flooding by water. These methods are recognized within the State Implementation Plan [9], the legal order for wetting
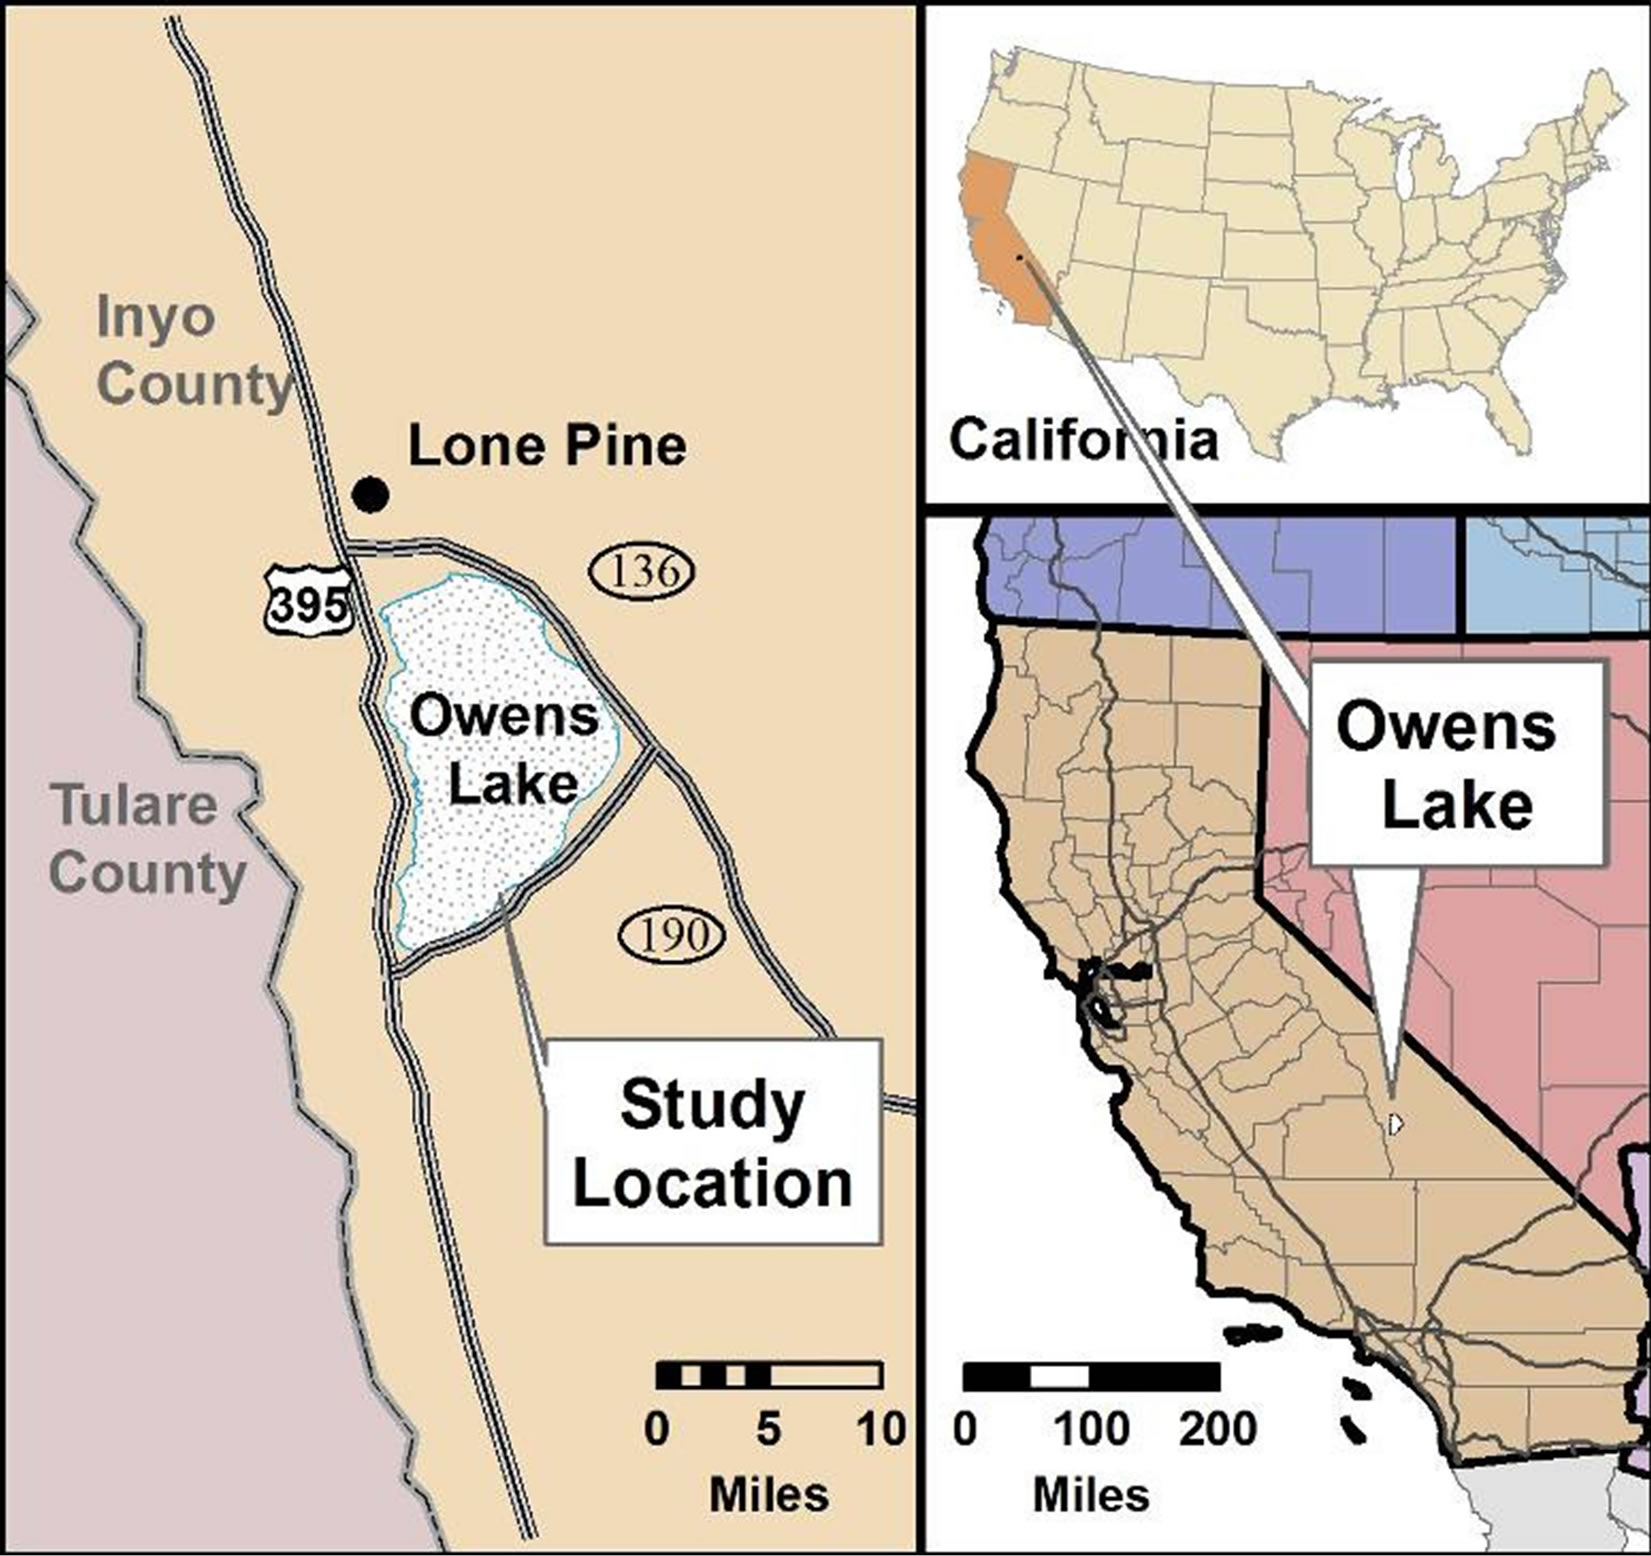
Figure 1. Location map for Owens dry lake.
mitigation. In order to respond to an aggressive schedule for dust control, the Department opted to use shallow flooding as its main dust control measure.
The purpose of this paper is to describe the development and application of a monitoring program to evaluate the degree of wetting achieved for dust control on Owens Lake. Aspects of this program were tested during its development to ensure that they yielded robust, repeatable and verifiable results. The methods that worked were used to support the monitoring program. This work was performed for, and in cooperation with, the Great Basin Unified Air Pollution Control District (District) who has responsibility for measuring air quality and enforcing standards in the Owens Lake airshed.
Eventually, over 100 km2 of the lakebed will be covered by shallow flooding [1]. Following completion of all planned shallow flooding basins projected for the near future, the dust problem is expected to be completely controlled. However, as designed, the fresh water usage each year is enormous, and with many additional locations that need treatment, could exceed 108 m3·yr−1. Hence, one potential beneficial aspect of the monitoring system for wetness can be its application to assist water conservation.
This paper is the first of two companion papers that describe monitoring with Earth Observation Satellite (EOS) data such as Landsat Thematic Mapper (TM). The paper that follows in this journal, entitled “Remote Monitoring of Vegetation Managed for Dust Control on the dry Owens Lakebed, California”, provides a similar heuristic program to develop methods to measure compliance for managed vegetation cover on about 9.06 km2.
1.1. Wetting Standards for Shallow Flooding Dust Control
A series of dust control standards were generated for shallow flooding in a controlled experiment called the Flooding Irrigation Project, or FIP, illustrated on Figure 2. The standards adopted within the State Implementation Plan [9], are that 75% of a surface receiving shallow flooding treatment for dust control must be at, or near, saturation, i.e., substantially wet. These tests were conducted by the District by flooding water from a pipe equipped with emitters along its length that was laid along the contour. The water that was released flowed down the gently sloping lakebed filling void spaces in the unsaturated zone to bring the local water table to the surface. Wetting of the surface was judged visually, by close inspection, and by annotations made in the field. The resulting classes for surface condition were mapped on aerial photos that were obtained to coincide with the field work.
Compared to ponded water surfaces, flow down many small channels provides greater water conservation because wetted soil surfaces between the flow channels evaporate only a fraction of the water. Capillary evaporation from the soil is complex because it is dependent upon depth to water, soil type and soil layering [10-12]. The effectiveness of the wetting treatment showed that if 75% of the surface is wetted, over 99% dust control is achieved as determined by measurements of the surface sand flux and airborne particulates (Figure 3). Using modeling methods that predicted concentrations of dust at the lake shoreline, various levels of required dust control efficiency have been determined from surfaces that were less than the 75% wet. Such variable control efficiency thresholds are being applied during the last phases of the dust control project.
During FIP testing, field inspection of surface wetting
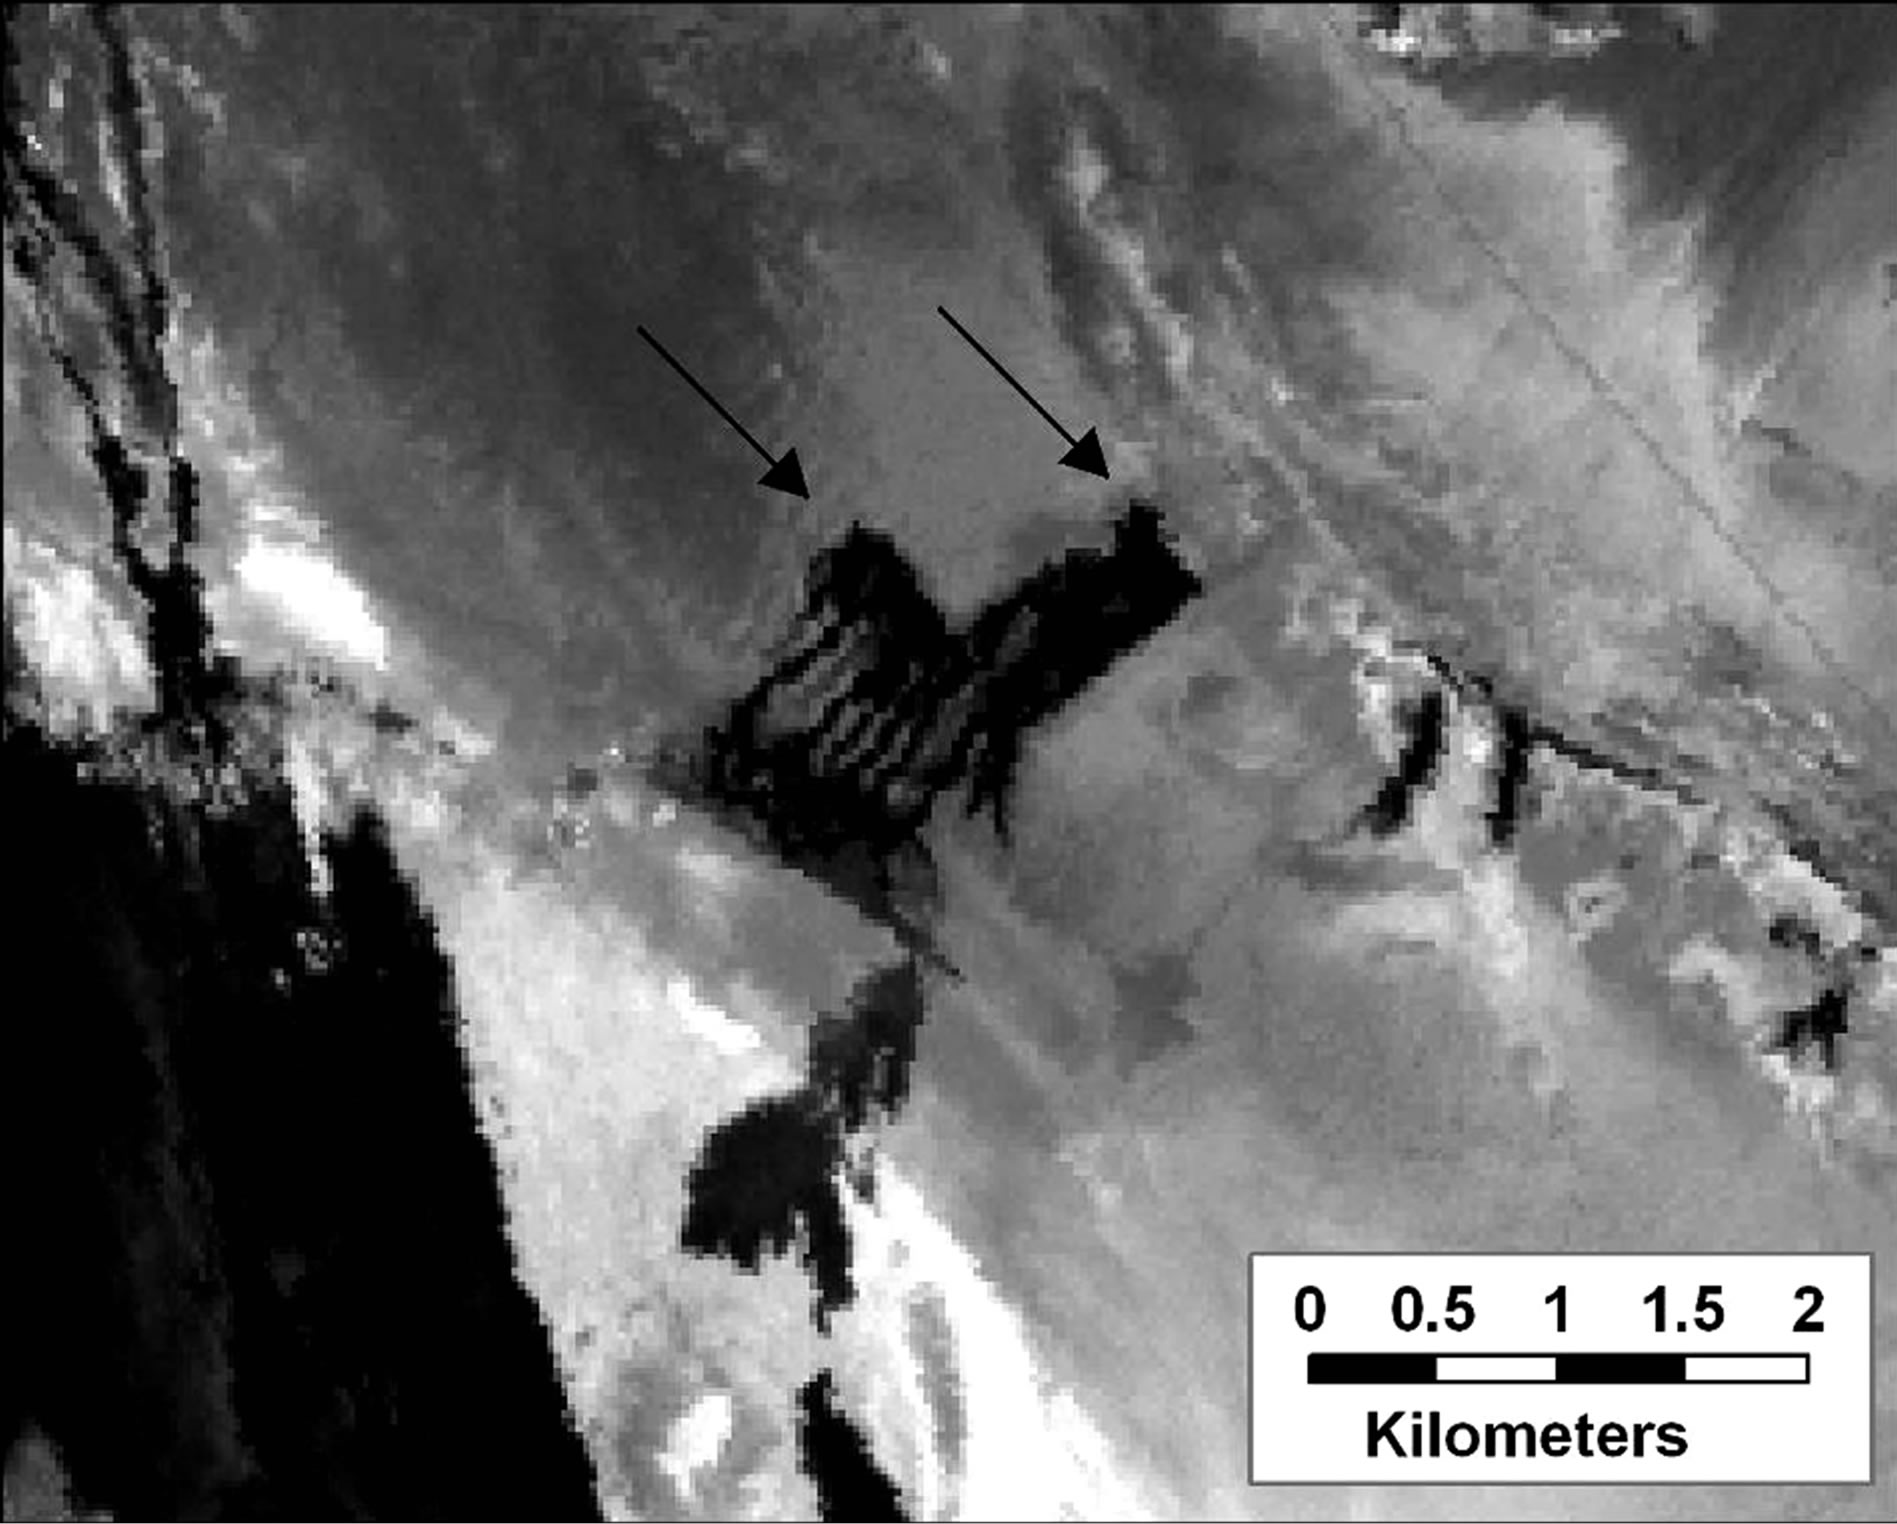
Figure 2. Landsat TM5 April 4, 1994 band 5 image of the FIP (wet surfaces image darkly). Two lengths of emitter equipped pipe (arrows) were used to direct water across the lakebed. The delta of the Owens River entering at the north end of the lakebed, is visible to the upper left.
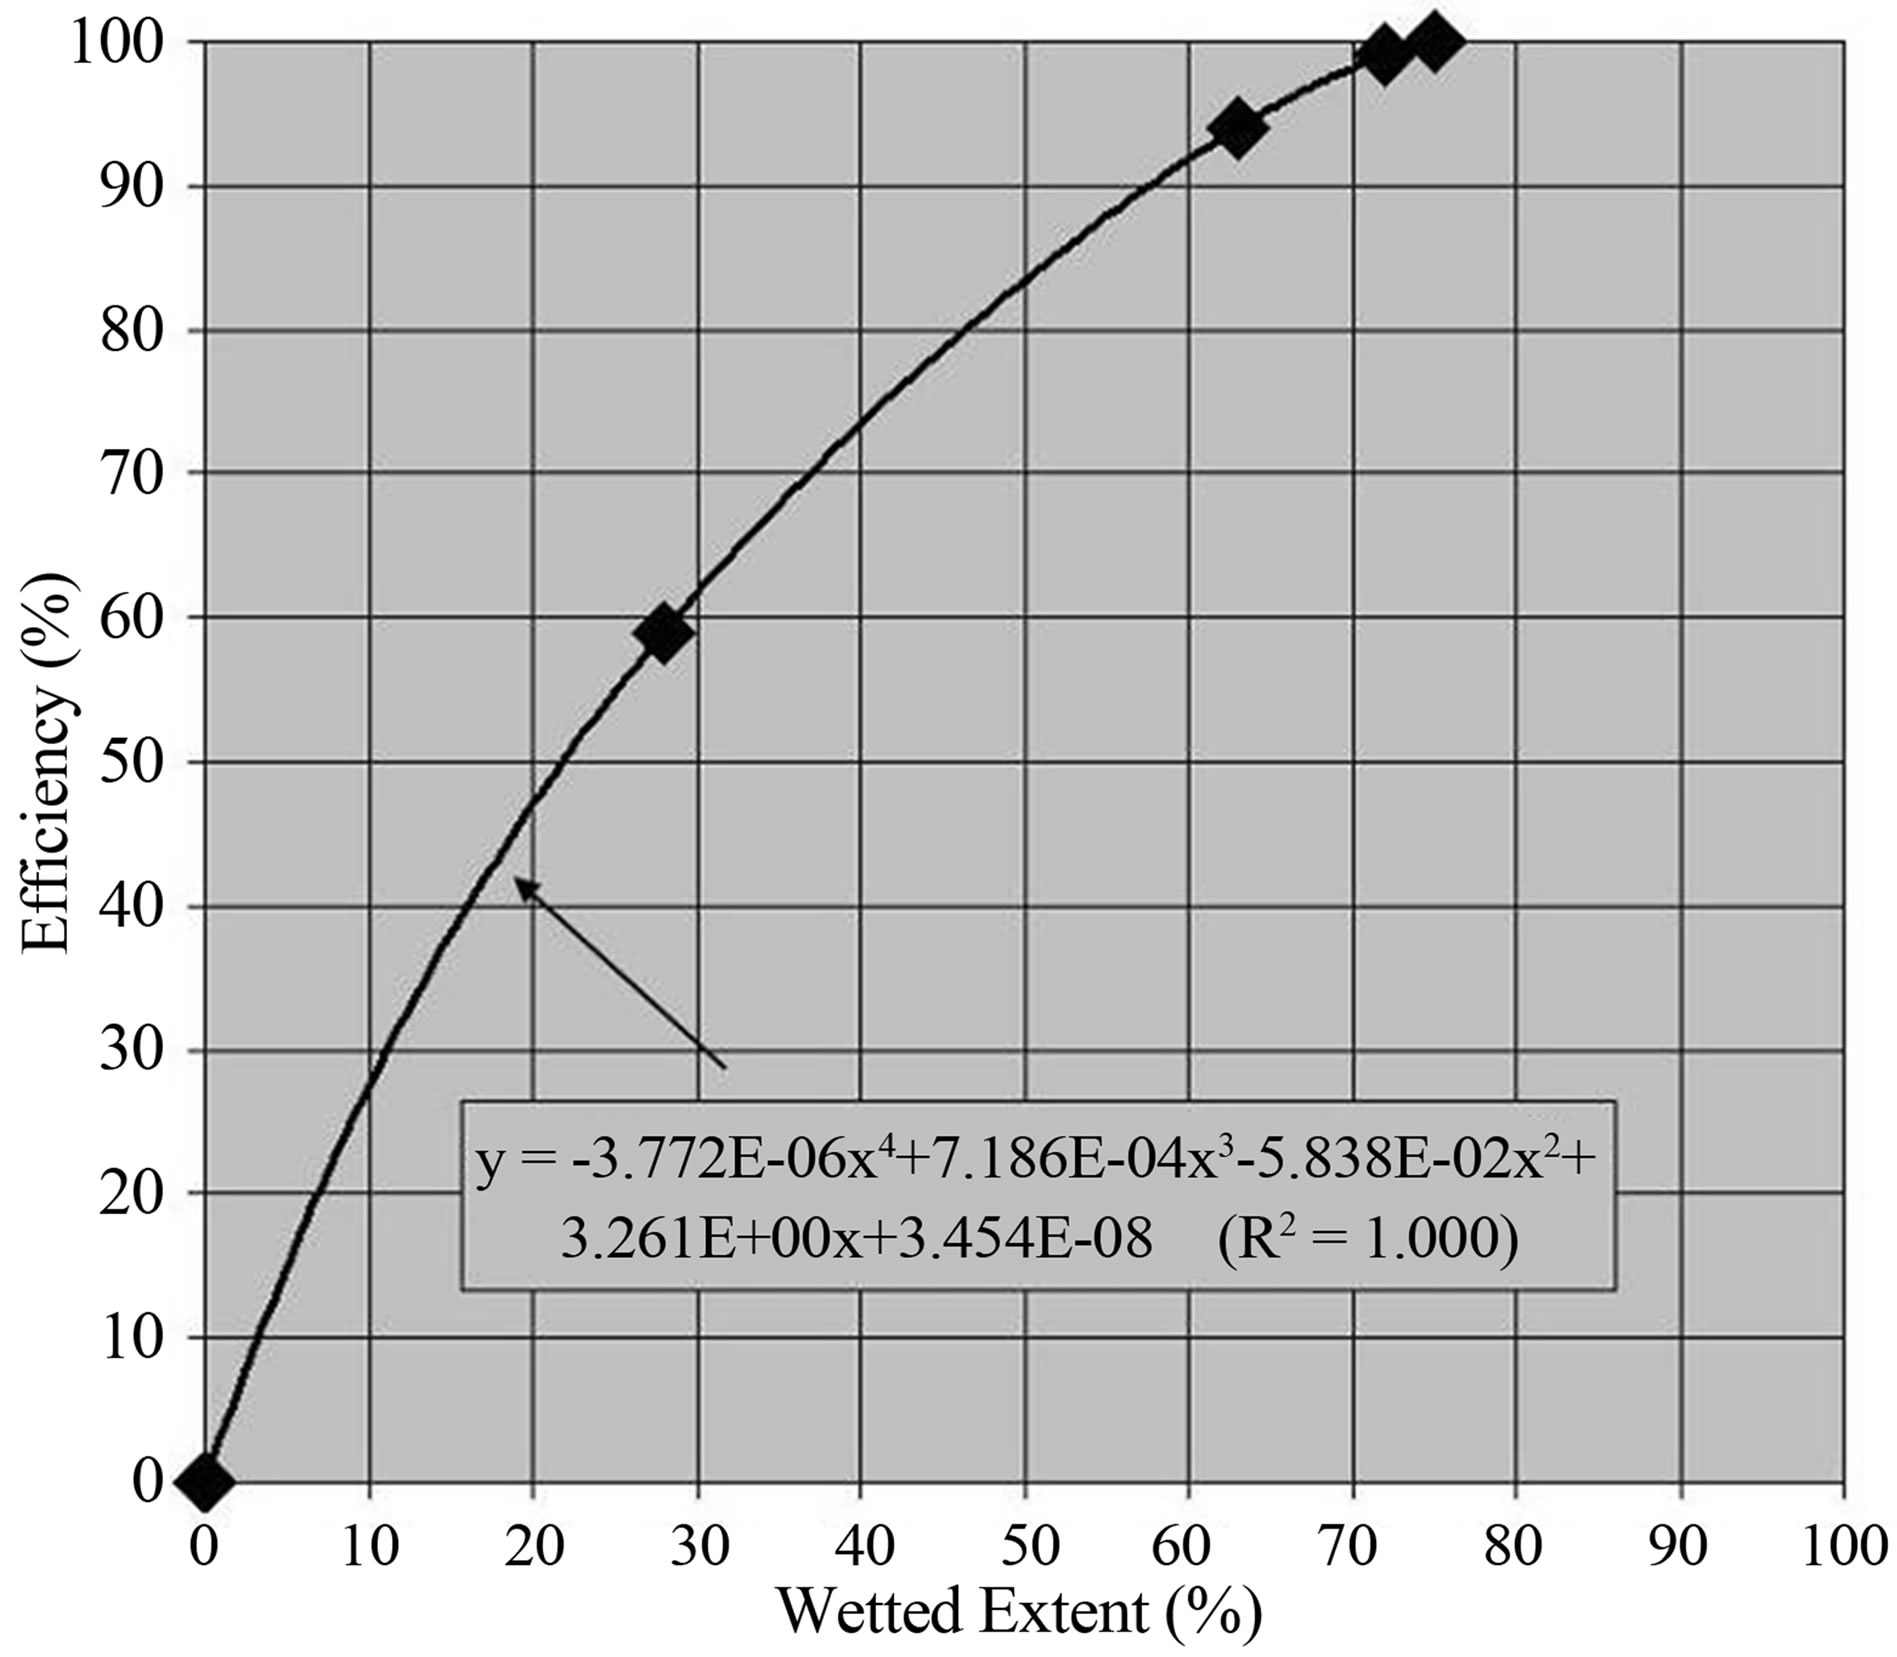
Figure 3. Dust control efficiency curve for wetted surfaces.
required some suitable metric for what was wet enough to prevent dust emissions. The District adopted saturation as a standard and used a method called the “foot tap test”, whereby the observer repeatedly taps the surface of the lakebed in question with the sole of the shoe. If this agitation causes the surface to exhibit a thixotropic response, i.e., changing from gel to fluid, then the test is regarded as a positive indication that the soil surface is at, or very close to saturation and is sufficiently wet to prevent the release of dust.
Although the foot tap test is qualitative, it proved to be the only non-remote sensing method that was reliable and repeatable to assess whether a surface was sufficiently wet to avoid dust emission. Other quantitative ground-based methods were evaluated during extensive testing by the District. These quantitative methods were rejected as inaccurate due to the characteristics of the Owens Lakebed soils: 1) substrate textures are highly variable, ranging from pure sands to pure clays that have markedly different water holding properties, thus, precluding the use of gravimetric or volumetric measurements, 2) the very high salinity of the substrate and groundwater (often exceeding 50 dS/m) prevents use of in situ measurements of wetting such as lysimeters, neutron probe, electrical resistance blocks, or geophysical methods such as ground penetrating radar or electrical conductivity, and 3) the lakebed substrate is highly variable in locations that were affected by wave erosion during prehistoric low stands of the lake. In addition, field crews need a fast method for determining whether a surface is sufficiently wet, or not, since they may need to assess large areas on foot.
1.2. Implemented Shallow Flooding Dust Control
Of the three accepted dust control measures for the Owens Lake bed, shallow flooding was chosen by the Department as the default, despite the requirement to use large amounts of water in a climate where the total open water evaporation exceeds six feet per year [13]. Though gravel was judged to be a permanent fix, the required permitting and environmental review for the appropriate magnitude of the gravel source, plus the cost of extraction, crushing, transport and spreading are extremely high for the area to be treated (~100 square kilometers). In addition, saturated subsurface soils, very low bearing capacities and the weight of gravel would require significant creativity and heroic effort to move the millions of metric tons into place that would be needed. Likewise, establishing vegetation on the harsh saline playa was found to require an immense expense, metering infrastructure, and thousands of kilometers of drip irrigation tubing for an area of slightly over 900 hectares. Despite its high evaporative losses, shallow flooding was the method chosen to meet the aggressive schedule established for phased implementation (Figure 4).
Figure 4 illustrates the progression of shallow flood implementation through time that is not yet complete as of this paper. This process was focused to fix the portions of the lakebed identified as the most problematic for dust release first, then, subsequently fixing the next worse areas as identified by the District. The revolving process of identification, then control, will culminate with over 100 km2 of shallow flood treatments. Once monitoring of fugitive dust from the lakebed shows reduction 99%, the requirement to have 75% of the surface substantially wet can be relaxed in search of water conservation for all
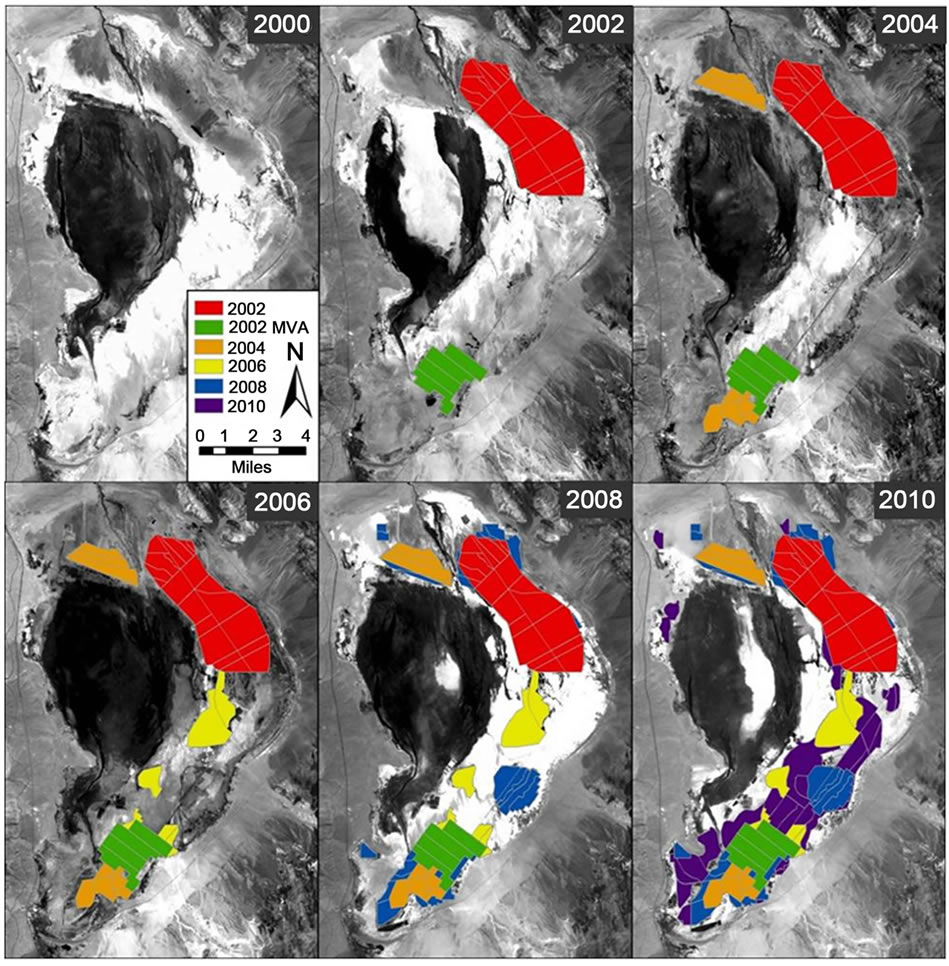
Figure 4. Progression for installation of wetting basins on Owens Lake bed displayed over Landsat TM5, Band 5 images from the same year.
wetting basins.
The basins constructed for shallow flooding are typically bordered on at least three sides by reinforced berms suitable for vehicular traffic. Interior berms are built in many of the basins for the purpose of ponding, diverting and moving water. The basins range in size from 0.06 to 4.60 km2 and are of two basic designs that can be called “flowing” and “ponded”. The flowing design mimics the FIP and is served by hosing, emitters and bubblers that provide a steady flow of recirculated water that spreads in a pattern over the surface as it runs down the gentle slope of the lakebed (as in Figure 2).
The drawback to the flowing design is the requirement to frequently control patterns of water drainage across variable substrates that may lead to erosion or creation of raised dry islands. By comparison, most (but not all) of the basins using the ponded design contain a minimum of, or lack completely, plumbing and recirculation capacity (Figure 5). Water is released into the ponded basins so that nearly the entire basin remains flooded throughout the 9-month dust season (October through June). Thus, from a standpoint of dust control and required management ef-
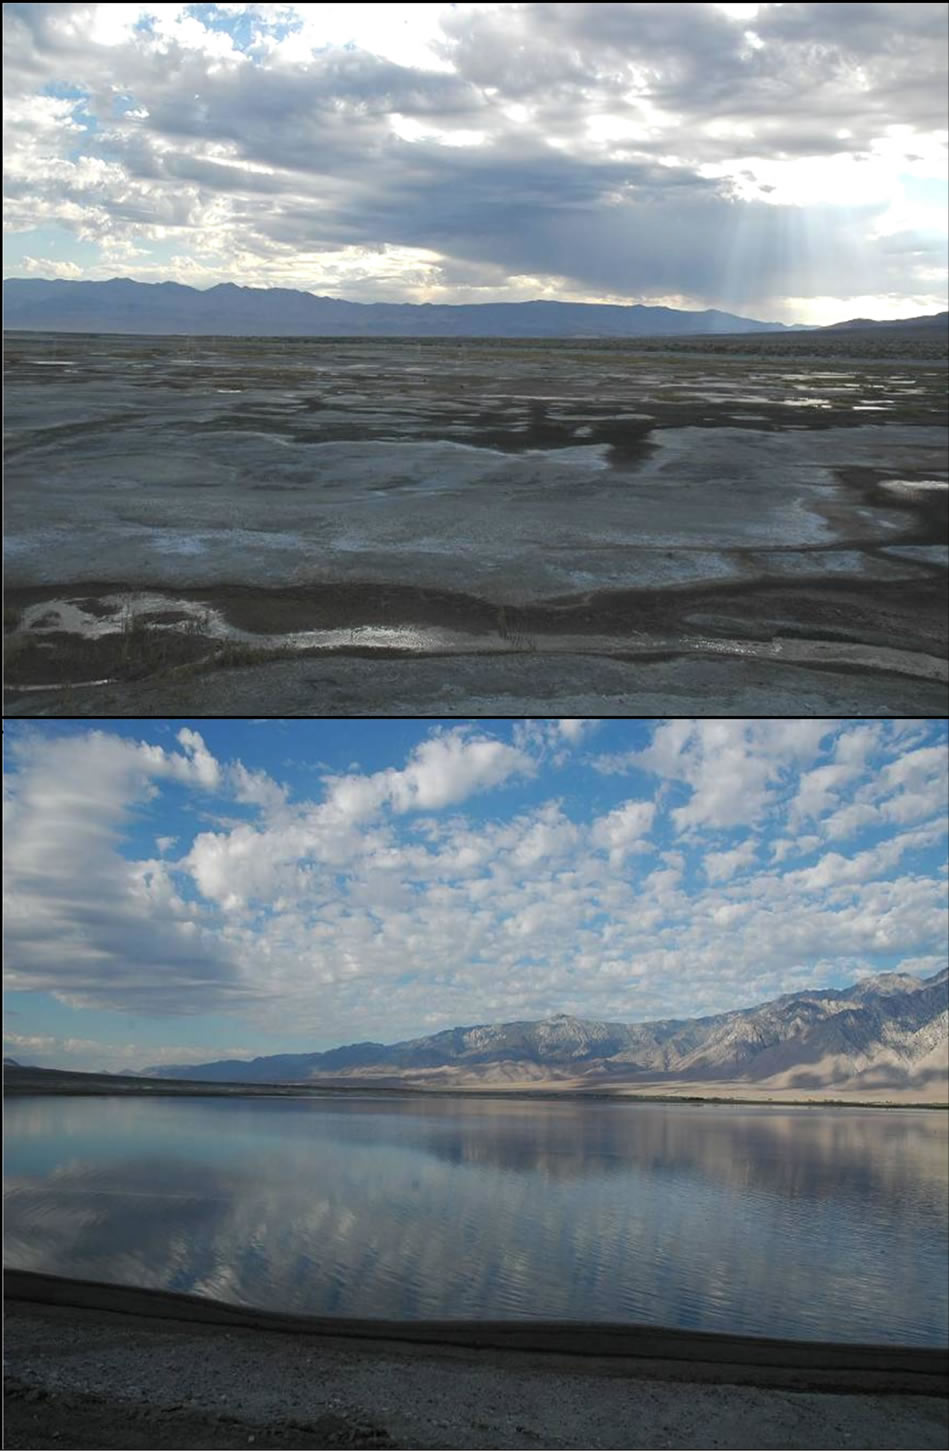
Figure 5. Wetting basins designed for flowing water (top) and ponded water (bottom).
fort, the ponded design is superior to the flowing design. In terms of water conservation, however, the ponded design greatly enhances the loss of water through evaporation.
Water evaporation from the wetted lakebed sediment, as in the flowing design is only a fraction of standing water. The flowing design wets the surface in patterns and flow lines rather than flooding it, therefore, providing potential water savings over the flooded condition of the ponded design because reduced area of free water surface is exposed to the atmosphere. Because it is designed only to contain open water, the flooded design offers virtually no potential for water conservation unless converted to some other dust control method.
The flowing design achieves water conservation by spreading the water and wetting the surfaces within the dust-control wetting basin—less free water surface per given area provides the savings. Shallow flooding also provides significant wetland habitat for migrating shorebirds. The habitat inadvertently produced through the Owens Lake dust control effort has been recognized as a significant birding area by the Audubon Society [14]. The flowing design produces an environment that contains a mix of ponded and wetted areas with transition zones that may provide valuable “edge” habitat; a mix that is better for wildlife than would be achieved by a single habitat type. The completely flooded condition of the ponded design provides mostly flooded terrain and therefore provides less range of habitat for birds and the food web that supports them. Much to its credit, the Department has developed a habitat management plan in cooperation with the Audubon Society and the California Department of Fish and Game that will enhance wildlife use while also meeting dust control and water conservation objectives.
Because the ponded design remains flooded throughout the dust season, virtually the only way to achieve conservation when operated with fresh water is to reduce the area of open water which would decrease its effectiveness for dust suppression. Thus, the Department is largely prevented from achieving meaningful conservation with the ponded design. This design, however, is amenable to conversion from fresh water to a managed salt and brine deposits, described in Groeneveld et al. [13] that can achieve virtually 100% water conservation. Also, a great deal of effort and cost would be needed to retrofit the flooded design to a flowing design, and this could also be done, if desired.
2. Heuristic Development of Monitoring
The dust season is recognized as lasting 9 months, from October 1 through June 30 [1]. Evaluation of wetting compliance was desired at approximately monthly intervals. Because of the large scale of the shallow flooding system and difficulty accessing all areas due to low weight bearing capacity or flooded conditions within wetting basins, remote sensing was chosen as the method to judge compliance. Once a wetting basin is judged to be out of compliance according to remote sensing results, it is visited in the field by District staff that then confirms whether the system is not sufficiently wet to prevent dust release and to confirm conclusions drawn through remote sensing. In this way, field verification is built into the program.
2.1. Initial Digital Photographic Method
The first iteration (2000-2002) for remotely-sensed monitoring used color-infrared imagery obtained by aircraft. A combination of four bands—blue, green, red and near infrared—provided a fair evaluation of surface wetness due to light absorption by water in all bands. There were significant problems with this method including long lead times for processing individual shots into a single image, relatively high expense and only fair accuracy. The many seamed and geocorrected images required to represent conditions for each snapshot in time were problematic because scaling of the images varied and the tilt and roll of the aircraft during acquisition frequently captured bright patches of specular reflectance.
Noting the shortcomings for an aircraft-based system, Landsat TM5 was evaluated for its potential as a monitoring platform during 2003-2005. This period followed the scan line correction failure aboard Landsat ETM+7 that rendered data with missing data stripes, so ETM+7 was not chosen for the testing and development. The 30 m pixels and 16-day repeat time of TM5 were judged to be adequate for the intended application while lacking the problematic issues noted for air photography. An additional enhancement over the aircraft-based photographic system, TM output included two short wave infrared (SWIR) bands with potential for direct determination of surface wetting.
2.2. Criteria for Selecting a Remotely-Sensed Metric for Surface Wetness
A series of studies were undertaken to determine how to apply Landsat TM5 for the monitoring task. Initially, this required observation of low altitude oblique photography obtained to capture various wetting states; dry, partially flooded and completely flooded surfaces. These photographs were compared to coincidental values of the various TM bands for images acquired. Of the Landsat bands, one band consistently showed good agreement with the environments visible on the air photographs, the Landsat shortwave infrared (SWIR) band 5 (TMB5).
Other researchers had used TMB5 to assess surface wetness [15,16] or combinations of all six reflected bands including TMB5 in a principle components-based method called “tasseled cap wetness” [17,18]. TMB5 measures reflected light within the window between 1.55 and 1.75 nm. In this spectral region, light is highly absorbed by water, thus, zero reflectance indicates open, clear water, while high reflectance, for example a reflectance of 0.25 to 0.6 indicates dry surfaces. TMB5 may saturate on the Owens Lakebed at a reflectance from 0.55 to 0.6.
From comparison of paired air photos and TM5 data, it was apparent that TMB5 did an acceptable job for identification of wet and dry areas. Thus, either alone or in combination with other bands such as within the tasseled cap wetness algorithm, TMB5 appeared to hold great promise for determining the surface wetting condition pursuant to determining shallow flood compliance.
Practicality was the main factor for choosing a metric to judge wetting compliance. Six criteria were chosen that focused upon reproducibility, determination of whether a surface was sufficiently wet, or not, with a simple yes/no dichotomy, and a built in safety margin between what is adequately wet and protected and what is potentially dry and emissive (Table 1).
2.3. Selecting Between Two Methods That Use SWIR Reflectance
A study was conducted to determine how to use TMB5 to measure system wetness and to set thresholds for adequate surface wetting to control dust. At the outset, using actual EOS data paired with ground truth was rejected for a number of reasons including the need to identify large homogeneous surfaces that contain multiple 30-m TM pixels). Collecting ground truth data was judged to be expensive and impractical because it required that the field work was in place in advance, with no guarantee of a cloud free data take. Surface wetness within the wetting basins can change markedly within a day due to addition of water for the ponded design, windblown movement of shallow water surfaces, and manipulation of the hosing and emitters supplying the flowing design (Figure 5). Thus, post hoc sampling following an overpass that was clear of clouds was also rejected as potentially error prone.
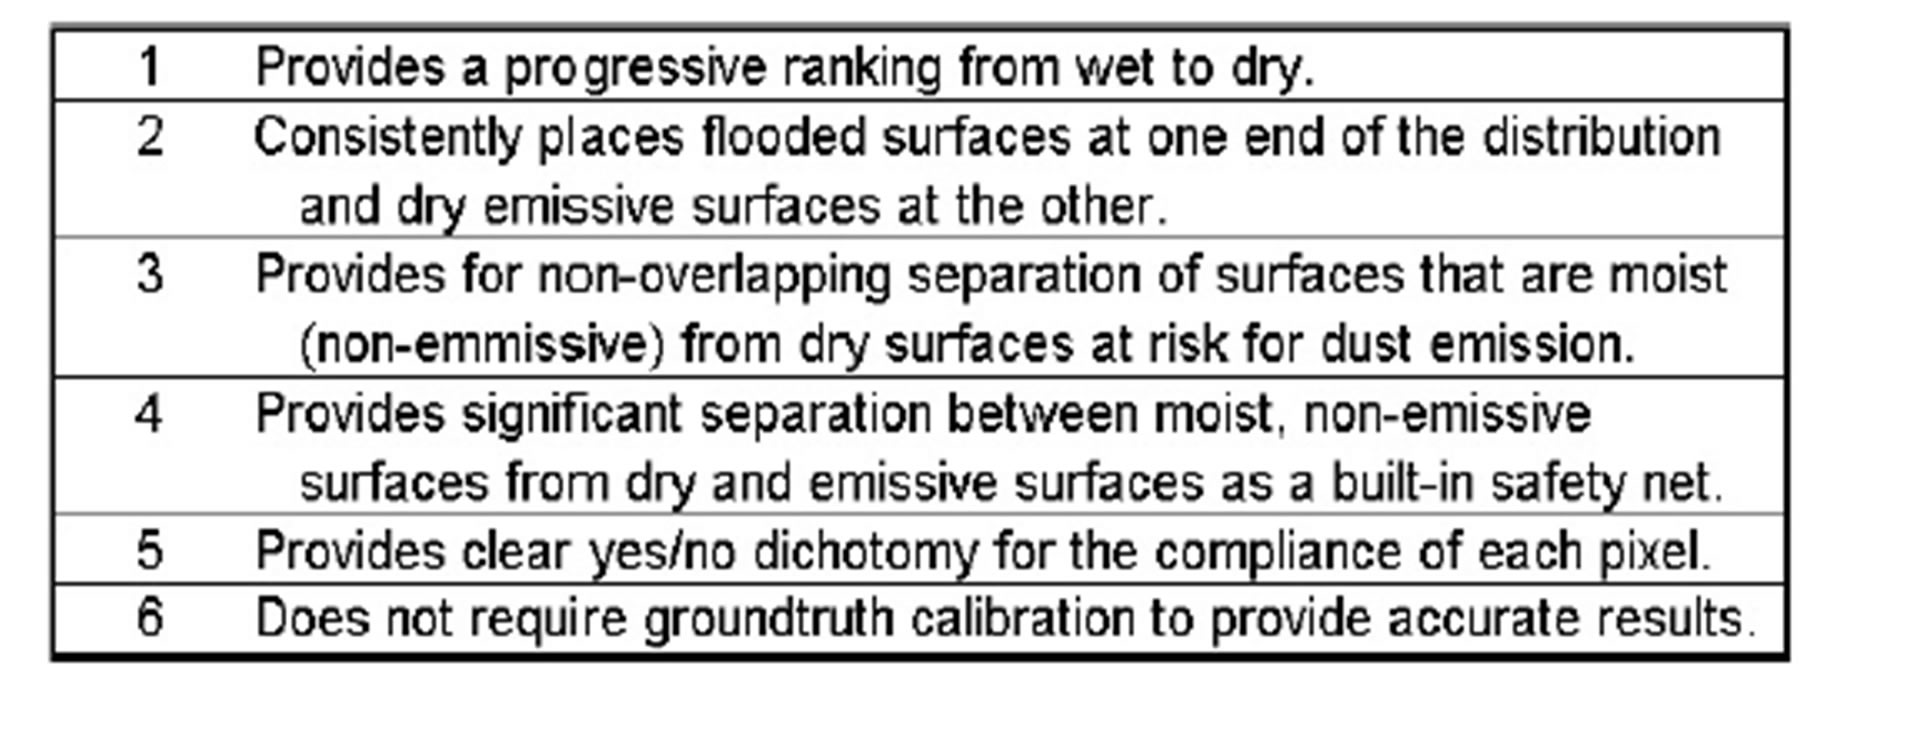
Table 1. Six criteria for selection of a remotely sensed metric of surface wetting.
Since accurate pairing of wetted surfaces with reflectance data was crucial for developing the thresholds to evaluate surface wetting, the testing was conducted in highly controlled trials using spectrometry, photography, physical measurements and observations of the surface reported with more detail in Groeneveld et al. [19]. An ASD Fieldspec Pro™ spectrometer was mounted on a tripod for a downward look that covered 30 cm diameter areas (0.07 m2) of homogeneous surfaces of variable material and wetness. The spectrometer was frequently recalibrated to reflectance using a Spectralon™ panel. All measurements of the surfaces, including gravimetric samples were obtained after completion of photography and spectrometry. The foot tap test was conducted last. These data were used to select between the two competing remote sensing methods and also as a means to establish a threshold to distinguish what was acceptably wet from what was not.
Literature review indicated two remote sensing methods with potential for monitoring surface water content. Energy in the short wave infrared infrared (SWIR) region of the spectrum measured by Landsat TM band 5 (TMB5) was used by Johnson and Barson [15] to identify wetted surfaces and Lunetta and Balogh [20] for identification of wetlands. Tasseled Cap uses all six reflectance bands of TM, including TMB5 [17,18]. A tasseled cap transformation, often available in remote sensing software packages, can be readily applied to various datasets.
TMB5, alone, has been used to identify and assess surface wetting. For wetlands in Australia, Johnston and Barson [15] found that a simple density slice of TMB5 with an empirically derived threshold was the most useful approach for identification of wet surfaces, providing 95% accuracy for identification of permanent open water or marshes. Frazier and Page [16] found that density slicing of TMB5 was as successful as multispectral classification in delineating water bodies, having an accuracy of 96.9%.
The spectrometer reflectance data for the 30 cm diameter surfaces were converted to TM5 equivalence using published band sensitivity curves in ENVI Version 4.5 software. These data were then used for comparison of the two methods: TMB5, used alone as an indicator of wetting versus tasseled cap wetness (TCW). The TC transform uses the weighted sums of the six TM reflectance bands to develop a series of components labeled Brightness, Greenness, and Wetness [17,18]. The point of these analyses was to select an index according to the criteria listed in Table 1, so only the TCW component was compared.
The resulting analysis presented in Groeneveld et al. [19], found that tasseled cap failed with regard to all of the criteria in Table 1, thus being an unreliable measure of surface wetting that could not be calibrated. Use of TMB5 data, however, provided consistent and verifiable measures of surface wetness that excelled in all six of the criteria in Table 1 (Figure 6). TMB5 values from flooded to dry-and-emissive were correctly ordered. A threshold value of 0.19 TMB5 reflectance was chosen as a representation between what was determined as acceptably wet (i.e., not emissive, and likely to remain so for at least days) and what was not. There was a large range between dry, emissive surfaces and the 0.19 chosen threshold (46% of the range of values measured).The saturated samples, determined by foot tap test, lay below the 0.19 threshold. Thus, the use of TMB5 provided a means to adequately protect the surface from emissions while enabling relaxation of the requirement for saturation that was originally written into the State Implementation Plan [9].
Further analysis of TMB5 data has indicated that the 0.19 threshold represents a natural break between surfaces maintained in a state of wetness through capillarity and surfaces where that contact for resupply is lost causing the surface to undergo drying (Figure 7). Thus, 0.19 can also be characterized as occurring in the spectral region between active wetting and active drying for Owens Lake substrate.
3. Monitoring Using Shortwave Infrared
Landsat TM5 was chosen for the monitoring program due to continuing high quality of data output, suitable repetition frequency, and because it was delivered free of charge. This satellite was operating well past twice its expected useful life [21] and onboard failures lead to decommissioning TM5 in December, 2012.
Even though it produces data with missing data stripes, Landsat ETM+7 (TM7) can be used for the Owens Lake for the monitoring program because it lies near the center of the image swath and is, therefore, mostly devoid of the
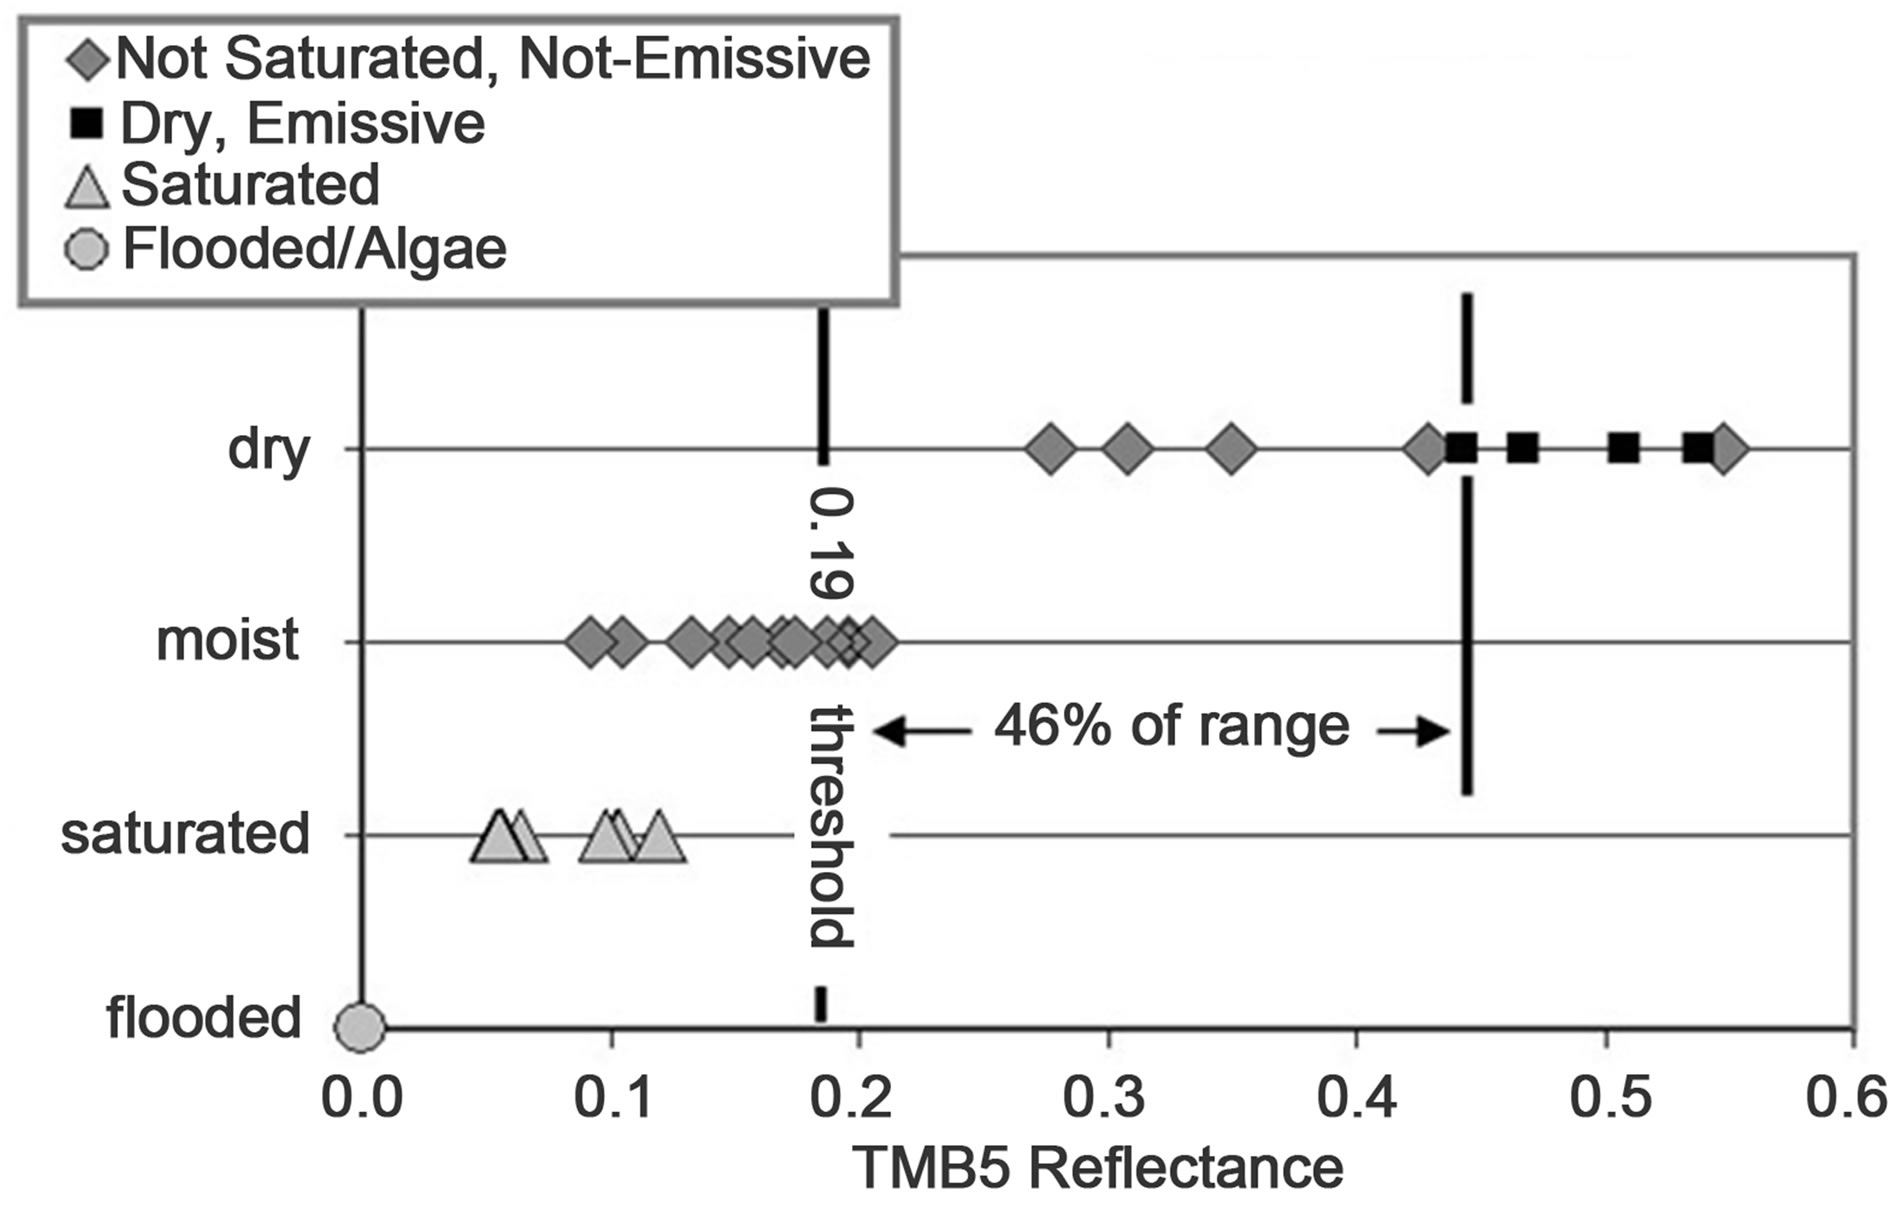
Figure 6. TMB5 results from the spectrometer study. The interval between the 0.19 threshold and lowest TMB5 for dry and emissive surfaces is 46% of the measured range of values (from Groeneveld, et al. 2010b).
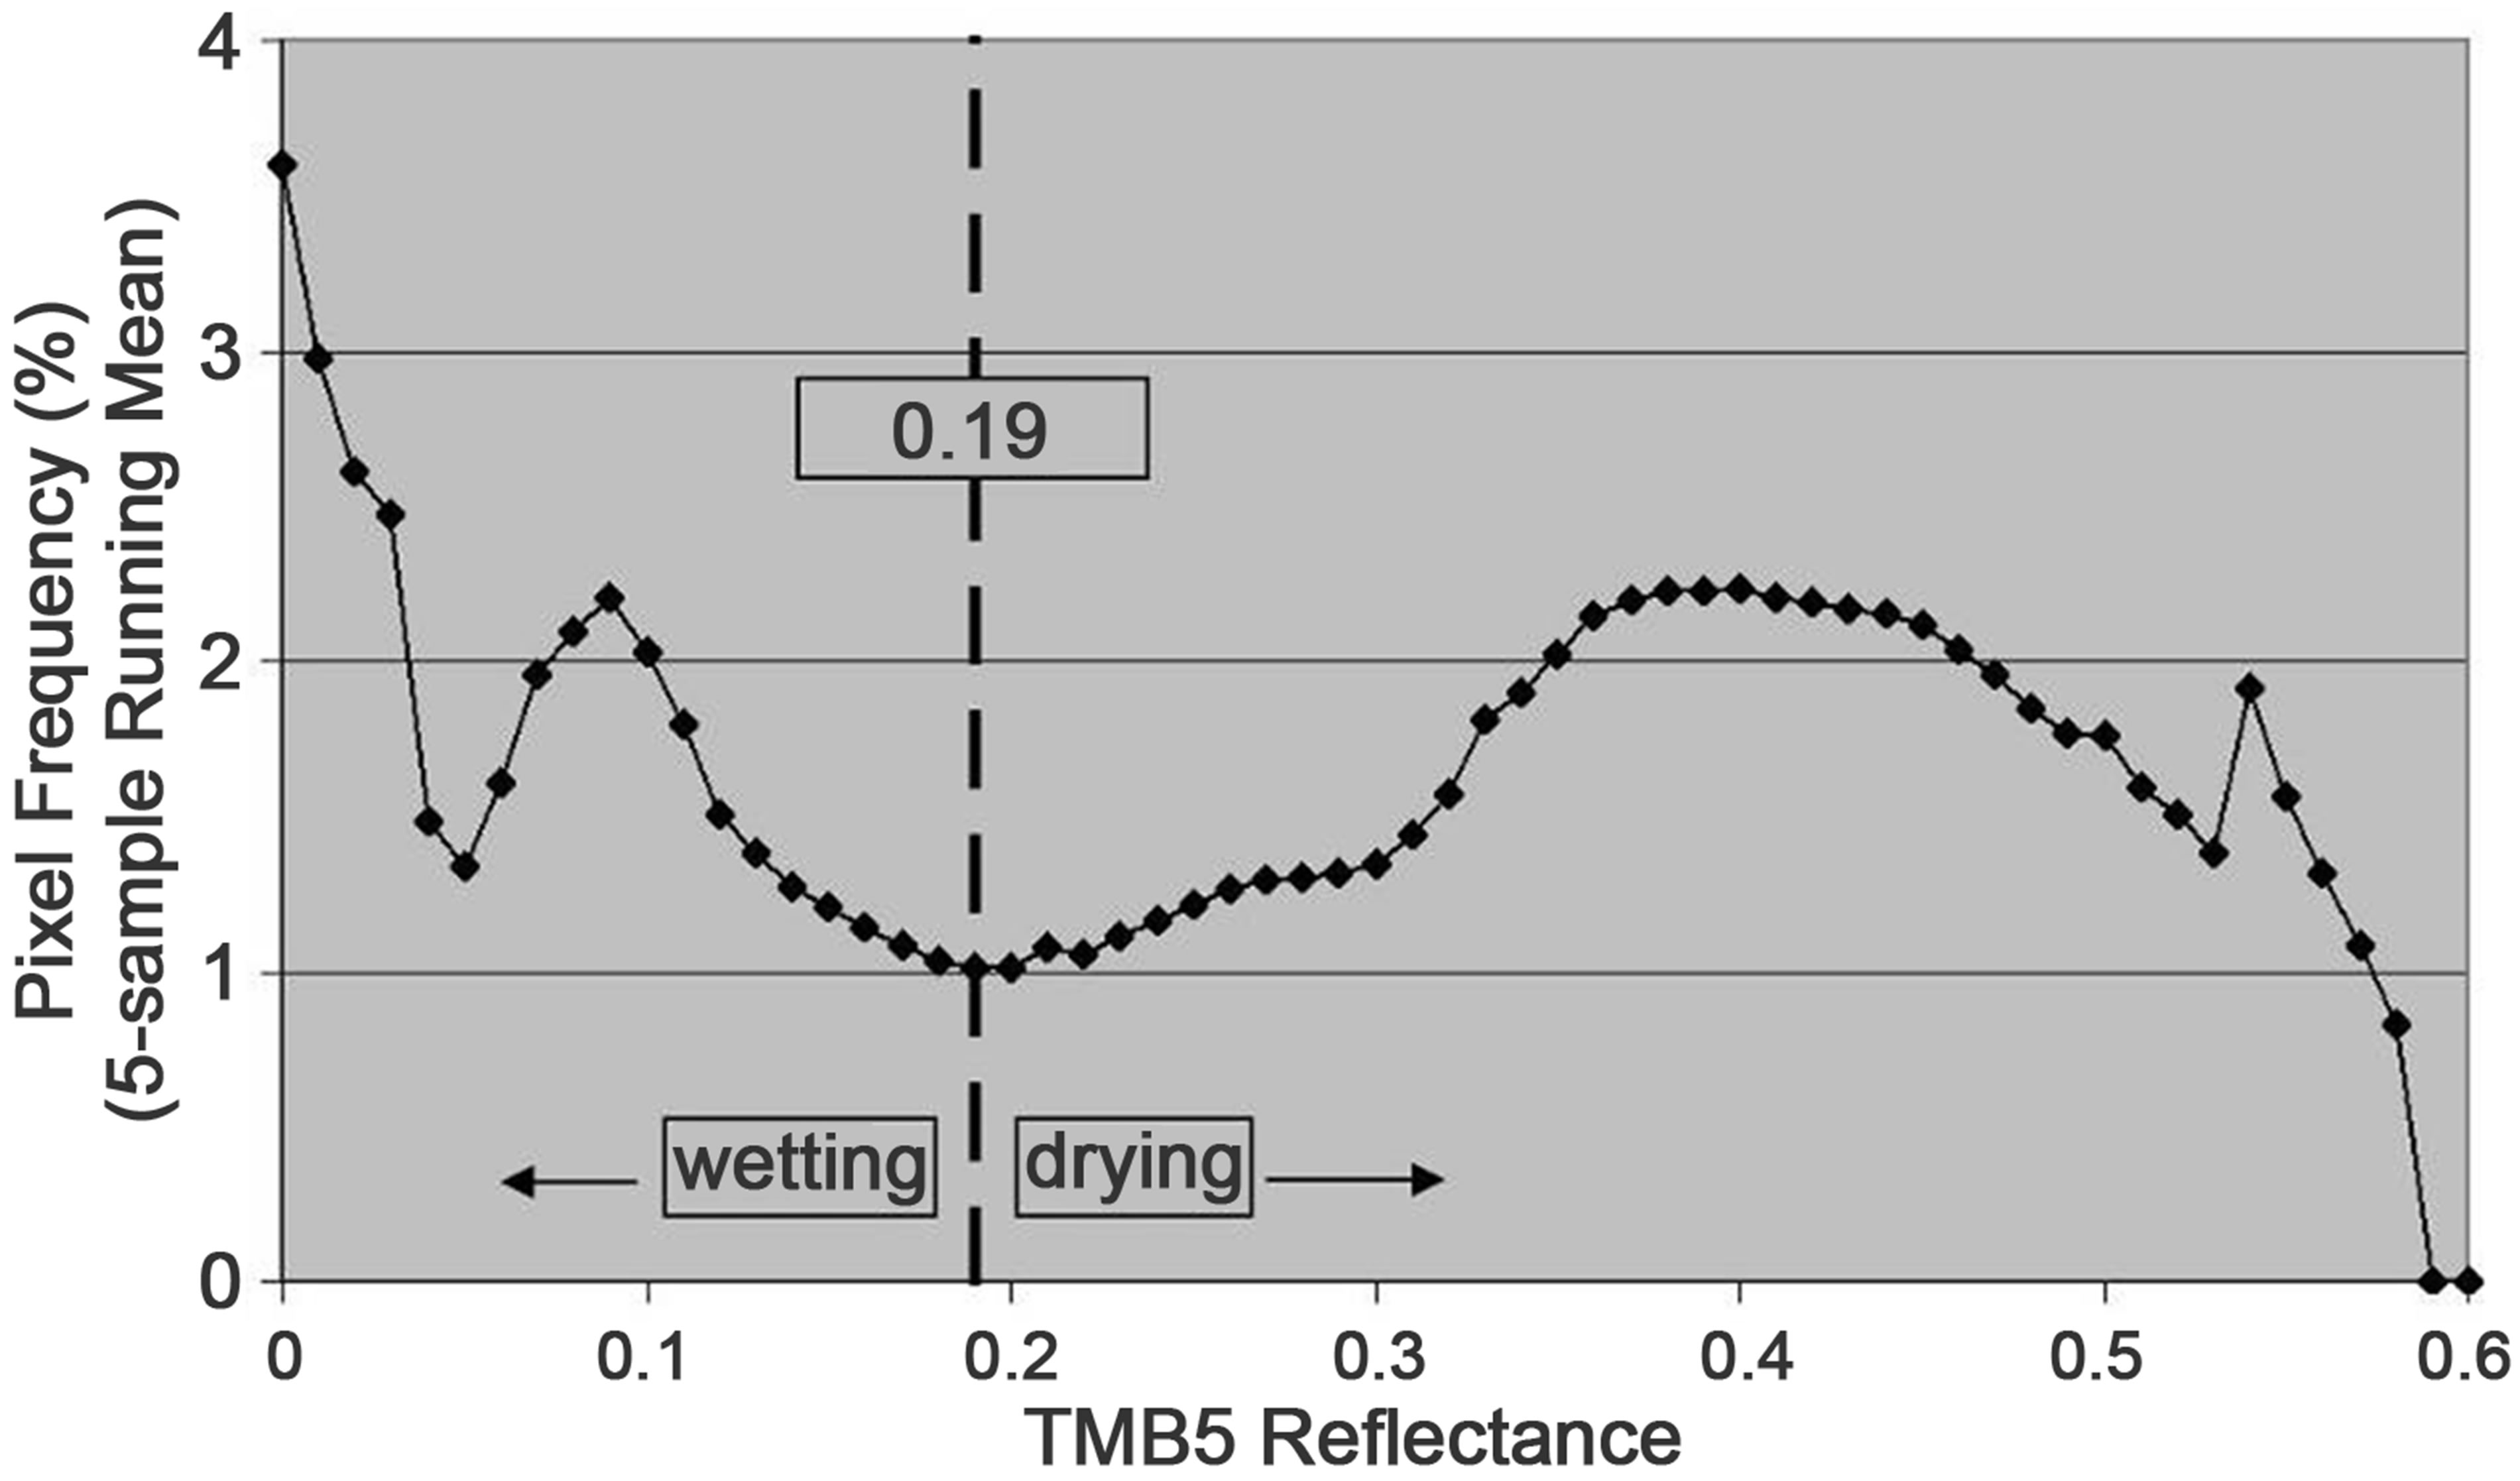
Figure 7. Histogram of TMB5 extracted from the entire Owens Lake area for the March 31, 2009 TM5 image. The 0.19 threshold is a natural break between surfaces being wetted by capillarity and those that are drying or dry.
striping. If the missing data stripes are treated as random, they can be used as a statistical sample because a set pattern of regular spacing (as presented by the stripes) imposed upon the irregular wetting basins, provides an acceptably random sample, especially if only a small percentage of any wetting basin is missed. Thus, for data analysis, the missing data of the stripes do not enter the calculation and the remaining portions of the affected wetting basin are treated as the full statistical sample. If the resulting statistics enable the basin to pass, then the credit is applied to the entire area of the wetting basin, including the portions excluded by missing data. TM7 data were also used as a stopgap if cloudy weather occluded the lakebed through more than a month. Fortunately, in the arid climate of the Owens Lake, located in the rain shadow of the Sierra Nevada, this happens infrequently.
For other EOS data that have a suitable SWIR band in the region of the water absorption feature for light, that is the region of 1.55 - 1.75 μm. Appropriate SWIR platforms include Landsat TM7, SPO5, and TM8 that has just entered service. Calibration to TMB5 equivalence is a necessary step because the 0.19 standard threshold was determined with Landsat TM5 equivalent data and band sensitivities within this window are markedly different among the EOS sensors.
For Owens Lake monitoring, cross calibration between sensors was performed using the approximately 100-km2 natural salt deposit in the lake’s topographic low. This target provided large areas with gradations of wetness that permit pairing many pixels of variable size to enable calculating relatively tight regression relationships between the two sensors. Figure 8 presents the calibration curve for SPOT5 collected on the same day as an equivalent TM5 overpass that yields TMB5-equivalent results. Pixel values were extracted along transects that were selected to capture a combination of broad areas of flooded and dry surfaces that, in-combination, provide a continuous distribution. The choice of a wide gradation
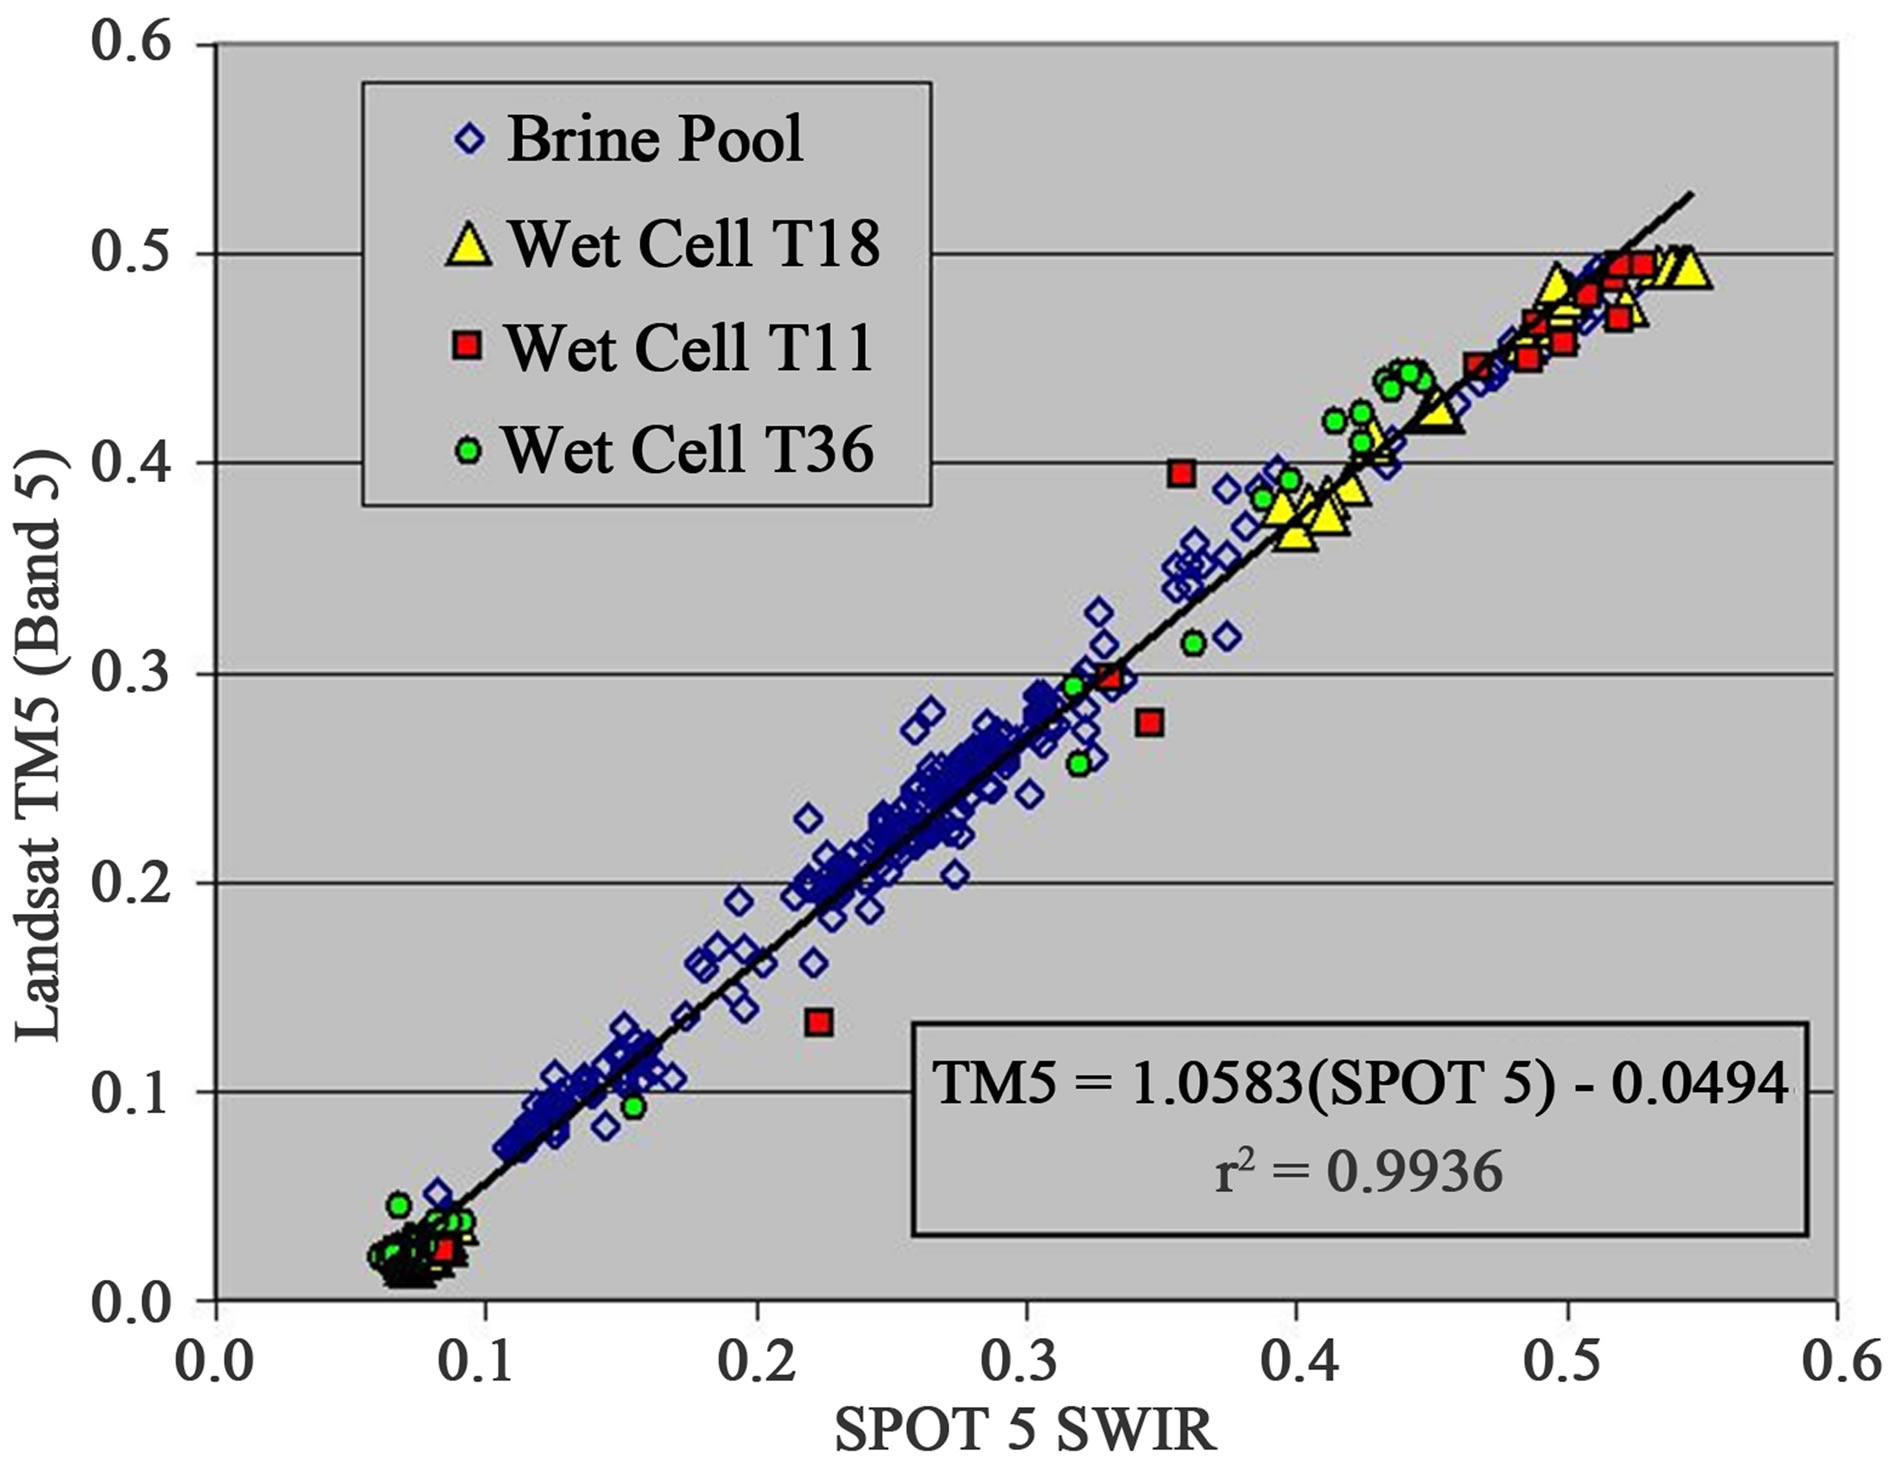
Figure 8. Regression relationship to predict TMB5-equivalent reflectance from coincidental SPOT5 SWIR data (July 2, 2008). These data were extracted from pixels along four transects across the Owens Lake.
of measurements across broad, slowly changing content of surface water and wetness minimized the scatter induced by different pixel sizes and geolocation error (generally taken to be at least one-half of a pixel dimension). Such comparisons contain large amounts of scatter if they are made for target surfaces with comparatively great spatial variability (for example, the flowing design shown in Figure 5).
The scale of the two sensors, 20 m pixels for SPOT5 versus 30 m TM pixels, plus geocorrection error induces scatter in the calibration line, however, this scatter should not bias the predicted line fitted by regression (Figure 8). With TM5 no longer available, cross platform analysis will need to use historic data for existing satellites in order to achieve TMB5 equivalency. For example, at the time of this paper, both the Landsat continuity mission (TM8) and SPOT7 that contain SWIR bands will be coming on line soon. Both of these satellites can be calibrated to yield TMB5 equivalency through interrelationship with SPOT5 or Landsat 7 that operated during the Landsat TM5’s tenure.
Landsat TM8 was calibrated using extracted pixels from paired transects of TM7 that were in turn calibrated to TM5. This additional step was necessary because of the lack of coincidence for TM8 that began service over a year after decommission of TM5. The TM8 SWIR band 6 has a window (1.57 - 1.65) that is much smaller than the TM5 and TM7 SWIR windows (1.55 - 1.75). Table 2 provides the calibrated relationships for calculating TM5 equivalency for TM7, TM8 and SPOT data for this SWIR band.
3.1. Effect of Ice on Monitoring Results
Rare periods of cold winter weather may potentially form
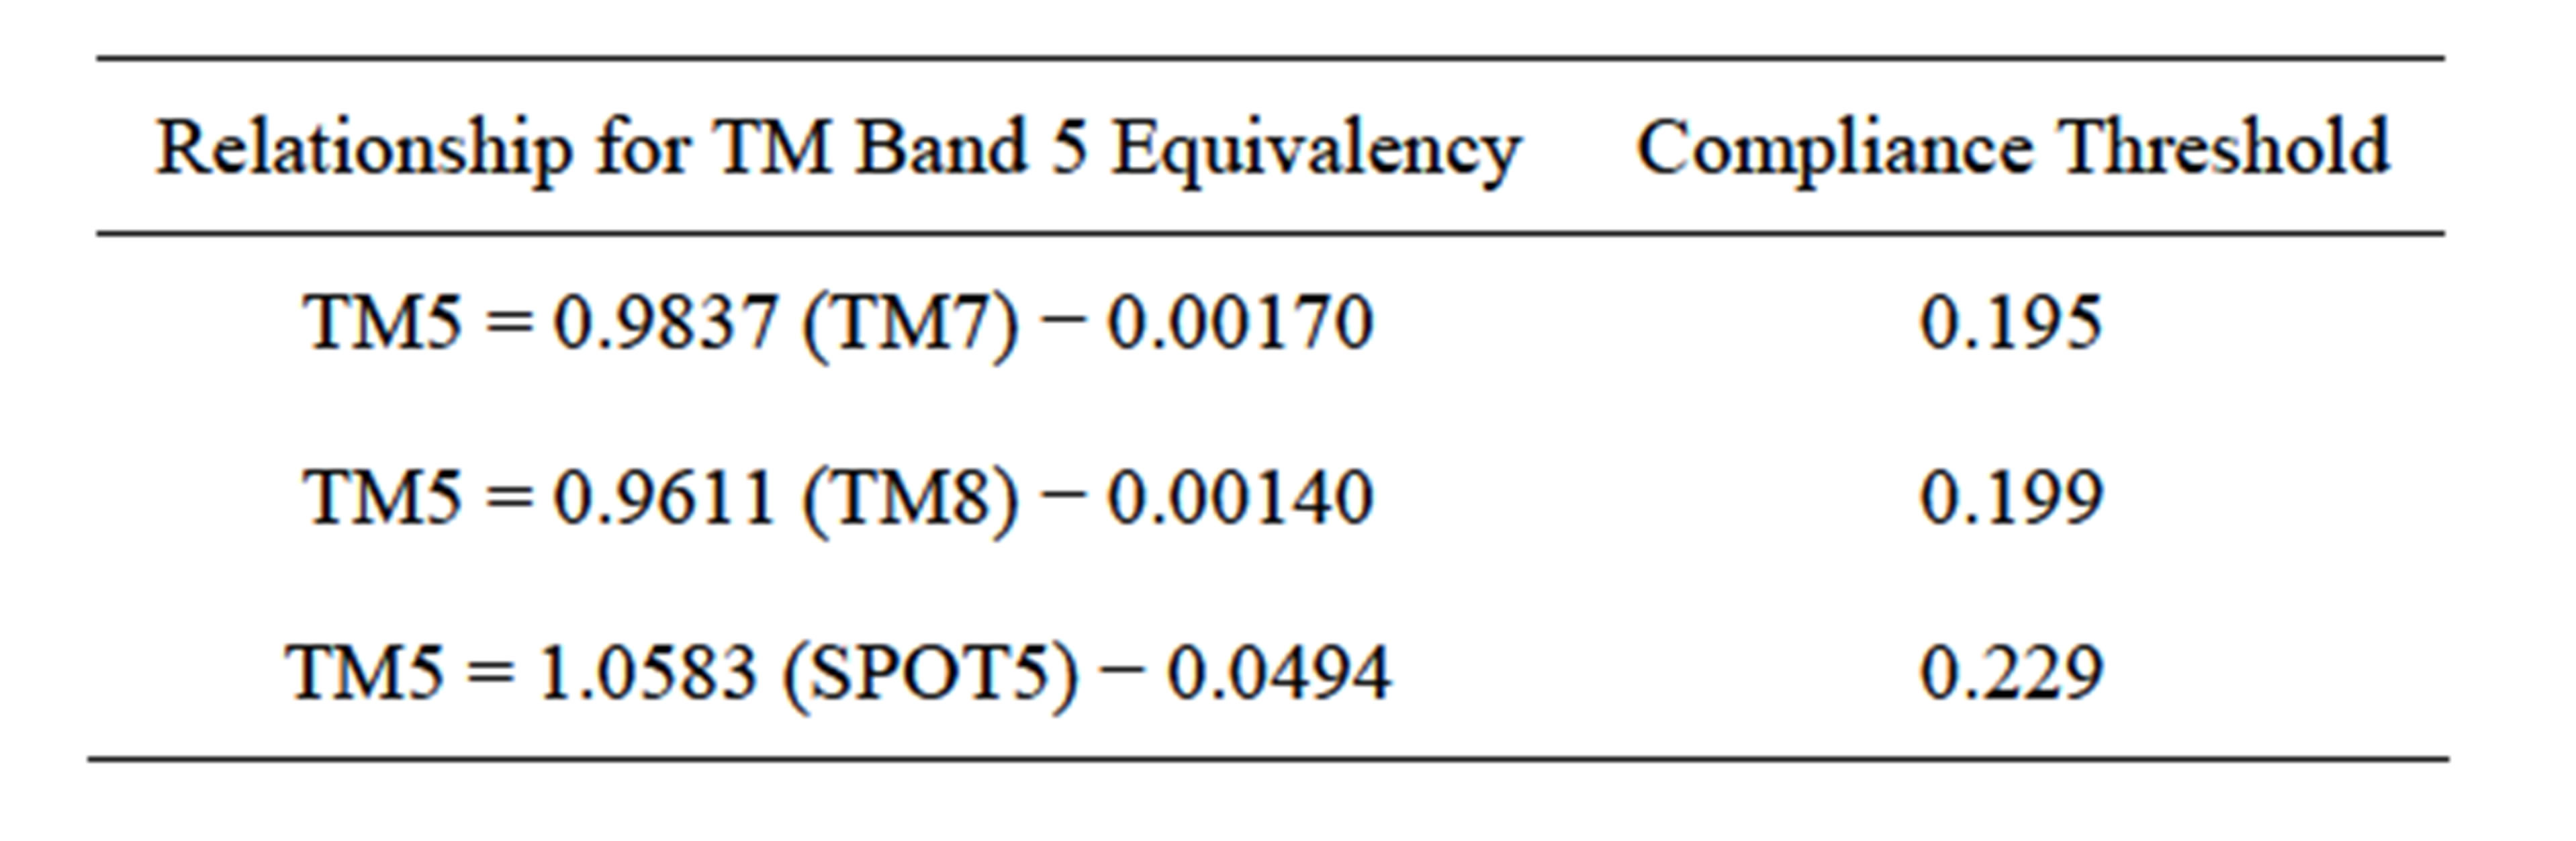
Table 2. Calibration results yielding TM5 Band 5 equivalency.
ice on the fresh water that is supplied for Owens Lake dust control. For this reason, the spectral properties of ice and fresh water were investigated using an ASD FieldSpec Pro™ spectrometer to measure the effect of ice formation upon reflectance. The question to answer was whether the formation of ice changes the interpretation of TMB5 reflectance compared to the same system not covered by ice.
The analysis used plastic cups whose insides were spray painted flat black to reduce the potential for specular reflectance. These cups were then partially filled with plaster of Paris well diluted with water and placed on a horizontal plate in order to achieve a flat, level, hardened surface. Bare plaster of Paris has about the same TMB5 reflectance as dry lakebed and the coverings of water and ice mimic actual conditions on the Owens Lakebed. Five treatments were investigated: a dry plaster surface as a control, a plaster surface covered by 2 mm of water and a plaster surface covered by 5 mm of water. The fourth and fifth treatments were the two wetted surfaces that were frozen on a leveled surface. Difficulty in obtaining a frozen surface that did not buckle into irregular surfaces during freezing limited the treatments to the two shallow depths tested.
Spectrometer measurements were made during late morning under clear skies and freezing outside temperatures, first with the control and ice covered treatments. The frozen samples were then placed at room temperature, allowed to melt, and then measured again with the spectrometer under the clear sky conditions. Calibration using a Spectralon™ panel was made before each measurement in order to enable calculation to reflectance. The data, presented in Figure 9, indicate that freezing does induce a slight change in water reflectance. This change is likely due to entrained air bubbles, however, the degree of the effect was so slight that it would not influence compliance determination. Hence, no adjustment need be made for frozen wetting basins.
3.2. Spectral Distortion from Atmospheric Aerosols
Monitoring of surface wetness may be needed for images that were taken through an atmosphere that contains visible amounts of water droplets, ice crystals, smoke or dust, i.e., a haze, that could potentially influence monitoring
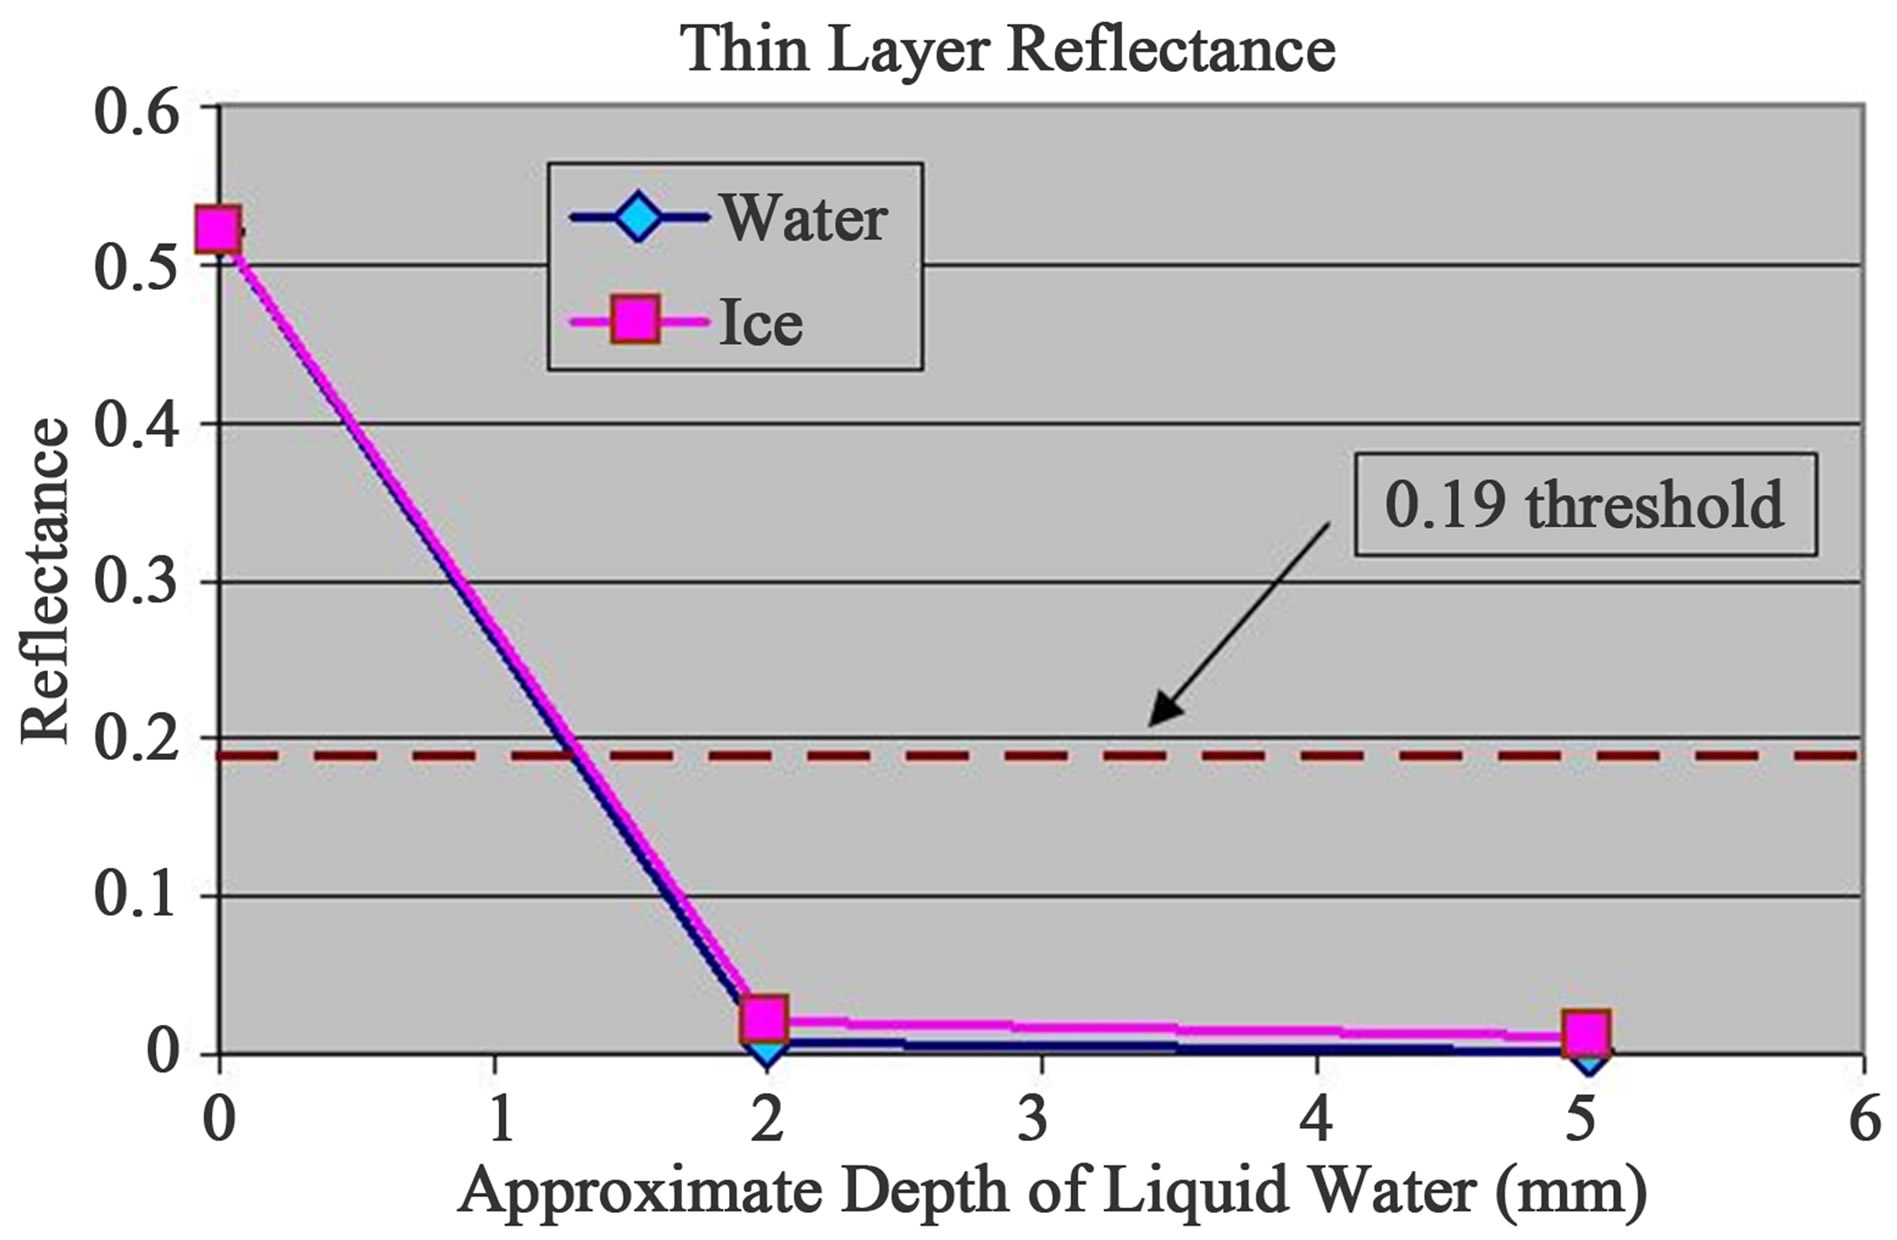
Figure 9 . Attenuation of TMB5 through water and ice. Any effects due to freezing are so slight as to not warrant different methods for frozen surfaces.
results due to scatter or attenuation of light as it passes to and from the earth’s surface. Urgency to evaluate an image could arise through the need to monitor some timesensitive effect of management or change of management, or following an extended period of cloud coverage occluding previous overpasses. Such conditions would elevate the need for timely monitoring and exert pressure to accept images affected by atmospheric aerosol content. Would this alter the results obtained?
Dark object subtraction (DOS) is an accepted method for reducing the effects of atmospheric scatter [22,23]. The method assumes that the backscatter of light measured over clear, open water elevates the reflectance above zero, the expected condition with no atmospheric scatter. For DOS, this measured value is then subtracted from all values of reflectance in the region of the open water target. Were DOS used for TMB5 evaluation of wetting, this would raise the value of the 0.19 threshold to some higher value. A test was devised to determine whether DOS was warranted within the wetting basin monitoring program.
Considering that thin clouds would be an acceptable proxy for reflectance distortion due to atmospheric aerosols, a study was made of paired images taken over the Owens Lake. Thin clouds were accepted for this analysis based upon recent results that found that scatter produced by atmospheric aerosols affected red and near infrared light in the same proportion, regardless of aerosol type or density [24]. Thin cloud cover could therefore be used as a general representation for reflectance behavior as affected by any atmospheric aerosol, whether ice in cirriform clouds, droplets in cumulus, mist near the ground, or smoke or dust at intermediate altitudes.
Pixel values for TMB5 were extracted from a polygon of thin cloud cover chosen for homogeneity over targets with a range of wetness from extremes of dry to flooded (Figure 10). The two March, 2009 images coincide with a period of relatively high evaporative demand as the
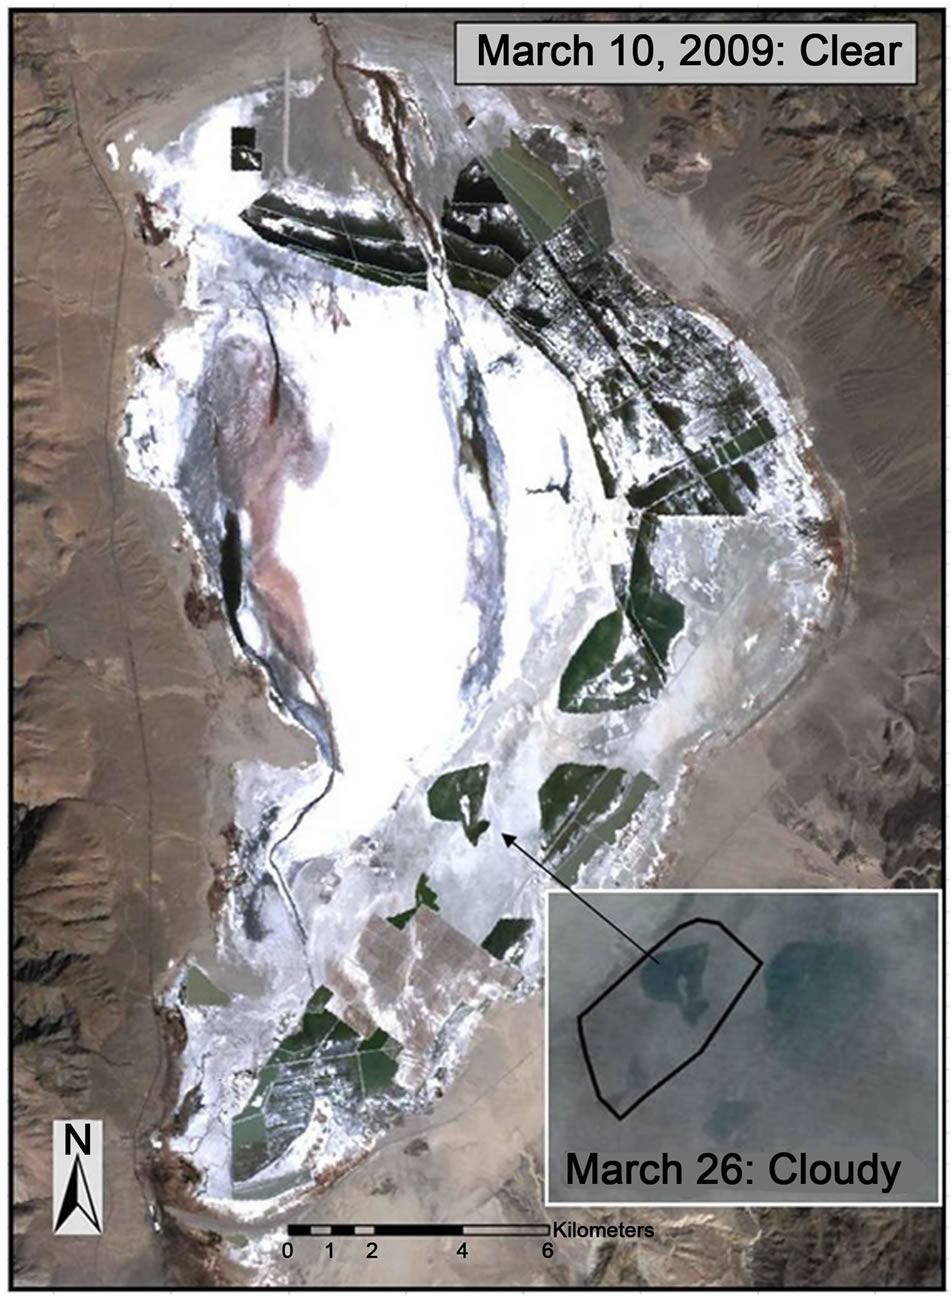
Figure 10. Paired Landsat TM5 images that were first clear and then cloud covered. TMB5 values were extracted from both images within the polygon shown on the inset cloudy image.
days grew longer and the temperatures warmer during transition from winter to spring. Under these conditions, wetted areas would wet and dry areas dry in both images. The published reference ET, expressed as ET0 [25], was about 30 mm·d−1 for March 26, the time of the latter, cloud-affected overpass [26]. High evaporative demand is important to note because about 0.8 mm of rain fell four days before the March 26 image at a station located within 4 kilometers. However, given the relatively high evaporative demand, this additional water was negligible and would have been depleted within a day. Figure 10 provides a visual comparison of both images.
Figure 11 presents cumulative distribution functions for the extracted TMB5 values within the Figure 10 polygon for the clear and cloudy conditions. These data show that the distortion effect produced by atmospheric aerosols causes backscatter of light which increases the lower reflectance values. Rather than the DOS algorithm that would shift all values rightward, higher reflectance values were affected by signal attenuation that reduced the light returning to the sensor. Scattering and attenuation created a pinwheel effect that moved high reflectance values leftward and low reflectance values right-
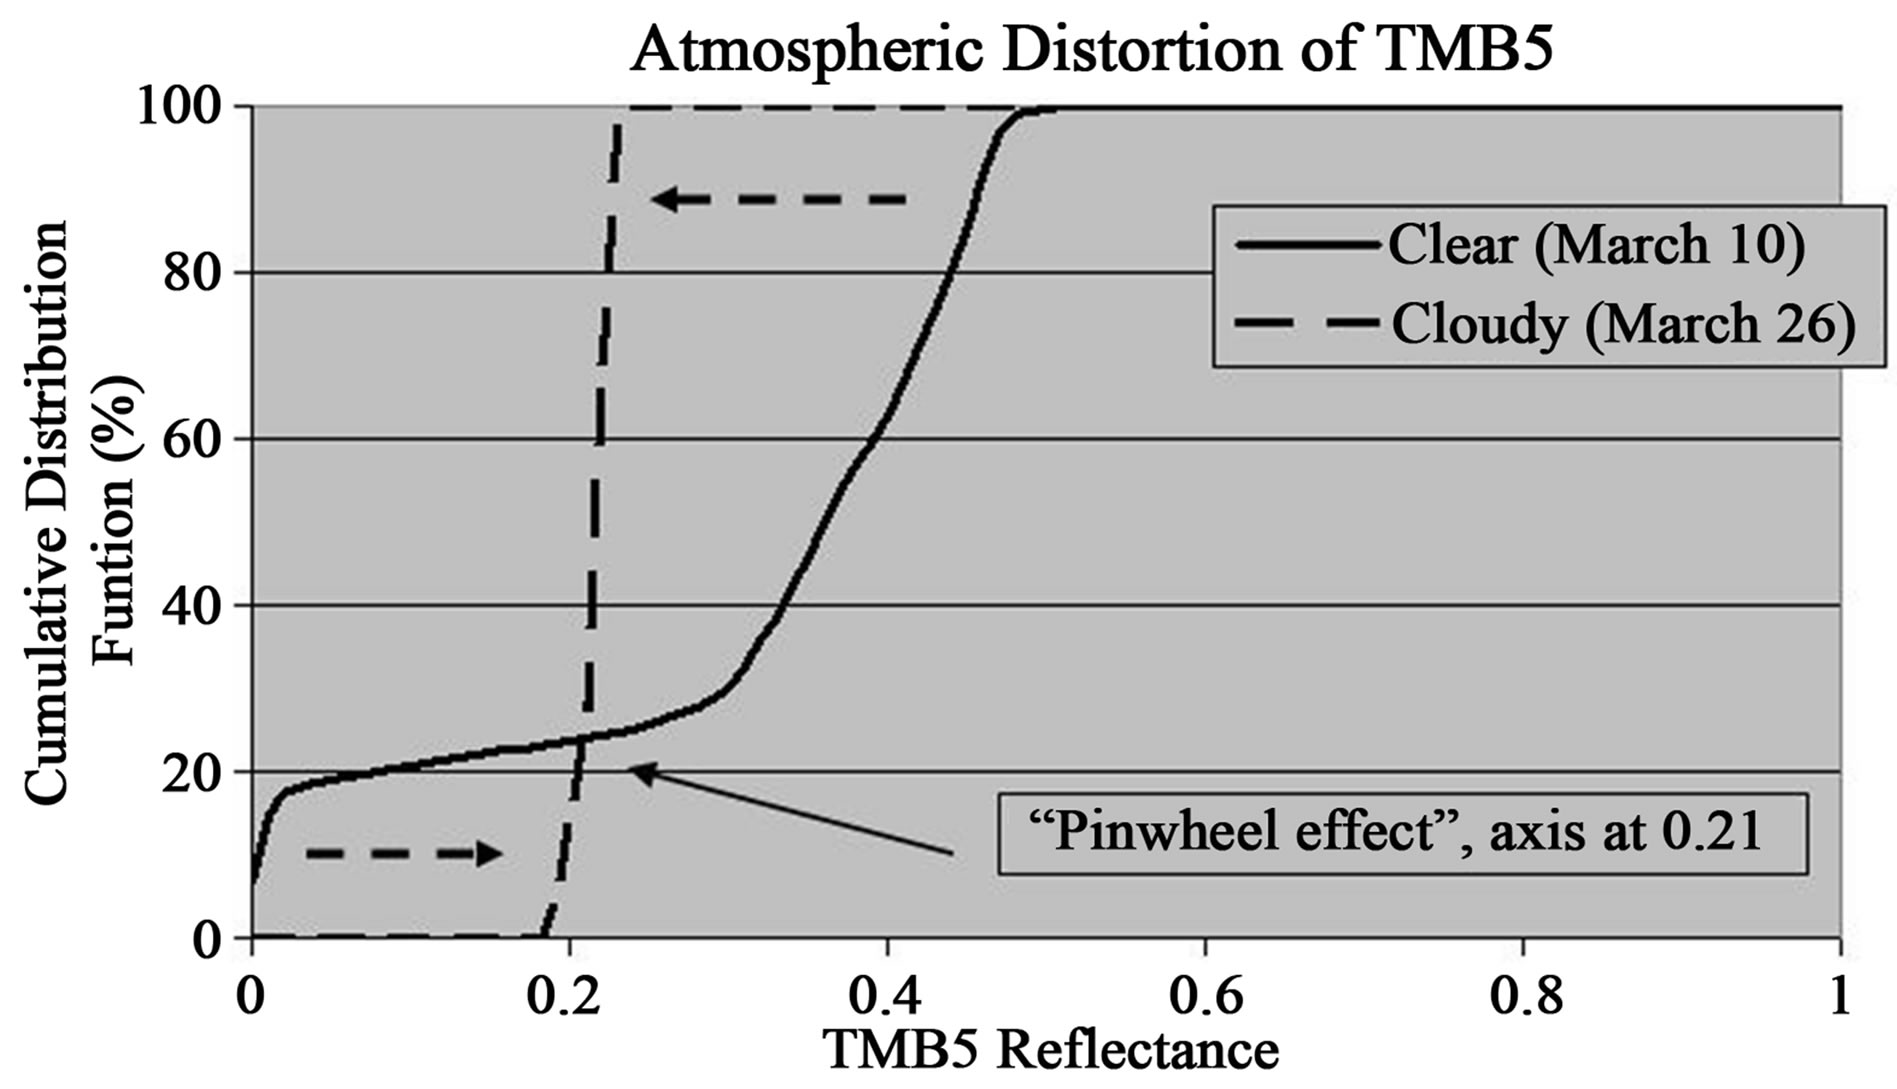
Figure 11. Results from the extracted TMB5 values for clear and cloudy conditions within the Figure 10 polygon. The distorted values moved in a pinwheel fashion around 0.21 that remained unchanged.
ward. The axis of this pinwheel was a reflectance of 0.21. Fortunately, for the sake of simplicity, 0.21 is not far removed from the 0.19 threshold. Thus, DOS or any similar type of correction was rejected in favor of simply accepting the TMB5 values when the image in question has haze and the observer can differentiate features on the ground.
The degree of thin cloud cover visible on Figure 10 is not acceptable for monitoring. Concentrations of aerosols approaching the opacity represented by the test data are clearly beyond the limit for reading the wetness signal necessary for monitoring. This can be confirmed by observing the near vertical line for March 26 on Figure 11 that shows nearly unresponsive data despite the wide difference in surface types visible on the March 10. These image features were overcome by the back scatter created by the aerosol in the cloud. The gross changes, however, are useful for interpreting how reflected light in this spectral region is distorted by aerosols and that such distortion should have minimal effect upon the quality of the monitoring determination even if slight aerosol-induced spectral distortion occurs. Hence, a hazy image would be acceptable for monitoring, but thin clouds are not.
3.3. Structure of the Monitoring Program
The remote sensing aspects described above have been used in a successful monitoring program for surface wetness at Owens Lake since 2007. Monitoring has been performed on a monthly basis during this period with generally 9 - 10 evaluations per dust season from October 1 through June 30. No instances of false positives, where the monitoring says too wet but the system is actually dry, have occurred. Thus, the validity of this remote sensing monitoring system to safeguard air quality has been confirmed.
Roadways and berms for accessing the wetting basins are surfaces managed to prevent dust release and so, are given credit as compliant areas. Likewise, since all of the wetting basins are generally surrounded by dry lakebed or roadways, pixels are given credit within the wetting basin that may contain spectral mixing with pixels outside of the basins. This is accomplished using a buffer that extends the hypotenuse of each pixel to the interior (42.4 m for a 30 m TM pixel). All pixels within this buffer are counted as compliant.
The TMB5 monitoring procedure for surface wetness is standardized with reporting occurring within live spreadsheets that are summarized in a second document that provides visual verification of any wetting basin failures. Figure 12 is the monitoring result from April 19, 2010 that was included in the documentation.
4. Challenges for the Future
The TMB5 monitoring system has proven to be a robust and dependable means to classify and track surface wetting on Owens Lake. Although the primary role of the monitoring program is to determine compliance to wetting requirements that protect air quality, the future challenge is to be able to reduce water lost to evaporation while maintaining surface protection. This challenge can be met with EOS data such as Landsat TM, the monitoring program outlined in this paper, additional data that includes
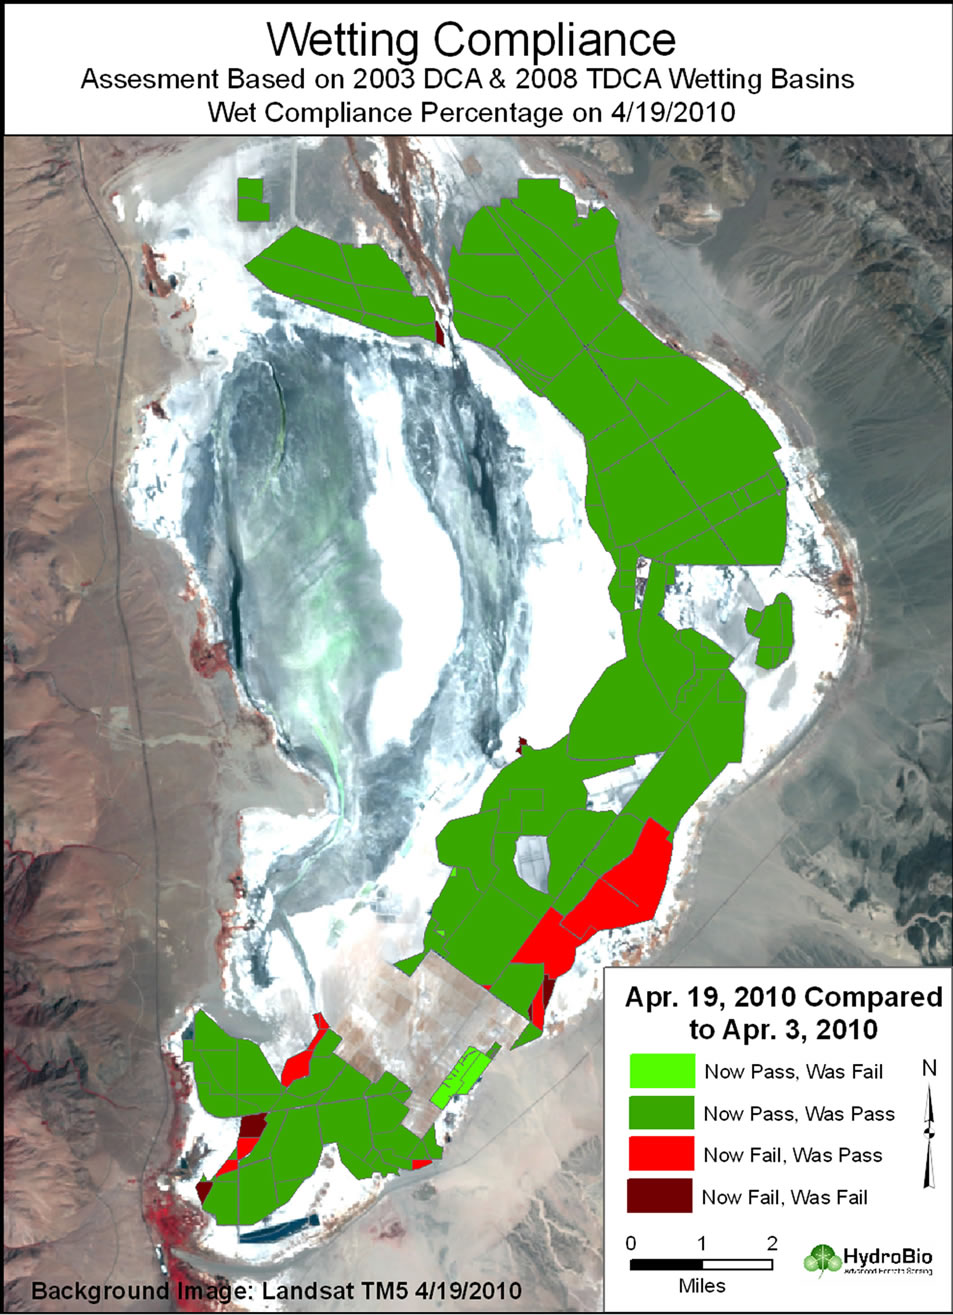
Figure 12. Monitoring result from April 19, 2010.
gage records for water releases to each wetting basin and the evaporative demand that varies with weather, for example, as characterized by the ASCE Penman ET0 [27]. As written within the State Implementation Plan [1] once the dust control system has achieved 99% control efficiency, the prescription for wetting the majority of the surfaces, currently 75% of the area in most wetting basins must be identified as wet, will gradually be relaxed. TMB5 monitoring can be adjusted to evaluate surface wetting as the wetting basins receive reduction in supply. Hence, the last role for TMB5 monitoring is to optimize water conservation.
Although false positives have not occurred, a false negative, has been identified. As noted earlier, the remediation efforts at the Owens Lake are varied and occur across areas of differing soil hydrology, for example, areas that are wetted by sprinkler. Sprinkler-served zones are one of the few areas that fall outside the norm captured by the 0.19 TMB5 threshold. Sprinkler systems produce circular wetted areas interspersed with lakebed that is not wetted directly. Repeated operation of the sprinklers creates zones of recharge that leach salts from within the sprinkler arcs, while between these wetted zones the resulting high groundwater and capillarity induces white salt efflorescence on the soil surface. The white salt surfaces, though stable, reflect highly within TMB5 and so, the averaged values that result from pixels much larger than the circular wetted areas, are driven above the 0.19 threshold by about 0.05 TMB5 reflectance. One of the zones indicated on Figure 12 failed for this reason. The 0.19 threshold is too stringent and raising the threshold to 0.24 TMB5 reflectance is a logical and expedient solution for that location.
Potential also exists to replace fresh water used for dust control in wetting basins with salt deposits as described in Groeneveld et al. [13]. The salt can be moved as brine from a deposit in the topographic low of the lakebed that contains approximately 70 million m3 of salt, quantified by several mining companies [5]. The intent of such replacement will be to maintain dust control while keeping the salt mass wet, as occurs naturally within the source deposit. This replacement is a potential solution that can be used to reduce evaporation from wetting basins that are designed to be maintained full of water. This appears to be an ideal solution for the lower elevation regions of the lakebed where the water table and fine textures combine to reduce infiltration to near zero. When annualized, the measured evaporation rates through salt crusts that float atop the brine were found to be lower than the average annual rain and snowfall on the Owens Lake, hence, brine covered surfaces should remain perpetually wet and nonemissive [13]. Fortunately, the wetting of the replacement salt mass surfaces of brine surfaces can be confirmed using the same methods that are presented here, however, a new threshold will need to be developed specifically to detect wetted conditions.
The monitoring for wetness at Owens Lake is a living program that will be changed to enable water conservation through intensive observation and varied management. For example, effects of prolonged drought have forced a revisit to the 75% wetting standards established for wetting compliance in the spring of 2013 prompted by insufficient water present in the Owens River watershed to meet all obligations. The District and the Department allowed the wetness to be reduced in each of the wetting basins combined with more intensive and efficient usage. Figure 13 provides a look at the percentage wet (i.e., area wetter than the threshold) provided by TM8 data for April 11, 2013 judged by the TMB5-equivalent threshold listed in Table 2). The initial results from this program are encouraging since no dust releases have been recorded from the wetting cells with reduced water content.
5. Acknowledgements
The authors thank the Great Basin Unified Air Pollution Control District and staff for supporting this work, espe-
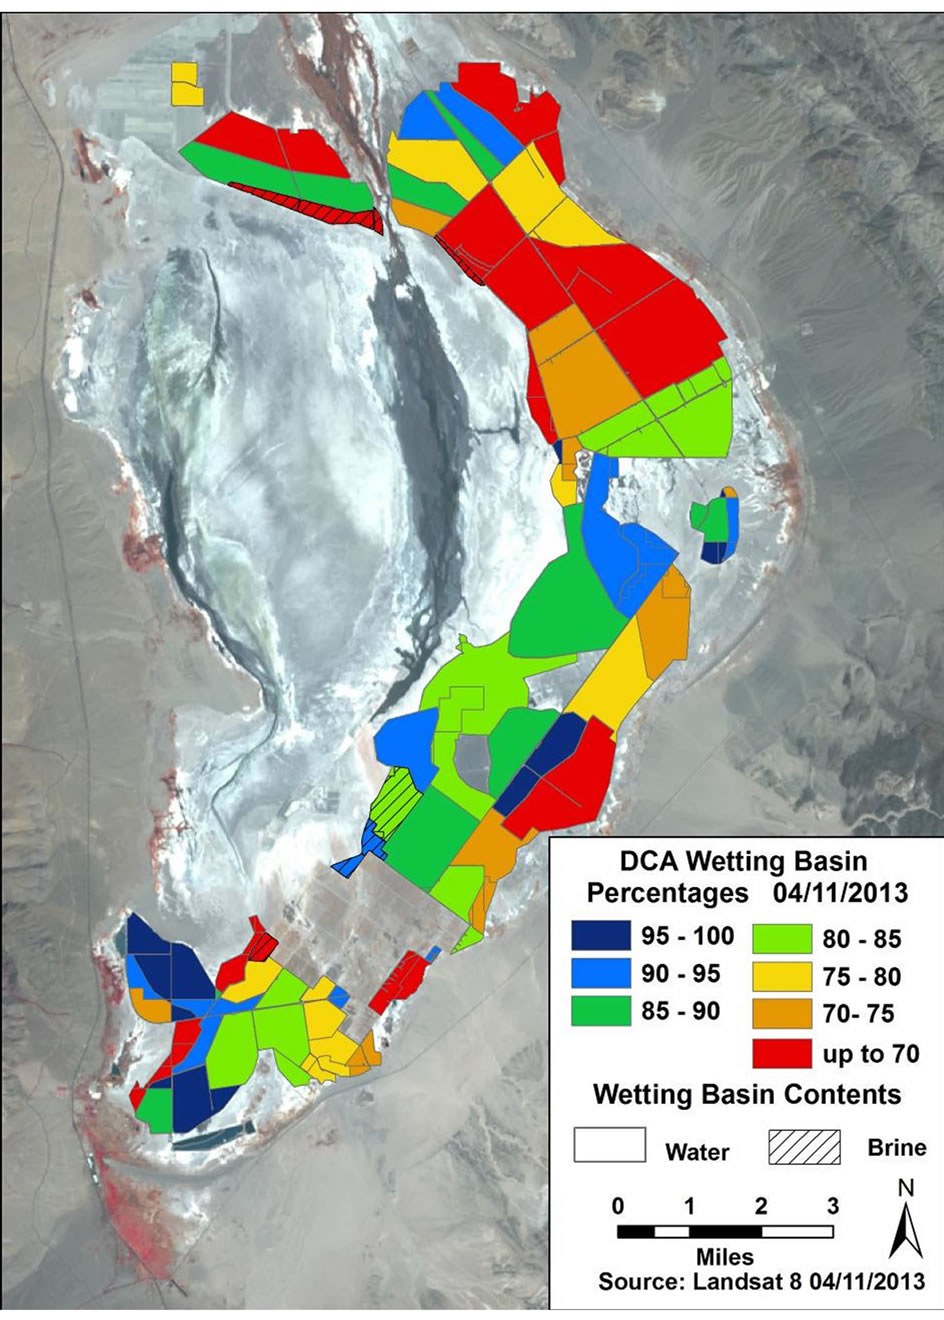
Figure 13. Monitoring result for wetness from April 11, 2013 as percent of area above the wet threshold. The system was allowed to dry as a test of the wetting criteria while accommodating the need for water conservation during a profound regional drought.
cially Ted Schade, Air Pollution Control Officer and Grace McCarley-Holder, Geologist. The authors are greatly indebted to the NASA/USGS Landsat Program for the gratis excellent data needed to develop the methods described in this paper.
REFERENCES
- Great Basin Unified Air Pollution Control District, “2008 Owens Valley PM10 Planning Area Demonstration of Attainment State Implementation Plan. Great Basin Unified Air Pollution Control District,” 2008. http://www.gbuapcd.org/Air%20Quality%20Plans/2008SIPfinal/2008%20SIP%20-%20FINAL.pdf
- W. L. Kahrl, “Water and Power,” University of California Press, Berkeley, 1982.
- H. S. Gale, “Salines in the Owens, Searles and Panamint Basins, Southeastern California,” US Geological Survey Bulletin 580, 1915, pp. 251-323.
- A. S. Jayko and S. N. Bacon, “Late Quaternary MIS 6-8 Shoreline Features of Pluvial Owens Lake, Owens Valley, Eastern California,” In: M. C. Reheis, R. Hershler and D. M. Miller, Eds., Late Cenozoic Drainage History of the Southwestern Great Basin and Lower Colorado River Region: Geologic and Biotic Perspectives, Geol Soc Am Spec Pap. 439, 2008, pp. 185-206. http://dx.doi.org/10.1130/2008.2439(08)
- S. S. Alderman, “Geology of the Owens Lake Evaporite Deposit,” 6th Int Symp Salt, 1983, pp. 75-83.
- P. Saint-Amand, L. A. Mathews, C. Gaines and R. Reinking, “Dust Storms from Owens and Mono Valleys, California,” US Naval Weapons Center, California, 1986.
- P. Saint-Amand, P. C. Gaines and D. Saint-Amand, “Owens Lake, an Ionic Soap Operas Staged on a Natric Playa,” Centennial Field Guide. Cordilleran Section of the Geological Society of America, Vol. 1, 1987, pp. 145-150.
- T. E. Gill and T. A. Cahill, “Playa-Generated Dust Storms from Owens Lake,” In: C. A. Hall Jr., V. Doyle-Jones and B. Widawski, Eds., White Mountain Research Station Symposium IV Proceedings: The History of Water: Eastern Sierra, Owens Valley, White-Inyo Range, 1991, pp. 63-73.
- Great Basin Unified Air Pollution Control District, “2003 Owens Valley PM10 Planning Area Demonstration of Attainment State Implementation Plan. Great Basin Unified Air Pollution Control District,” 2003. http://www.gbuapcd.org/Air%20Quality%20Plans/2008SIPfinal/2008%20SIP%20-%20FINAL.pdf
- W. R. Gardner and M. Fireman, “Laboratory Studies of Evaporation from Soil Columns in the Presence of a Water Table,” Soil Science, Vol. 85, No. 4, 1957, pp. 244- 249. http://dx.doi.org/10.1097/00010694-195805000-00002
- W. R. Gardner, “Some Steady-State Solutions of the Unsaturated Moisture Flow Equation with Application to Evaporation from a Water Table,” Soil Science, Vol. 85, No. 4, 1958, pp. 228-232. http://dx.doi.org/10.1097/00010694-195804000-00006
- A. Hadas and D. Hillel, “Steady-State Evaporation through Non-Homogeneous Soil Columns in the Presence of a Water Table,” Soil Science, Vol. 113, 1972. pp. 63-73.
- D. P. Groeneveld, J. L. Huntington and D. D. Barz, “Floating Brine Crusts, Reduction of Evaporation and Possible Replacement of Fresh Water to Control Dust from Owens Lakebed, California,” Journal of Hydrology, Vol. 392, No. 3-4, 2010, pp. 211-218 http://dx.doi.org/10.1016/j.jhydrol.2010.08.010
- Audubon, “New Opportunities for Birds,” 2013. http://ca.audubon.org/new-opportunities-birds-owens-lake, undated
- R. M. Johnston and M. M. Barson, “Remote Sensing of Australian Wetlands: An Evaluation of Landsat TM Data for Inventory and Classification,” Marine & Freshwater Research, Vol. 44, No. 2, 1993, pp. 235-252. http://dx.doi.org/10.1071/MF9930235
- P. S. Frazier and K. J. Page, “Water Body Detection and Delineation with Landsat TM Data,” Photogrammetric Engineering & Remote Sensing, Vol. 66, No. 12, 2000, pp. 1461-1467.
- E. P. Crist and R. C. Cicone, “A Physically-Based Transformation of Thematic Mapper Data—The TM Tasseled Cap,” IEEE Transactions on Geoscience and Remote Sensing, Vol. 22, No. 3, 1984, pp. 256-263. http://dx.doi.org/10.1109/TGRS.1984.350619
- E. P. Crist and R. J. Kauth, “The Tasseled Cap Demystified,” Photogrammetric Engineering & Remote Sensing, Vol. 52, No. 1, 1986, pp. 81-86.
- D. P. Groeneveld, R. P.Watson, D. D. Barz, J. R. Silverman and W. M. Baugh, “Assessment of Two Methods to Monitor Wetness to Control Dust Emissions, Owens Lake, California,” International Journal of Remote Sensing, Vol. 31, No. 11, 2010, pp. 3019-3035. http://dx.doi.org/10.1080/01431160903140787
- R. S. Lunetta and M. E. Balogh, “Application of Multitemporal Landsat 5 TM Imagery for Wetland Identification,” Photogrammetric Engineering & Remote Sensing, Vol. 65, No. 11, 1999, pp. 1303-1310.
- K. Hansen, “Earth-Observing Landsat 5 Turns 25,” 2009. http://landsat.gsfc.nasa.gov/news/news-archive/dyk_0013.html
- P. S. Chavez Jr., “An Improved Dark-Object Subtraction Technique for Atmospheric Scattering Correction of Multispectral Data,” Remote Sensing of Environment, Vol. 24, No. 3, 1988, pp. 459-479. http://dx.doi.org/10.1016/0034-4257(88)90019-3
- P. S. Chavez Jr., “Image-Based Atmospheric Corrections Revisited and Improved,” Photogrammetric Engineering & Remote Sensing, Vol. 62, No. 9, 1996, pp. 1025-1036.
- D. P. Groeneveld and D. D. Barz, “A Robust Empirical Relationship for Atmospheric Scatter between Red and Near-Infrared Bands,” Remote Sensing Letters, Vol. 1, No. 4, 2010, pp. 65-74. http://dx.doi.org/10.1080/01431160903154317
- R. G. Allen, L. S. Pereira, D. Raes and M. Smith, “Crop Evapotranspiration,” FAO Irrigation and Drainage Paper No. 56, 1998.
- California Irrigation Management Information System, “Monitoring Data from Owens Lake,” 2013. http://wwwcimis.water.ca.gov/cimis/welcome.jsp
- R. G. Allen, “The ASCE Standardized Reference Evapotranspiration Equation,” American Society of Civil Engineers, 2005.