Advances in Physical Education
Vol.06 No.04(2016), Article ID:71802,13 pages
10.4236/ape.2016.64036
Boxing Performance of Most Boxers Is Directed by Their Ectomorphy Ratings towards Lowest Percentages of Victories and Highest Percentages of Losses
André Mukala Nsengu Tshibangu
Department of Basic Sciences, Faculty of Pharmaceutical Sciences, University of Kinshasa, Kinshasa, Democratic Republic of the Congo

Copyright © 2016 by author and Scientific Research Publishing Inc.
This work is licensed under the Creative Commons Attribution International License (CC BY 4.0).
http://creativecommons.org/licenses/by/4.0/


Received: September 9, 2016; Accepted: November 1, 2016; Published: November 4, 2016
ABSTRACT
High level performance is influenced by the three somatotype components: endo- morphy, mesomorphy, and ectomorphy. Mesomorphy is the most important of the three for boxing practice. An increase in ectomorphy rating is always accompanied by a decrease in mesomorphy rating. Is thus a higher ectomorphy rating overtaxing and/or counterproductive for boxing performance? That is the basis of the present study and the results follow. Boxing could overtax the practitioner the least at the ectomorphy rating value of 2.5. With increasing and with decreasing rating values from 2.5, boxing could overtax even more the practitioner. At the ectomorphy rating of 2.5, boxing is counterproductive: one finds lowest percentages of KO victories and of all victories (KO and non-KO) pulled together; as well as highest percentages of non-KO losses and of all losses (KO and non-KO) pulled together. With boxers ec- tomorphy rating moving from 2.5 towards 0.1 or towards 5.1, there are: an increase in all victories (KO and non-KO) pulled together percentages and the consequent decrease in all losses (KO and non-KO) pulled together percentages; an increase in KO victories percentages and the consequent decrease in non-KO victories percentages; and a increase in KO losses percentages and the consequent decrease in non-KO losses percentages. With boxer ectomorphy ratings increasing from 0.1 to 5.1, percentages of draws go on decreasing. Taking into account ectomorphy ratings could thus help organizers select boxers so as to increase the probability of a given decision: KO victory by Mike Tyson, non-KO victory by Ken Buchanan, for instance.
Keywords:
Anthropometry, Boxing, Draws, Ectomorphy, Losses, Performance, Victories

1. Introduction
1.1. Anthropometric Factors Influence High Level Performance
Success in a given sport event is underlay, among other factors, by anthropometric fac- tors, which optimal values are held by the athletes more successful than others, the lat- ter holding values more and more distant from the optimal ones, as the success de- crease (Carter & Ackland, 2009; Tshibangu, 2015) .
That may be taken into account when recruiting sportsmen and sportswomen or when selecting them for competition.
1.2. Somatotype Influence High Level Performance
Carter and Ackland (2009) think on one hand that an individual with a highly suitable somatotype will probably do well in a particular sport, and on the other hand, that us- ing the somatotypes of successful athletes for models, it is possible, with some degree of accuracy, to predict the most appropriate sport or event for an athlete.
1.3. Somatotype Components Are Endomorphy, Mesomorphy, and Ectomorphy (Carter & Ackland, 2009)
The quantified expression named somatotype consists of a three-numeral rating, each numeral describing a particular component of the physique.
The first numeral describes the relative adiposity of a physique and is named endomorphy. The second numeral describes the relative musculoskeletal robustness of a physique and is named mesomorphy. The third numeral describes the relative linearity or slenderness of a physique and is named ectomorphy.
1.4. Endomorphy
As individuals from the normal population are generally more endomorphic than high- level male and female athletes (Carter & Ackland, 2009) , we expect high levels of en- domorphy rating to be generally counterproductive and/or overtaxing while perform- ing sport activities.
1.5. Mesomorphy (Carter & Ackland, 2009)
Athletes show higher ratings of mesomorphy when compared to non athletes.
In some sports, mesomorphy is the most important of the three somatotype compo- nents because strength, explosive power, speed, and agility are highly related to this characteristic. That is the case for boxing.
1.6. Ectomorphy
An examination of somatotypes ratings of the boxers (Carter & Ackland, 2009) reveals that an increase in ectomorphy ratings is accompanied always by a decrease in mesomorphy ratings.
1.7. Is Ectomorphy Counterproductive and/or Overtaxing for Boxing Performance?
As an increase in ectomorphy ratings is accompanied by a decrease in mesomorphy ratings, while mesomorphy is the most important of the three components of somato- type in boxers, one may wonder 1) whether a higher ectomorphy rating is counterpro- ductive for boxing practice or not; and 2) whether a higher ectomorphy rating is over- taxing for the boxing practitioner.
As a reply to the two concerns, it is useful to find out a possible impact of ectomor- phy on boxing performance.
In the case that there exists a relationship between the ectomorphy rating and the performance of a boxer, the former could help predict the latter.
2. Material and Methods
2.1. Subjects Enrolled
The subjects enrolled in the present study are 98 among the World top 100 male professional boxers, BoxRec.com ranked, and retired in the period of time lasting from the beginning of professional boxing practice to March 26th, 2013 . The boxers are 98 instead of 100 because BoxRec.com, the web-based database, failed to show the height of 2 boxers, data useful for rating the ectomorphy of the 2 subjects.
2.2. Weights of the Boxers
A boxing weight division is a class interval in which the difference of the weights held by the boxers are considered to have no significant influence on the performance of the boxers and thus on the decisions made by the judges at the end of the battles.
Contrary to his height, the weight of each of the 98 boxers has not been available and has hence been considered to be the midpoint of the weight division to which belongs the boxer. In fact (Daniel, 1987) , with the purpose of computing the mean from grouped data, one assumes that each value that belongs to a given class interval is situated at the midpoint.
2.3. Analysis of Data
Microsoft Office Excel 2007 program has been used in the analysis of data gathered from BoxRec.com, the web based database, about the boxers.
2.4. Ectomorphy Rating
Ectomorphy may be rated using the Heath-Carter somatotype rating form (Carter & Ackland, 2009) .
Equations may also be used with the same purpose (López-Silvarrey Varela & Calderón Montero, 1996) . They have been used in the present study.
Rating ectomorphy by equations uses the height-weight ratio (HWR) as given by Equation (1). Taking into account the HWR, ectomorphy is rated according to Equation (2), Equation (3) and Equation (4).
 (1)
(1)
If HWR > 40.75,
 (2)
(2)
If HWR is included in the interval [38.28 - 40.75],
 (3)
(3)
If HWR < 38.28,
 (4)
(4)
In the Equation (4), 0.1 is the value arbitrarily given to each of the cases where HWR is <38.28.
2.5. Ectomorphy Class Intervals
To split up into classes the ectomorphy ratings obtained with the aforesaid equations, Sturges’ rule (Daniel, 1987) has been used: if “n” is the number of values in the data set under consideration; if “k” stands for the number of class intervals; if “R”, the range, is the difference between the smallest and the largest observation in the data set; and if “w” is the class interval width; the Sturges’ rule is given by Equation (5); and the width of each class interval is given by Equation (6).
 (5)
(5)
 (6)
(6)
The 98 boxers have thus been split up into 10 ectomorphy classes according to the ectomorphy rating held by each of them: 1) from 0.1 to 0.5; 2) from 0.6 to 1.0; 3) from 1.1 to 1.5; 4) from 1.6 to 2.0; 5) from 2.1 to 2.5; 6) from 2.6 to 3.0; 7) 3.1 to 3.5; 8) 3.6 to 4.0; 9) from 4.1 to 4.5; and 10) 4.6 to 5.1.
2.6. Relationship between Ectomorphy and Decisions Made by the Judges at the End of Boxing Battles
There was a need to conclude in the existence or the nonexistence of relationships (ei- ther positive or negative) between sets of data pairs: 1) ectomorphy ratings on one hand and on the other hand the variables that influence ectomorphy ratings (heights and weights); and 2) ectomorphy ratings on one hand and on the other hand the decisions (victories, losses and draws) made by the judges at the end of boxing battles.
To meet the purpose, scatter diagrams have been plotted to represent each pair of va- riables (Parker, 1979) .
For each boxer, the decisions (victories, losses and draws) have been expressed as percents of all the battles fought by the boxer.
For each class interval into which ectomorphy ratings have been split up, the corres- ponding values of the battle decisions (victories, losses and draws) have been computed as the means of the values shown by the boxers of the concerned class interval.
3. Results
3.1. Ectomorphy Ratings Mean Value, Heights Mean Value, and Weights Mean Value
In 98 of the World top 100 male professional boxers, BoxRec.com rated, and retired in the period of time lasting from the beginning of professional boxing practice to March 26th, 2013 ; computed ectomorphy ratings mean value is 2.5; computed heights mean value is 174.7 cm, and computed weights mean value is 71.2 kg.
The computed ectomorphy ratings range from 0.1 to 5.1. According to López-Sil- varrey Varela and Calderón Montero (1996), the ectomorphy rating mean value (2.5) is a low value; the 98 boxers enrolled in the present study rate, in ectomorphy, low and medium values; and there exist persons who rate more than 7 in ectomorphy.
3.2. Relationships between Ectomorphy Ratings on One Hand and on the Other Hand the Means of the Heights as Well as the Means of the Weights of the Same Ectomorphy Rating Boxers
In the present study, ectomorphy has been rated thanks to equations using the height- weight ratio.
There exist relationships between ectomorphy ratings on one hand and on the other hand the means of the heights as well as the means of the weights of the same ecto- morphy rating boxers here concerned (Table 1 and Figure 1). Regarding the same ec- tomorphy rating boxers, Figure 1 shows that the regression equations account for a larger proportion of variability in the observed values of the means of weights [higher values of coefficients of determination (R2)] than the proportion of variability in the observed values of the means of heights [lower values of coefficients of determination (R2)].

Table 1. Relationship between ectomorphy ratings on one hand and on the other hand the num- bers of boxers, the means of the heights as well as the means of the weights of the same ectomor- phy rating boxers.
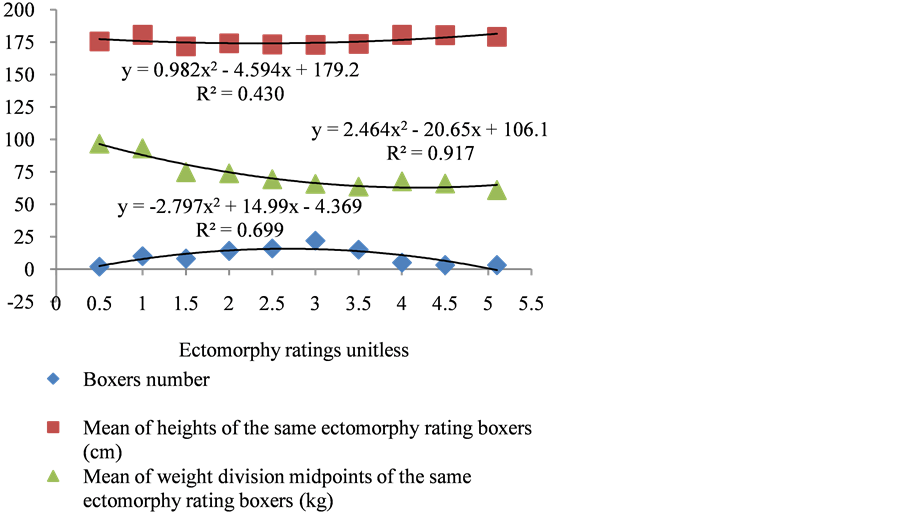
Figure 1. Relationship between ectomorphy ratings on one hand and on the other hand the numbers of boxers, the means of the heights as well as the means of the weights of the same ec- tomorphy rating boxers. With increasing ectomorphy rating, the polynomial trend lines show an increase in the numbers to a maximal value before a subsequent decrease; and for both the heights and the weights, decreases to minimal values before subsequent increases.
3.3. Proportion of Boxers Rating 2.5 in Ectomorphy
There exists a relationship between ectomorphy ratings on one hand and on the other hand the number of the boxers who fall in the respective ectomorphy class interval (Table 1 and Figure 1). The resulting polynomial trend line (Figure 1) shows an in- crease in the number of boxers to a maximal value before a subsequent decrease. The maximal value is near to the point of ectomorphy rating 2.5.
3.4. Victories
All victories (KO and non-KO) pulled together
With increasing ectomorphy ratings, the polynomial trend line shows a decrease of the percentages of all victories to a minimal value before a subsequent increase (Table 2 and Figure 2).
KO victories
With increasing ectomorphy ratings, the polynomial trend line shows a decrease of the percentages of KO victories to a minimal value before a subsequent increase (Table 2 and Figure 2).
Non-KO victories
With increasing ectomorphy ratings, the polynomial trend line shows an increase of the percentages of non-KO victories to a maximal value before a subsequent decrease (Table 2 and Figure 2).
Table 2. Relationship between ectomorphy ratings on one hand and on the other hand the per- centages of victories (all pulled together, KO, and non-KO); the percentages of losses (all pulled together, KO, and non-KO); as well as the percentages of draws.
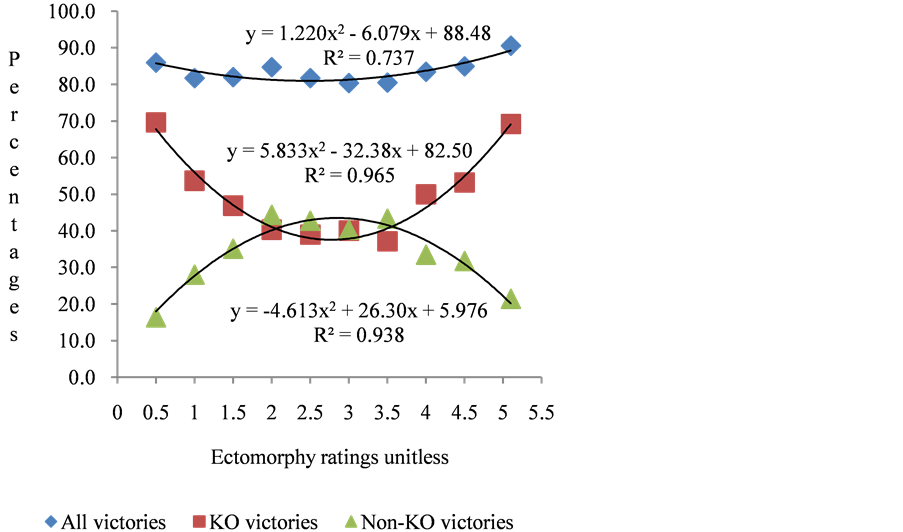
Figure 2. Relationship between ectomorphy ratings on one hand and on the other hand the percentages of victories (all pulled together, KO, and non-KO). With increasing ectomorphy ratings, the polynomial trend lines show a decrease in the percentages of all victories to a minimal value before a subsequent increase; a decrease in the percentages of KO victories to a minimal value before a subsequent increase, and an increase in the percentages of non-KO victories to a max- imal value before a subsequent decrease.
3.5. Losses
All losses (KO and non-KO) pulled together
With increasing ectomorphy ratings, the polynomial trend line shows an increase of the percentages of all losses to a maximal value before a subsequent decrease (Table 2 and Figure 3).
KO losses
With increasing ectomorphy ratings, the polynomial trend line shows a decrease of the percentages of KO losses to a minimal value before a subsequent increase (Table 2 and Figure 3).
Non-KO losses
With increasing ectomorphy ratings, the polynomial trend line shows an increase of the percentages of non-KO losses to a maximal value before a subsequent decrease (Table 2 and Figure 3).
3.6. Draws
With increasing ectomorphy ratings, the polynomial trend line show a decrease of the percentages of draws (Table 2 and Figure 4).
4. Discussion
4.1. Boxing Could Overtax the Practitioner the Least at the Ectomorphy Rating of 2.5
Comparing the mean value of ectomorphy ratings held by the 98 World top male
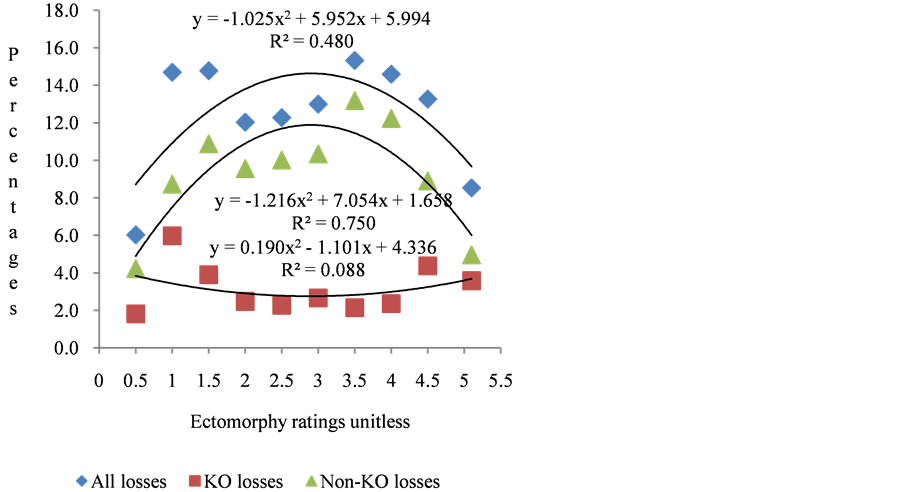
Figure 3. Relationship between ectomorphy ratings on one hand and on the other hand the percentages of losses (all pulled together, KO, and non-KO). With increasing ectomorphy ratings, the polynomial trend lines show an increase in the percentages of all losses to a maximal value before a subsequent decrease; a decrease in the percentages of KO losses to a minimal value before a subsequent increase; and an increase in the percentages of non-KO losses to a maximal value before a subsequent decrease.
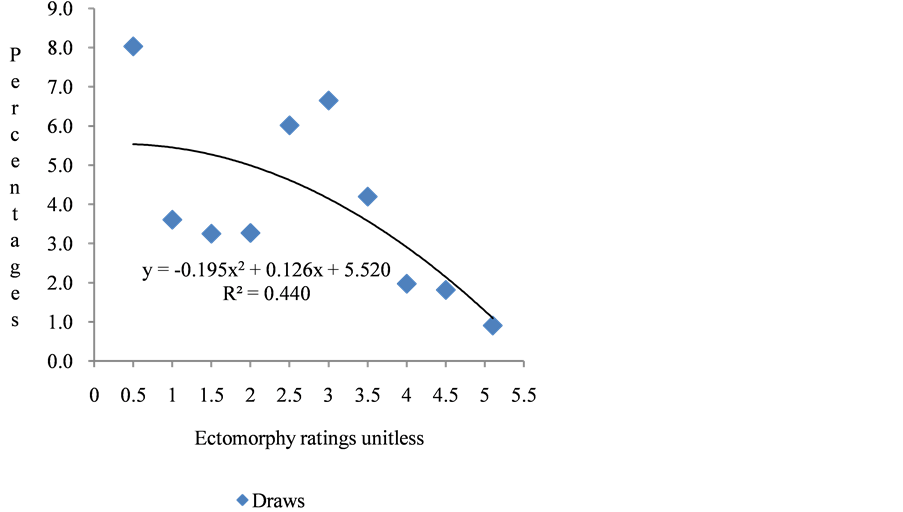
Figure 4. Relationship between ectomorphy ratings on one hand and on the other hand the percentages of draws. With increasing ectomorphy ratings, the polynomial trend line shows a decrease in the percentages of draws.
professional boxers enrolled in the present study has yielded the value 2.5. That value is consistent with values signaled by other authors, as signaled directly below.
Male boxer ectomorphy ratings from National Centers of Sports Medicine (“Centros Nacionales de Medicina Deportiva”) yielded 2.4 as mean value (López-Silvarrey Varela & Calderón Montero, 1996) .
Boxers ectomorphy ratings mean value has been reported to be 2.5 by Carter & Ackland (2009) in comparisons among combat sports after somatotyping 176 Korean national-level players selected from four different sports (boxing, judo, taekwondo, and wrestling).
Most of the 98 male boxers enrolled in the present study rate about 2.5 in ectomorphy (Figure 1). The ectomorphy rating value of 2.5 may thus be the rating at which boxing overtax the least boxing practitioners. It may be the rating at which encouraging factors counterbalance discouraging factors in boxing practice. Discouraging factors could express themselves the strongest both with decreasing ectomorphy ratings below 2.5 and with increasing ectomorphy ratings above 2.5.
Heath and Carter made ectomorphy scale range from 0.5 to more than 9.0 (Carter & Ackland, 2009) . In accordance with various authors, López-Silvarrey Varela & Calderón Montero (1996) 1) would consider the mean value (2.5) to be a low ectomorphy rating; 2) would consider the range of ectomorphy ratings of the 98 boxers (0.1 to 5.1) to be a range of low and medium ectomorphy ratings; while 3) there exist high and very high ectomorphy ratings. In the case that boxing practice could overtax the practitioner with increasing ectomorphy ratings above 2.5, it is not unsound to think that above the rating value of 5.1, boxing practice could overtax even more the practitioner.
4.2. Boxing Is Counterproductive at the Ectomorphy Rating of 2.5
Pulling together all victories (KO victories and non-KO victories) for each ectomorphy rating concerned in the present study, one finds that the lowest percentage is shown at the ectomorphy rating of 2.5 (Figure 2). On the other hand, at the same ectomorphy rating, one finds the highest percentage when all losses (KO losses and non-KO losses) are pulled together.
Boxing performance at the ectomorphy rating of 2.5 achieves thus the opposite result to that expected by the boxers.
4.3. Lowest Percentages of both KO Victories and KO Losses Are Found at the Ectomorphy Rating of 2.5
At ectomorphy rating of 2.5, the boxers produce the lowest percentages of both KO victories (Figure 2) and KO losses (Figure 3). At that rating, the factors that decrease both kinds of percentages could express themselves the strongest while the factors that increase both kinds of percentages could express themselves the weakest.
Regarding the lowest percentages of KO victories, we wonder whether rating 2.5 in ectomorphy makes the rating holder unable to land KO inducing blows.
Regarding the lowest percentages of KO losses, we wonder whether the 2.5 ectomorphy rating holders are the least sensitive to or the most able to avoid KO inducing blows.
4.4. Highest Percentages of both Non-KO Victories and Non-KO Losses Are Found at the Ectomorphy Rating of 2.5
At ectomorphy rating of 2.5, the boxers produce the highest percentages of both non- KO victories (Figure 2) and non-KO losses (Figure 3).
That was expectable taking into account the fact that at the concerned rating value, the boxers produce the lowest percentages of both KO victories (Figure 2) and KO losses (Figure 3).
4.5. Increasing Ectomorphy Ratings from 2.5 or Decreasing Ectomorphy Ratings from 2.5 Improves Boxing Performances
With boxer ectomorphy ratings moving from 2.5 towards 0.1 or towards 5.1, there are 1) an increase in all victories (KO victories and non-KO victories) pulled together percentages and the consequent decrease in all losses (KO losses and non-KO losses) pulled together percentages (Figure 2 and Figure 3), which achieves what is expected by boxers; 2) an increase in KO victories percentages and the consequent decrease in non-KO victories percentages (Figure 2); 3) a increase in KO losses percentages and the consequent decrease in non-KO losses percentages (Figure 3); 4) an increase in heights (Figure 1); and 5) an increase in weights (Figure 1).
The improvement in boxing performance may be explained by the corresponding variations in heights and weights for the varying ectomorphy ratings.
From ectomorphy rating 2.5, the increases in KO victories percentages may be explained by increases in heights and weights.
In fact, the boxers are expected to have increasing reaches when their heights go on increasing. That allows them to hit from a safe distance defenseless legal targets of the opponents shorter than them. Meanwhile, whenever the shorter opponents take the risk of attacking, they may suffer counterpunches landed by the taller boxers. The collision of a shorter boxer legal target with a taller boxer counterpunch is expected to be more powerful than the impact of a normal punch with the target, due to the synergy of the counterpunch power with the power that moves in the opposite direction the shorter boxer who is often obliged to get closer to the taller so as to reach the latter’s legal targets. The synergy is possible even in educational boxing where each boxer strives to increase the safety of the opponent he is aimed to win by landing him exclusively light touches instead of blows (Tshibangu, 2009) .
The synergy could contribute to the increase in KO victories percentages with increasing heights of professional boxers concerned by the present study.
Easier than a shorter boxer, a taller boxer is expected to reach rapidly a runaway shorter opponent as well as to flee rapidly from a shorter attacker, thanks to his major strides. That could contribute to the increase in all victories pulled together percentages, with increasing heights of boxers.
Moreover, Vandervael (1980) mentioned the correlation found between height and cleverness, what tools better for survival higher individuals than shorter. Taller boxers could thus be better strategists than shorter boxers.
Extra weight in the form of muscle mass contributes to performance in sports events where great forces are produced (Reilly & Secher, 1990) . That could explain the contribution of increasing weights in boxing performance improvement with increasing ectomorphy ratings from 2.5.
4.6. Boxer Ectomorphy Ratings Increasing from 0.1 to 5.1 Decreases Percentages of Draws
The increase in draws percentages from 0.1 to 5.1 (Figure 4) may help organize boxing matches so as to decrease the probability of a draw decision.
The draw decision may cause the crowd treat boxers with so much derision that two of them have even been treated as assholes in Madison Square Garden (Oates, 2006) .
5. Conclusion
Boxing could overtax the practitioner the least at the ectomorphy rating value of 2.5. With increasing and with decreasing rating values from 2.5, boxing could overtax even more the practitioner.
At the ectomorphy rating of 2.5, boxing is counterproductive: one finds lowest percentages of all victories pulled together (KO and non-KO), and of KO victories; as well as highest percentages of all losses pulled together (KO and non-KO), and of non-KO losses.
With boxers ectomorphy rating moving from 2.5 towards 0.1 or towards 5.1, there are: an increase in all victories (KO and non-KO) pulled together percentages and the consequent decrease in all losses (KO and non-KO) pulled together percentages; an increase in KO victories percentages and the consequent decrease in non-KO victories percentages; and an increase in KO losses percentages and the consequent decrease in non-KO losses percentages.
With boxer ectomorphy ratings increasing from 0.1 to 5.1, percentages of draws go on decreasing.
Taking into account ectomorphy ratings could thus help organizers select the boxers so as to increase the probability of a given decision: KO victory by Mike Tyson, non- KO victory by Ken Buchanan, for instance.
6. Perspective
The above discussion has yielded interesting suppositions (inability of some boxers to land KO inducing blows, great ability of some boxers to avoid KO inducing blows, and less sensitivity of other boxers to KO inducing blows).
In the case that what supposed is certain, the biological basis that underlies it is worth finding out.
Acknowledgements
Data on the subjects enrolled in the present study have been gathered from BoxRec.com, the web-based database. The author of the study expresses here his gratitude to BoxRec.com.
Cite this paper
Tshibangu, A. M. N. (2016). Boxing Performance of Most Boxers Is Directed by Their Ectomorphy Ratings towards Lowest Percentages of Victories and Highest Percentages of Losses. Advances in Physical Education, 6, 351-363. http://dx.doi.org/10.4236/ape.2016.64036
References
- 1. BoxRec.com (2013). BoxRec Boxing Records.
http://boxrec.com/ [Paper reference 4] - 2. Carter, J. E. L., & Ackland, T. R. (2009). Somatotype in Sport. In T. R. Ackland, B. C. Elliot, & J. Bloomfield (Eds.), Applied Anatomy and Biomechanics in Sport (pp. 47-66). Champain, IL: Human Kinetics. [Paper reference 9]
- 3. Daniel, W. W. (1987). Biostatistics: a Foundation for Analysis in the Health Sciences (4th ed.). New York: John Wiley & Sons. [Paper reference 2]
- 4. López-Silvarrey Varela, F. J., & Calderón Montero, F. J. (1996). Cineantropometría. In J. C. Legido Arce, J. C. Segovia Martínez, & F. J. López-Silvarrey Varela (Eds.), Manual de Valoración Funcional (pp. 53-83). Madrid: Eurobook S.L. [Paper reference 3]
- 5. Oates, J. C. (2006). On Boxing (3rd ed.). New York: HarperCollins Publishers. [Paper reference 1]
- 6. Parker, R. E. (1979). Introductory Statistics for Biology (2nd ed.). New York: Cambridge University Press. [Paper reference 1]
- 7. Reilly, T., & Secher, N. (1990). Physiology of Sports: An Overview. In T. Reilly, N. Secher, P. Snell, & C. Williams (Eds.), Physiology of Sports (pp. 465-485). London: E. & F.N. Spon. [Paper reference 1]
- 8. Tshibangu, A. M. N. (2009). Educational Boxing Totally Harmless or Only Safer than Amateur and Professional Boxing? Science & Sports, 24, 221-228.
http://dx.doi.org/10.1016/j.scispo.2009.02.001 [Paper reference 1] - 9. Tshibangu, A. M. N. (2015). Boxing Competitors Being the Exception; Judo, 1500 m Running, and Marathon Running Competitors at the 2012 London Olympic Games Held Inadequate Ages, Heights and/or Weights That Contributed to the Humiliating Defeats of Democratic Republic of the Congo. Advances in Physical Education, 5, 286-298.
http://dx.doi.org/10.4236/ape.2015.54034 [Paper reference 1] - 10. Vandervael, F. (1980). Biométrie Humaine. Paris: Masson. [Paper reference 1]