Advances in Materials Physics and Chemistry
Vol.3 No.2(2013), Article ID:33309,7 pages DOI:10.4236/ampc.2013.32022
Elucidation of Active Species over Ru/MnO Catalyst on Co2/H2 Methanation Reaction
Department of Chemistry, Faculty of Science, Universiti Teknologi Malaysia, Johor Bahru, Malaysia
Email: *wanazelee@yahoo.com
Copyright © 2013 Wan Azelee Wan Abu Bakar et al. This is an open access article distributed under the Creative Commons Attribution License, which permits unrestricted use, distribution, and reproduction in any medium, provided the original work is properly cited.
Received March 8, 2013; revised May 3, 2013; accepted May 17, 2013
Keywords: X-Ray Diffraction; CO2 Methanation; Catalysts; Active Species
ABSTRACT
The information regarding phase changes and structure transformation, particle sizes as well as active species of the catalyst are briefly discussed towards alumina supported Ru/MnO catalysts according to their various parameters of calcination temperatures and Mn loading. The Ru/Mn-75/Al2O3 catalysts calcined at 400˚C, 700˚C, 900˚C, 1000˚C and 1100˚C, Ru/Mn-65/Al2O3 and Ru/Mn-85/Al2O3 catalyst calcined at 1000˚C were synthesized by the wetness impregnation method. All the prepared catalysts exhibited crystallite size in the range of 95 nm to 114 nm. It was found that the catalyst with Ru/Mn-75/Al2O3 calcined at 1000˚C showed the highest 60.21% CO2 conversion with 57.84% formation of CH4 at the reaction temperature 200˚C. The expected active species that assist the CO2 methanation activity over this catalyst was Mn3O4.
1. Introduction
X-Ray Diffraction (XRD) analysis is one of the most important methods in determining the structure of complex natural products such as steroids, vitamins and antibiotics. Meanwhile, XRD analysis on the supported catalysts was done to reveal information about the crystallographic structure, chemical composition and physical properties of the catalyst [1-3]. Kizling and Regali [4] found that zirconium oxide analyzed by XRD exists in two crystalline structures, tetragonal and monoclinic. The synthesized material remained amorphous when calcined at 400˚C, while at 500˚C it showed crystalline structure consisting mainly of the tetragonal zirconia. From this result, it proved that the XRD technique can provide the qualitative identification of crystalline materials [5]. However, to obtain qualitative and quantitative information of the compound, the sample must be in solid form. The energetic X-rays can penetrate deep into the materials and provide information about the bulk structure. The operation follows Bragg’s law as shown in Equation (1).
 (1)
(1)
where d = distance between two lattice points, θ = scattering angle, n = integer representing the order of the diffraction peak, λ = wavelength of the X-ray.
The output of this analysis is in the form of a diffractogram which is the plot of intensity versus 2θ. Peak position, width and intensity were then identified by a comparison with standards data Powder Diffraction Files (PDF) provided by the software used in this technique. Crystallographic phase present in the catalyst produces well-defined diffraction peaks whose widths are related to the crystalline quality. Crystalline phases are represented by sharp and narrow peaks, while amorphous phases are represented by broad and weak peaks [5]. Moreover, it can supply information regarding the crystallite size that can be calculated by Scherrer equation as shown in Equation (2).
 (2)
(2)
where d = Crystallite Size (nm), λ = wavelength of the X-ray, θ = scattering angle, β = FWHM value.
The knowledge of catalyst structure is essential in order to understand the properties of the catalyst’s surface. Therefore, most of the researchers had used the XRD analysis in their research. Nasr-Allah [6] who had examined the XRD analysis on pure and doped Mn/Al mixed solids calcined at 500˚C, 800˚C, and 900˚C revealed a nanocrystalline nature for the bulk structure of the catalysts prepared. Though in heterogeneous catalysis the active sites are usually located on the solid surface, the bulk structure also plays an important role, because many of the catalyst characteristics depend on it [7]. Therefore, this paper will focus on the application of XRD analysis technique over alumina supported Ru-MnO catalysts with particular emphasis on their catalytic performance towards CO2 methanation reaction.
2. Experimental
2.1. Preparation of Catalysts
MnCl2∙2H2O (5 g) obtained from Sigma Aldrich was dissolved with 2 mL of triply distilled water. Mixed catalysts solution was prepared by mixing an appropriate amount of RuCl3∙xH2O (Sigma Aldrich) with MnCl2∙ 2H2O solution according to its ratio. The catalysts were prepared by impregnating the catalyst solution on 10 g of Al2O3 beads (Sigma Aldrich) support for 15 minutes and then it was took out and dried at ambient temperature. The impregnation and drying were repeated for three times. Then the impregnated Al2O3-bead was washeddispensed with triply distilled water to remove chloride ion. This process was repeated until no colour change of AgNO3 reagent. It was then aged at 80˚C for 24 hours and calcined in the furnace over various calcination temperatures.
2.2. Characterization
XRD analysis was conducted by using Siemens D5000 Crystalloflex X-Ray Diffractometer equipped with Cu target (λCuKα = 1.54 Ǻ) radiation. Using a step scan of 0.050˚ and a step time of a second per step, data were collected over the range of 2θ from 20˚ to 80˚.
2.3. Catalytic Performance
All the prepared catalysts were tested its catalytic activity towards carbon dioxide methanation reaction by using inhouse-built micro reactor. The analysis was conducted using continuous flow of CO2, H2 and compressed air (10:40: 50) mixture with flow rate of 100 mL/min. This reactor was coupled with FTIR Nicolet Avatar 370 DTGS. The formation of methane was detected by Hewlett-Packard 6890 Series GC System (Ultra 1) with 25.0 m × 200 μm × 0.11 μm nominal column, helium gas as the carrier gas with flow rate of 20 mL/min at 75 kPa, and using Flame Ionization Detector (FID). The measurements were conducted at reaction temperatures of 100˚C to 400˚C.
3. Results and Discussion
3.1. Characterization of the Catalysts
All the prepared catalysts presented in Table 1 were analyzed by XRD analysis in order to determine the pattern of diffractogram as well as to identify the active oxide phases which contribute to the good catalytic activity. All the XRD patterns towards the fresh Ru/Mn/Al2O3 catalysts over various calcination temperatures is shown in Figures 1 and 2 while over various loading of Mn in Figure 3. The XRD pattern over fresh and used catalyst is displayed in Figure 4. The peak phases, 2θ values and d spacing value obtained from XRD are clearly discussed. The average crystallite sizes of the prepared catalysts are calculated from XRD peak broadening using the Scherrer equation (Equation (2)). The crystallite size observed was not significantly different among the prepared catalysts which around 95 nm - 114 nm.
From Figures 1 and 2, it can be seen that the phasechanges with the increasing of calcination temperatures from 400˚C to 700˚C and 900˚C to 1100˚C. XRD diffractogram of fresh (Figure 1(a)) Ru/Mn-75/Al2O3 catalyst for calcination temperature of 400˚C showed very low degree of crystallinity. All the peaks could be attributed
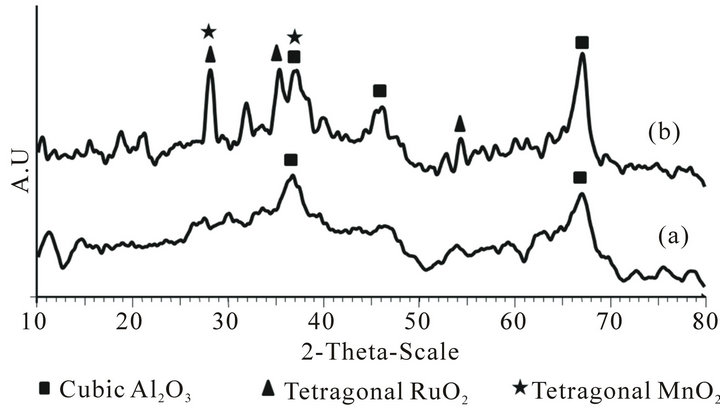
Figure 1. The overlay of XRD diffractograms of fresh Ru/Mn-75/Al2O3 catalysts calcined at (a) 400˚C and (b) 700˚C for 5 h.

Figure 2. The overlay of XRD diffractograms of fresh Ru/Mn-75/Al2O3 catalysts calcined at (a) 900˚C, (b) 1000˚C and (c) 1100˚C for 5 h.

Figure 3. The overlay of XRD diffractograms of fresh (a) Ru/Mn-65/Al2O3; (b) Ru/Mn-75/Al2O3; and (c) Ru/Mn-85/ Al2O3 catalysts calcined at 1000ºC for 5 h.
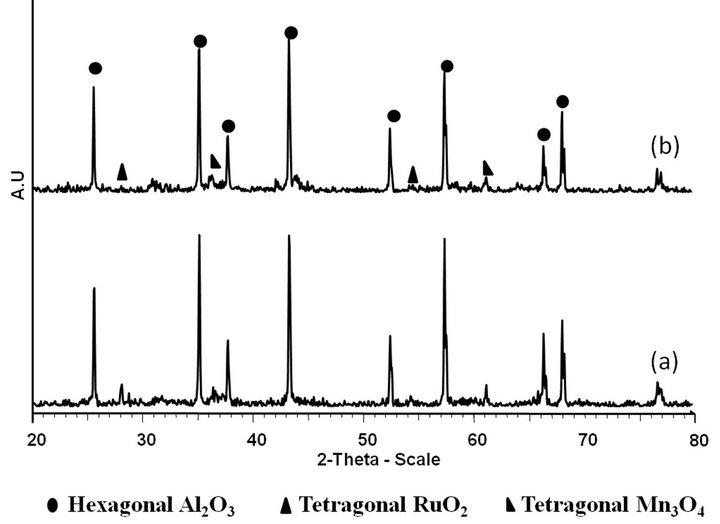
Figure 4. The overlay of XRD diffractograms of (a) fresh and (b) used Ru/Mn-75/Al2O3 catalyst calcined at 1000˚C for 5 h
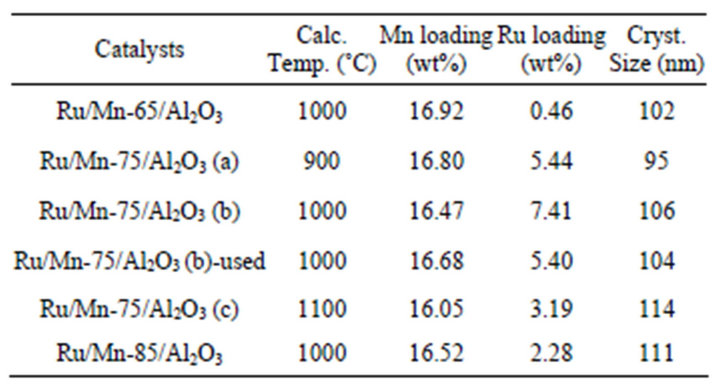
Table 1. Ru/Mn/Al2O3 catalyst prepared by wetness impregnation method.
to the cubic alumina at 2θ around 37˚ and 67˚. At such low temperature, the crystallinity of the sample could not be observed and no peaks can be assigned. This result is in line with the result obtained by Tang et al. [8] who claimed that the support only exhibited broad diffraction peaks when calcined at below 500˚C and no other crystalline peaks was observed at low calcination temperature [9].
By increasing the calcination temperature of the catalyst to 700˚C (Figure 1(b)), the intensity of those alumina peaks was slightly increased and became more profound [1]. This revealed that the intermediate crystallinity was also observed in this catalyst. The dominated Al2O3 cubic phase can be seen at similar position as calcination temperature of 400˚C at 2θ values of 46.041˚ (I100), 67.035˚ (I93) and 37.641˚ (I47) with d*obs values (Ǻ) of 1.970, 1.394 and 2.387 (d*ref values (Ǻ): 1.976, 1.397 and 2.383). Interestingly, new peaks attributable to RuO2 species were observed at calcination temperature of 700˚C. The three peaks of RuO2 tetragonal phase were appeared at 2θ values of 28.124˚ (I100), 35.112 (I72) and 54.386˚ (I54) with d*obs values (Ǻ) of 3.170, 2.553 and 1.685 (d*ref values (Ǻ): 3.177, 2.555 and 1.687). However, RuO2 tetragonal phase at 28.124˚ was more intense due to the sharing of peaks with tetragonal MnO2 which was also observed at 28.680˚ (I100). Another one peak of MnO2was assumed in the enveloped of Al2O3 peaks at 2θ of 37.441˚ (I50) or d spacing values of 2.394 Å (d*ref values (Ǻ): 2.40).
When the calcination temperature was increased to 900˚C, the polycrystalline state of Ru/Mn-75/Al2O3 catalyst was detected. The Al2O3 cubic phase which was observed earlier in catalyst calcined at 400˚C and 700˚C had transformed into Al2O3 rhombohedral phase. The peaks were observed at 2θ values of 35.131˚ (I100), 43.329˚(I96), 57.410˚ (I91), 25.550˚ (I68), 68.089˚ (I52), 52.475˚ (I47), 37.323˚ (I46) and 66.398˚ (I35) with dobs values of 2.552, 2.087, 1.604, 3.484, 1.376, 1.742, 2.407 and 1.407 Ǻ (dref values (Ǻ): 2.552, 2.086, 1.602, 3.482, 1.375, 1.741, 2.381 and 1.405). The peaks assigned to the tetragonal RuO2 remained similar and appeared sharply at 2θ values of 28.076˚ (I100) and 54.965˚ (I54) with d*obs values (Ǻ) of 3.176 and 1.684 (d*ref values (Ǻ): 3.177 and 1.687) as in catalyst calcined at 700˚C. The tetragonal phase ofRuO2is thermostable and it can prevent the phase changing to occur even when calcined at higher temperature as suggested by Richardson et al. [10].
Furthermore, the manganese oxide species was appeared in the form of tetragonal Mn3O4 and detected at 2θ values of 61.872˚ (I60) with d*obs values (Ǻ) of 1.512 (d*ref values (Ǻ): 1.542). However, the pattern shows a very small peak which was hardly distinguished from the background noise. The overlapping of Mn3O4diffraction peaks with those of the support peaks at 2θ of 36.466˚ (I100) with d*obs values (Ǻ) of 2.484 was also occurred. The transition of manganese oxide to another manganese oxide species depends on the certain temperature and atmosphere. Therefore, the Mn3O4 species is the most stable form within this temperature.
Upon calcination at 1000˚C for 5h, well-definedsharp peaks were obtained representing the growth of the particle size for each species as shown in Table 1. The average crystallite size over Ru/Mn-75/Al2O3 catalyst calcined at 1000˚C was about 106 nm which is 10% larger than the one that was calcined at 900˚C. Besides, no overlapping peaks are observed indicating that the calcination temperature of 1000˚C is enough for preparing highly pure crystalline of Ru/Mn-75/Al2O3 catalyst. On increasing the calcinations temperature to 1100˚C, no phase changes were detected. Similar peaks that appeared on Ru/Mn-75/Al2O3 catalyst calcined at 1000˚C can also be observed at Ru/Mn-75/Al2O3 catalyst calcined at 1100˚C. The crystallinity for both catalysts seems to be similar to each other. However, the intensity of tetragonal RuO2 especially at 2θ = 28˚ was slightly increased.
Therefore, it can be summarized that the degree of crystallinity of all the catalysts improved as the calcination temperature was increased from 400˚C to 1100˚C This results suggested that the calcination temperature has an effect in rearranging the crystal lattice to be in ordered periodic arrangement to produce narrower and sharper peaks attributable to the crystalline phase. Jones et al. [11] claimed that catalysts calcined at temperatures above 500˚C showed high crystallinity. However, high crystallinity phase was only observed for catalyst calcined at 1000˚C and 1100˚C, whereby catalyst calcined at 400˚C showed amorphous phase and those calcined at 900˚C showed polycrystalline phase.
The Ru/Mn-75/Al2O3 catalyst calcined at 1000˚C was selected to be further analyzed by using XRD analysis towards its Mn loading since the intensity of RuO2 over this catalyst is lower (Figure 2(b)) compared to other calcination temperature of 900˚C (Figure 2(a)) and 1100˚C (Figure 2(c)). Therefore, the XRD patterns towards various loading of Mn over Ru/Mn-75/Al2O3 catalyst calcined at 1000˚C is illustrated in Figure 3. The loading used in this research are 65 wt%, 75 wt% and 85 wt%. The species obtained from Ru/Mn-75/Al2O3 catalyst was described above. Overall, the effect of Mn loading on the change of phase transformation over XRD analysis is not clearly distinguished. All the species are in stable phase even when Mn loading was increased or decreased by 10 wt% as well as the peaks position which remained unchanged. However, the intensity of the peaks makes some differences between the catalysts prepared. Obviously, the intensity of tetragonal Mn3O4 especially at 2θ of 61.72 (I100) is higher (Figure 3(b)) compared to the catalysts with Mn loading of 85 wt% (Figure 3(c)) and 65 wt% (Figure 3(a)), respectively.
From these results, it can be concluded that there is some increment and reduction of species intensity with Mn loading variation. Therefore, the selection of metal loading is tremendously important in order to produce a catalyst that could enhance the CO2 methanation reaction. The expected active species obtained from XRD analysis (Figures 1-3) are Mn3O4 in the form of tetragonal phase. It was also noted that the Al2O3 phase should be rhombohedral for the catalyst to possess catalytic activity towards CO2 methanation reaction. Therefore, it can be suggested that the potential catalyst from these results is Ru/Mn-75/Al2O3 catalyst calcined at 1000˚C.
The XRD spectra of fresh and used Ru/Mn-75/Al2O3 catalyst calcined at 1000˚C is shown in Figure 4. From comparison, it can be suggestedthat there was a major differences in the diffraction patterns of fresh and used Ru/Mn-75/Al2O3 catalysts calcined at 1000˚C. The two peaks of RuO2 at 2θ of 28.076˚ (I100) and 54.965˚ were disappeared. This may be due to the modification of the species that occurred in the matrix after the catalytic testing, whereby the active species have migrated into the bulk matrix of the catalyst or been adsorbed into the pores of the support due to the high porosity of alumina support. It is in good agreement with our results taken from EDX analysis (Table 1). About 7.41 wt% of Ru was detected on the surface of the fresh catalyst compared to the 5.40 wt% over used Ru/Mn-75/Al2O3(b) catalyst.
The reduction of some alumina peaks especially at 2θ of 57.410˚ over used Ru/Mn-75/Al2O3(b) catalyst can also be observed on the diffractogram. No significant difference can be noticed among the other species. From this XRD analysis results, the deactivation over this catalyst might occurred after catalytic testing (used catalyst) towards CO2 methanation reaction since some species was no longer observed after exposing to high temperature during catalytic testing.
3.2. Catalytic Measurement
All the prepared catalysts were then tested on its catalytic activity using a fixed bed micro reactor coupled with FTIR and GC to determine the potential catalyst in this research. Several parameters were used in preparing the catalysts for the catalytic activity measurement such as different calcination temperatures and loading of Mn.
3.2.1. Effect of Calcination Temperatures
Ru/Mn-75/Al2O3 catalyst was prepared via impregnation method and aged in an oven for 24 hours before calcined the catalyst atfive different temperatures of 400˚C, 700˚C, 900˚C, 1000˚C and 1100˚C. Figure 5 shows the trend of CO2 conversion catalyzed by the manganese oxide based catalyst calcined at different calcination temperaturesand the data of the catalytic activity is shown in Table 2. It can be seen that the CO2 conversion over Ru/Mn-75/ Al2O3 catalyst calcined at 400˚C achieved 13.75% at reaction temperature of 200˚C. The percentage conversion keeps on increasing until it reaches its maximum point at 400˚C, whereby the percentage of CO2 conversion is at the highest which is 90.53%.
Similar pattern of CO2 conversion was also observed for Ru/Mn-75/Al2O3 catalyst calcined at 700˚C. Initially, the conversion of CO2 gave only 15.87% at 200˚C but continuously increased until achieved 91.77% at 400˚C
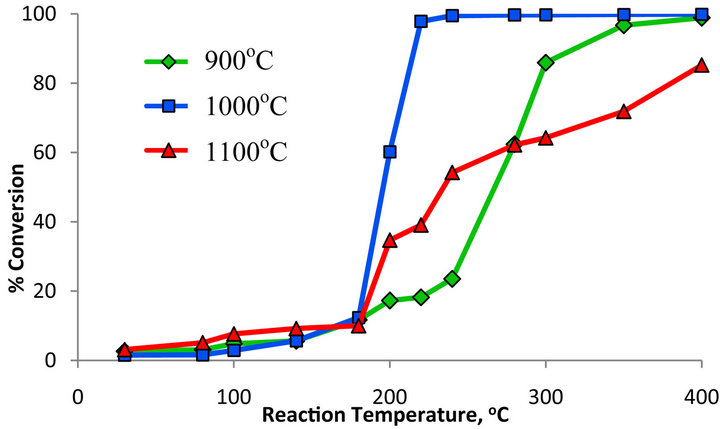
Figure 5. Percentage conversion of CO2 over Ru/Mn-75/ Al2O3 catalyst by using various calcination temperatures.
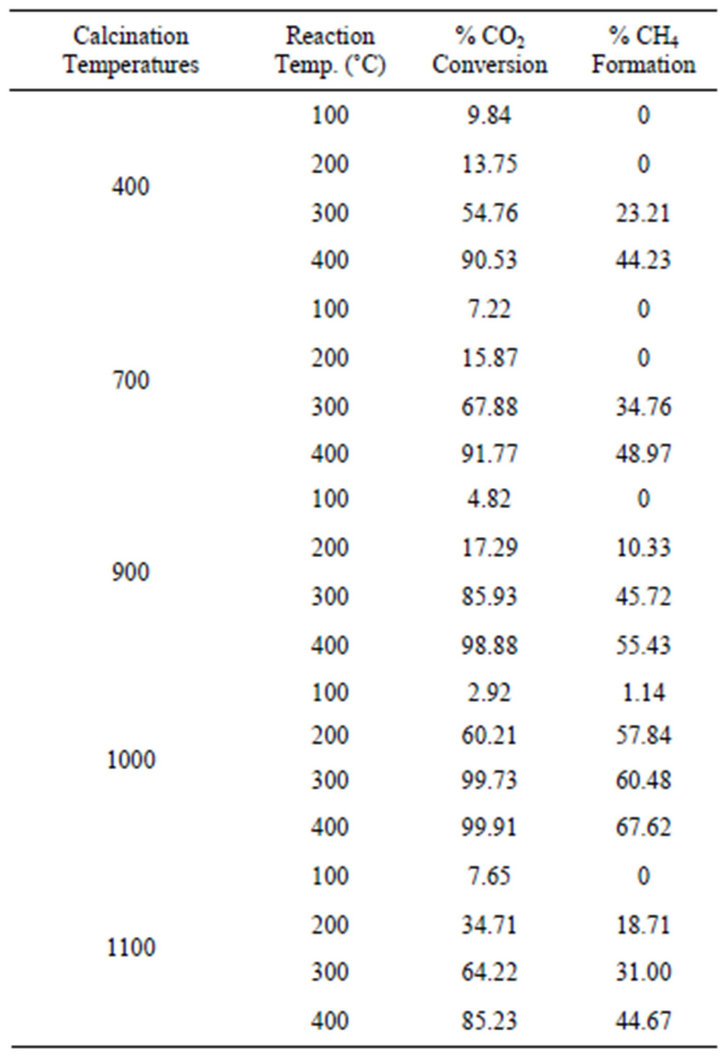
Table 2. Comparison of CO2 conversion from methanation reaction over Ru/Mn-75/Al2O3 catalyst calcined at different temperatures.
reaction temperature. However, there was no methane gas detected over the converted CO2 from both catalysts at reaction temperature below 200˚C. The conversion of CO2 was then slightly increased after calcined the similar catalyst at 900˚C. The maximum conversion achieved was approximately 99% but only 55.43% of methane gas was detected at 400˚C reaction temperature.
This catalyst was then further subjected to higher calcination temperatures of 1000˚C. At reaction temperature of 200˚C, this catalyst already converting 60.21% of CO2 and yielded 57.84% of methane. The maximum conversion up to 100% was observed for this catalyst at maximum reaction temperature of 400˚C with 67.62% of methane was formed. Further increased the calcination temperature to 1100˚C, the methane formation of Ru/ Mn-75/Al2O3 catalyst was dropped to only 44.67% over 85.23% of CO2 conversion at similar reaction temperature.
Therefore, it can be concluded that the percentage of CO2 conversion increases as the calcination temperature increases up to 1000˚C. XRD analysis in Figures 1 and 2 shows that the increasing calcination temperature of the catalyst had transformed the amorphous state of the catalyst to crystalline state. All the peaks become more profound, shaper and intense at their location. No overlapping peak was observed meaning that the pure metal oxide had obtained. It is indicate that there are no remaining impurities on the surface of the catalyst which will prevent the chemisorption of CO2 and H2 hence will increase the CO2 methanation activity.
3.2.2. Effect of Mn Loadings
Table 3 compares the amount of Mn loading towards the percentage CO2 conversion by the Ru/Mn/Al2O3 catalyst. All the catalysts were calcined at 1000˚C. The detailed trend plot of the catalytic activity is as shown in Figure 6. The performance of Ru/Mn-75/Al2O3 catalyst calcined at 1000˚C had been discussed before in Section 3.2.1. At reaction temperature of 200˚C, about 57.84% of methane was formed from 60.21% of CO2 conversion.
By decreasing the Mn content to 65 wt%, the CO2 conversion was decreased to 30.72% with 99% selectivity towards methane at reaction temperature of 200˚C. Over 100% CO2 conversion, only 34.67% of methane was formed from the reaction at maximum temperature. At higher Mn loading of 85 wt%, about 13.63% of CO2 was converted to methane at reaction temperature of 200˚C. Overall, there is no significant difference in CO2 conversion throughout the reaction process except at reaction temperature of 200˚C (Figure 6). Therefore, Ru/ Mn-75/Al2O3 (b) catalyst was selected as potential catalyst in this research since the CO2 conversion of Ru/Mn- 65/Al2O3 and Ru/Mn-85/Al2O3 catalysts did not exceed the conversion of Ru/Mn-75/Al2O3 catalyst at reaction
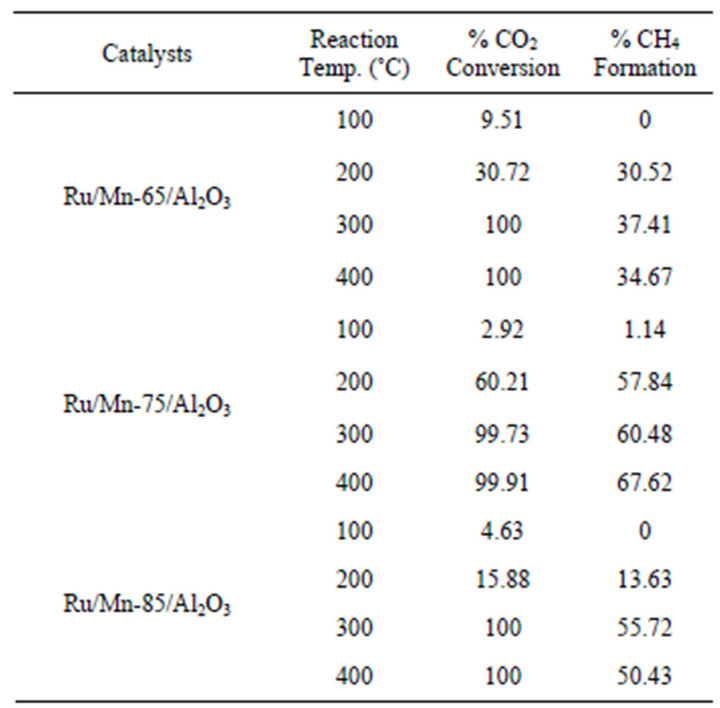
Table 3. Comparison of CO2 conversion from methanation reaction over Ru/Mn/Al2O3 catalyst prepared by wetness impregnation method over various Mn loading and calcined at 1000˚C for 5 h.
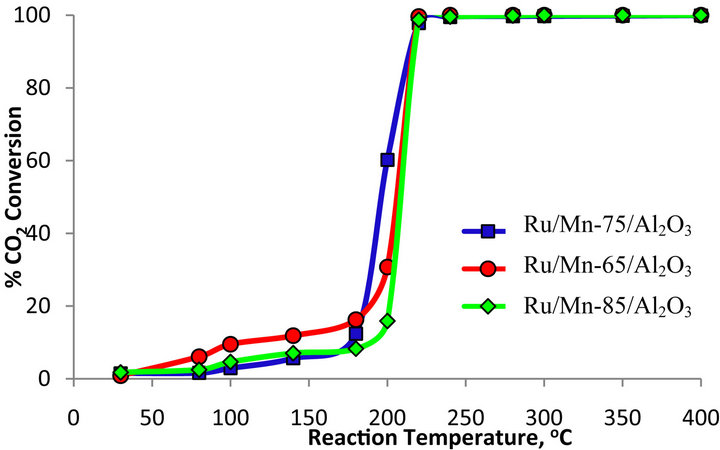
Figure 6. Percentage conversion of CO2 over Ru/Mn/Al2O3 catalyst calcined at 1000˚C for 5 hours with various compositions.
temperature 200˚C.
It has been shown by XRD analysis thatthe catalyst with various Mn loading had similar pattern of diffractogram with similar phases and peaks position. However, the changes in intensity of Mn3O4 (Figure 3(b)) was observed over Mn based catalyst with various loading whereby the intensity of Mn3O4 species over Ru/Mn- 75/Al2O3 catalyst is slightly higher compared to other catalyst. Therefore, it can be suggested that Mn3O4 is one of the active species which plays an important role to assist the methanation reaction on the catalyst surface.
4. Conclusion
XRD analysis can provide the information regarding phase changes and structure transformation, particle sizes as well as active species of the catalyst. From the results obtained, the Ru/Mn-70/Al2O3 calcined at 1000˚C can be categorized as the potential catalyst among all the prepared catalysts. It can give 86.82% CO2 conversion with 61.94% of methane formation. The structural study showed that the Mn3O4 compound in tetragonal structure was the active species which enhance the catalytic activity.
5. Acknowledgements
The authors are gratefully acknowledged to the Ministry of Science, Technology and Innovation, Malaysia for E-Science Fund Vote 4S002, Ministry of Higher Education, Malaysia for GUP Fund vote 01H57 and Universiti Teknologi Malaysia for financial support.
REFERENCES
- W. A. W. Abu Bakar and R. S. Toemen, “Catalytic Methanation Reaction over Supported Nickel-Ruthenium Oxide Base for Purification of Simulated Natural Gas,” Scientia Iranica, Vol. 19, No. 3, 2012, pp. 525-534. doi:10.1016/j.scient.2012.02.004
- W. A. W. A. Bakar, R. Ali and S. Toemen, “Catalytic Methanation Reaction over Supported Nickel-Rhodium Oxide for Purification of Simulated Natural Gas,” Journal of Natural Gas Chemistry, Vol. 20, No. 6, 2011, pp. 585-594. doi:10.1016/S1003-9953(10)60236-8
- W. A. Wan Abu Bakar, M. Y. Othman, R. Ali, C. K. Yong and S. Toemen, “The Investigation of Active Sites on Nickel Oxide Based Catalysts towards the in-Situ Reactions of Methanation and Desulfurization,” Modern Applied Science, Vol. 3, No. 2, 2009, pp. 36-44.
- M. B. Kizling and F. Regali, “Preparation of Zirconium Oxide Particles for Catalyst Supports by the Microemulsion Technique. Characterization by X-Ray Diffraction, BET, SEM-EDX, FT-IR and Catalytic Tests,” Studies in Surface Science and Catalysis, Vol. 118, 1998, pp. 495- 504. doi:10.1016/S0167-2991(98)80216-4
- D. A. Skoog, E. J. Holler and S. R. Crouch, “Principles of Instrumental Analysis,” Thomson Brooks/Cole Corporation, Belmont, 2007.
- M. D. Nasr-Allah, “Physicochemical, Surface, and Catalytic Properties of Pure and Ceria-Doped Manganese/ Alumina Catalysts,” Chinese Journal of Catalysis, Vol. 29, No. 8, 2008, pp. 687-695. doi:10.1016/S1872-2067(08)60066-2
- G. Perego, “Characterization of Heterogeneous Catalysts by X-Ray Diffraction Techniques,” Catalysis Today, Vol. 41, No. 1-3, 1998, pp. 251-259. doi:10.1016/S0920-5861(98)00054-6
- Q. Tang, X. Huang, C. Wu, P. Zhao, Y. Chen and Y. Yang, “Structure and Catalytic Properties of K-Doped Manganese Oxide Supported on Alumina,” Journal of Molecular Catalysis A: Chemical, Vol. 306, No. 1-2, 2009, pp. 48-53. doi:10.1016/j.molcata.2009.02.020
- Q. Tang, X. Gong, C. Wu, Y. Chen, A. Borgna and Y. Yang, “Insights into the Nature of Alumina-Supported MnOOH and Its Catalytic Performance in the Aerobic Oxidation of Benzyl Alcohol,” Catalysis Communications, Vol. 10, No. 7, 2009, pp. 1122-1126. doi:10.1016/j.catcom.2009.01.011
- J. T. Richardson, M. Garrait and J.-K. Hung, “Carbon Dioxide Reforming with Rh and Pt-Re Catalysts Dispersed on Ceramic Foam Supports,” Applied Catalysis A: General, Vol. 255, No. 1, 2003, pp. 69-82. doi:10.1016/S0926-860X(03)00645-8
- C. Jones, K. J. Cole, S. H. Taylor, M. J. Crudace and G. J. Hutchings, “Copper Manganese Oxide Catalysts for Ambient Temperature Carbon Monoxide Oxidation: Effect of Calcination on Activity,” Journal of Molecular Catalysis A: Chemical, Vol. 305, No. 1-2, 2009, pp. 121-124. doi:10.1016/j.molcata.2008.10.027
NOTES
*Corresponding author.