Theoretical Economics Letters
Vol. 3 No. 3 (2013) , Article ID: 32948 , 11 pages DOI:10.4236/tel.2013.33029
A Framework for Determining the Period When a Perennial Crop Is No Longer Profitable after a Disease Outbreak
1Colombian Oil Palm Research Center, Cenipalma, Bogotá DC, Colombia
2Food & Resource Economics Department, Institute of Food & Agricultural Sciences, University of Florida, Gainesville, USA
3Tropical Research & Education Center, Institute of Food & Agricultural Sciences, University of Florida, Homestead, USA
Email: mmosquera@cenipalma.org
Copyright © 2013 Mauricio Mosquera et al. This is an open access article distributed under the Creative Commons Attribution License, which permits unrestricted use, distribution, and reproduction in any medium, provided the original work is properly cited.
Received April 10, 2013; revised May 10, 2013; accepted June 10, 2013
Keywords: Perennial Crops; Plant Disease; Disease Management; Oil Palm; Economic Optimization Model; Optimal Control Model; Replanting
ABSTRACT
A theoretical approach is developed for finding the optimal age to remove an orchard (or plantation) to maximize net present value, after a disease attack. The model is a bioeconomic model that considers the effects of disease management on disease spread and the effect of the disease on yields. This provides an optimal disease management strategy and optimal rotation period. Our work makes an important contribution to the literature. To the best of our knowledge, no previous work has considered the simultaneous question of optimal disease management and replanting age when disease is present in perennial crops. An empirical application is presented for the case of pudricióndelcogollo, a lethal and contagious disease that threatens oil palm plantations in Colombia. The model could be applied to a wide range of perennial crop diseases.
1. Introduction
Plant diseases have the potential to destroy agricultural industries in a short time and to cause considerable environmental damages, thus turning what might have been a profitable operation into an unprofitable one (Evans, 2003 [1]).
Commonly when an outbreak takes place it is the growers who are left to bear the brunt of costs associated with disease control, and they must employ one or various efficient and cost effective tactics, which explains why this work focuses on the farmer’s perspective. When one considers diseases from an orchard perspective, it is clear that they affect the operation’s profitability by reducing the potential yield per unit area and by increasing production costs.
Disease management strategies in perennial crops may include avoidance, exclusion, eradication, protection and treatment of diseased plants, which are not mutually exclusive strategies (Ploetz, 2007 [2]). Avoidance limits the chances of introducing the pathogen or refrains from providing the conditions that are needed for its development. Exclusion keeps pathogens out of fields by scouting, early detection, avoiding contaminated germplasm, and disinfesting machinery and tools. Eradication removes and destroys infested plants/tissues from fields. Finally, protection of the host from pathogens includes a wide range of biological, chemical and host-resistance strategies (Ploetz, 2007 [2]). However, deciding on a particular course of action can be extremely challenging, especially in situations where the crop in question is a perennial.
Among the factors that add a great deal of complexity when making decisions regarding a specific control strategy in perennial crops, we mention:
• Perennial crops involve a long-term investment that requires a substantial amount of initial capital outlay;
• Perennial crops usually require a number of years before trees reach level of maturity;
• Perennials require long-term disease control measures, have an increased risk of development of pesticide resistance, and may be exposed to disease predisposing factors over multiple years (Ploetz, 2007 [2]).
Complicating matters further is the fact that diseased trees may still bear fruit albeit at lower yields and reduced quality. The former sets a dilemma for growers, since they may prefer to attain some short term revenue at the cost of allowing the source of infection to remain in the fields (Spreen, Zansler and Muraro, 2003 [3]).
The goal of this work is two-fold. The first goal is to develop a theoretical framework that provides growers with guidance as to when a grove is no longer profitable in the presence of a lethal and contagious disease, given that disease infestation affects crop yield and production costs. The second goal is to demonstrate how the framework developed could be used in empirical applications.
This work is organized as follows. After this introduction, it is presented our theoretical approach to disease management in perennials. Our model relies on finding the optimal period to either replant a disease-free orchard or discontinue production after a lethal and contagious disease attacks an orchard. Afterwards we present an empirical application.
2. Proposed Theoretical Approach
Our model seeks to maximize net present value (NPV) by determining the optimal time period to replant disease-free orchards or remove plantings in which a lethal and contagious disease is present. In the first case, it is assumes that replanting will occur with the same crop and same production features, whereas in the second, growers are allowed to change to another economic activity, which may be done with a scrap value function.
The disease-free model represents the benchmark or grower’s planned scenario and includes the optimal replanting period in the absence of disease. In the disease scenario, a disease control strategy must be in place. The range of disease control strategies includes the “do nothing” option. Since disease affects yield and may increase costs, it is very likely that NPV will be affected and so does the time period at which the perennial crop is no longer profitable.
Since the disease-free and disease models have the same yield functions, time periods and area units, results from each are comparable. Theoretical features of the models are presented below.
2.1. Model without Disease
Typically, perennial crops require an establishment phase during which yield increases until it enters the production phase during which yield will remain at or near maximum levels. Although some perennials can be productive for many years, replanting of orchards is considered after their economic lives have passed. Thus, perennial yield functions are often well represented by concave functions of yearly production over time.
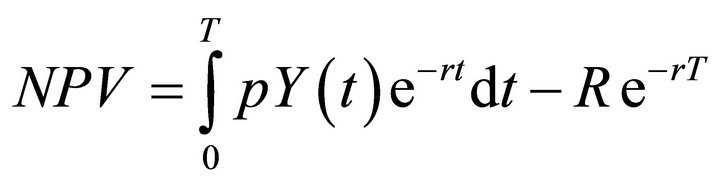
The approach of Faustmann (Mitra and Wan, 1986 [4]) in a forestry type model is used to address the rotation problem. The present model differs from it in that aggregate income from periodic sales of fruits is considered as opposed to selling all output (wood in the forestry models) in the final period (Clark, 2005 [5]). For one rotation, the NPV for one rotation is given by:
 (1)
(1)
where ![]() is net price defined as the unit price less unit cost of production (for simplicity, it is fixed),
is net price defined as the unit price less unit cost of production (for simplicity, it is fixed),  is the production per land unit at period
  (
( may be interpreted as tree age),
 ![]() represents the time at which the perennial crop needs to be replanted,
represents the time at which the perennial crop needs to be replanted,  is the discount rate and
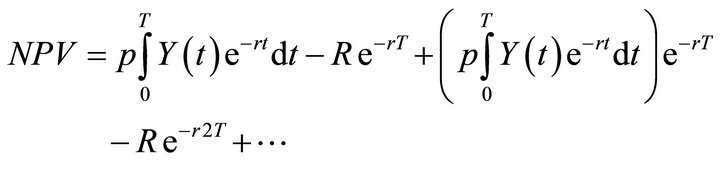
  represents replanting costs. Since one of the concerns is to determine the optimal age of replanting, specification future income from future projects (rotations) is included in the model. This is accommodated here by using perpetual rotations:
 (2)
(2)
Using geometric series we can express the problem as
 (3)
(3)
The First Order Condition (FOC) corresponding to (3) is:
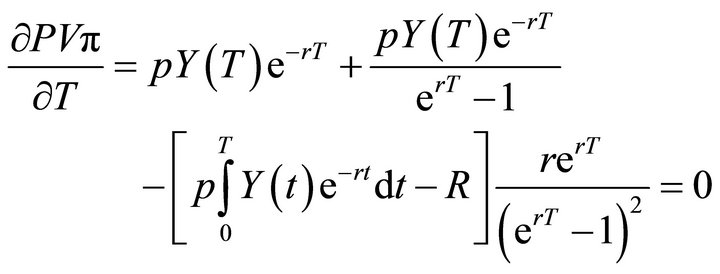 (4)
(4)
Taking the common denominator of the first two terms it was obtained:
 (5)
(5)
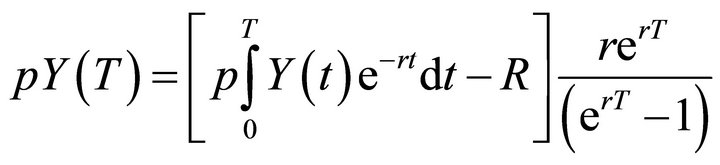
The left hand side (LHS) of Equation (5) illustrates the marginal benefit of waiting an extra period in order to replant, while the right hand side represents the marginal cost of doing so. An alternative interpretation comes from rearranging Equation (4) to yield:
 (6)
(6)
The LHS of (6) represents the marginal benefit of waiting one more period to replant, which is the benefit from selling the harvested fruit in that period instead of removing the trees. The RHS of (6) represents the marginal cost of waiting an additional year to replant. The first term in the RHS represents the interest on the whole stream of profits (which would be delayed for an extra year); and the second term in the RHS represents the “site rent”, or the value at which the bare ground could be sold under perfect land market conditions. At the optimal replanting time, the grower is indifferent between replanting and waiting one more period.
2.2. Model with Disease
As mentioned earlier, decreasing yields due to disease and increasing costs resulting from adoption of control strategies impact NPV. Thus, the optimal period to remove the current standing differs from the optimal replanting period from a non-disease situation, and determining the optimal time at which this should be done is a key objective of the Model with disease.
When an orchard is affected by a lethal, contagious disease, the grower must decide when to remove the entire orchard or treat trees. Our model assumes that a treatment exists that impedes or stops disease progress, and allow diseased trees to fully recover. Since treatment has associated costs, the grower must find an optimal level of control strategy  (control variable) to keep the number of diseased trees
  (state variable) at an “acceptable level”, such that NPV is maximized from one rotation to another. Net profit will be affected, which in turn changes the optimal time for removing the entire orchard.
The model with disease considers a scrap value , unlike the model without disease where perpetual rotations are considered. Under the scenario with disease, some growers may stop producing the affected crop at the end of the current rotation while others may replant with newly developed breeds (if available) or the current breed if the control strategy is cost effective. The scrap value, determined by land market values, measures the value of the land considering its highest valued use which may or may not include additional rotations (Deininger and Nagarajan, 2008 [6]). The grower’s optimization problem becomes:
 (7)
(7)
Subject to:
 (8)
(8)
 (9)
(9)
 (10)
(10)
 (11)
(11)
where ![]() is net price defined as above,
is net price defined as above,  is the production per unit of area of a perennial crop at age
  with disease incidence
 , and age at first disease detection is
 . This model differs from the disease free model where the age of the trees at its start is 0. Age and time are measured in the same time units.
  represents control costs as a function of treated diseased trees,
  is the monthly discount rate, and
  represents the scrap value function. Note that the scrap value function is associated with values at time
 ![]() which correspond to the orchard removal period (Leonard and van Long, 1992 [7]).
which correspond to the orchard removal period (Leonard and van Long, 1992 [7]).
Equation (8) describes disease incidence dynamics  and f is a function relating disease control
  to
to ; it demonstrates how the control strategy (control variable) influences the number of disease cases (state variable). A restriction on the number of treated trees is represented by Equation (9), and it indicates that the number of treated trees ranks from 0 to the total number of diseased trees present in period t. Finally, transversality conditions (TC) are given by Equations (10) and (11) are which indicate that the grower chooses the optimal orchard removal period T and disease incidence at that point in time
 , rather than setting predetermined values.
3. Empirical Application to PC Control on Colombian Oil Palm Plantations
In Colombia, oil palm cultivation has increased at a yearly growth rate of 7.2% during the past three decades. In 2011, the total area in Colombia planted with oil palm reached 850,000 acres (Fedepalma, 2008 [8]). More than 90% of that area has replaced activities such as the production of cotton, banana and rice or cattle ranching (Gómez, Mosquera and Castilla, 2005 [9]). Continued increases in oil palm production are expected, due to increased global demands for fats and oils, as well as biofuels (Carter et al., 2007 [10]).
Oil palms cropping is a labor intensive industry, represents a source of stable, year-round income for rural communities, and provides a higher average income for workers relative to other economic activities in the same areas (Mosquera and Garcia, 2005 [11]). Where oil palm is the most important activity, welfare indexes tend to be among the highest for rural Colombian municipalities (Oliveira et al., 2011 [12]). In synthesis, oil palm lends itself to sustainable rural development in Colombia.
However, the Colombian oil palm industry is challenged by the presence of a lethal and contagious plant disease named after pudrición del cogollo (PC) (Martinez et al., 2009 [13]). In the municipality of Tumaco and surrounding areas, more than 70,000 acres of oil palm were destroyed by PC. This destruction caused losses in the vicinity of $2300 per acre, which is a significant fraction of the expected $14,500 per acre of average net profits a producer would expect over the 25 year lifespan of an oil palm project (Mosquera, 2007 [14]).
3.1. Pudrición del Cogollo (PC)
PC is a disease caused by Phytophthora palmivora Butler (Martinez et al., 2009 [13]). PC affects immature tissues of the emerging leaves of oil palms and interferes with their production and maturation. As the disease develops the tree’s meristem decomposes, eventually causing the plant to die (Martinez et al., 2009 [13]).
Eventually, the most efficient way of controlling PC may be the use of varieties that are resistant to the disease, which are presently under development. In their absence, regular scouting for and recording of PC incidence and severity is necessary (Martinez et al., 2009 [13]). When a diseased palm is detected, its infected tissues are removed and the wound is covered with pesticides (insecticide, fungicide, and bactericide). A white plastic roof is placed above the wound to protect it from sunlight and rain (which washes away the chemicals). Additionally, the young tissues of immediately surrounding palms are sprayed with pesticide until the diseased palm recovers (after four to five months) (Torres, Sarria and Martinez, 2010 [15]). Although this strategy has proven to be successful, its effectiveness depends on early detection. Our model with PC assumes that growers are constantly scouting for the disease, and when a PC case is found it is treated immediately and damage is at a treatable stage. The spatial scale of our models is a hectare, the time scale is one month, and monetary values are given in Colombian pesos.
3.2. Empirical Model without PC
The optimal rotation length for a field that has not been affected by PC is the grower’s planned scenario1. Yield is estimated as a function of time and obtained by a quadratic equation (Table A1):
 (12)
(12)
For one rotation the NPV would be given by:
 (13)
(13)
where ![]() is net price,
is net price,  is the production of oil palm fruit per hectare at period
 , measured in months,
 ![]() is the replanting period,
is the replanting period,  is the discount rate and
  represents the replanting costs. Parameter values are summarized in Table 1. Following the calculations presented above, the problem for perpetual oil palm rotations can be expressed as:
 (14)
(14)
The FOC corresponding to Equation (14) is
 (15)
(15)
The former expression could be rearranged to obtain:
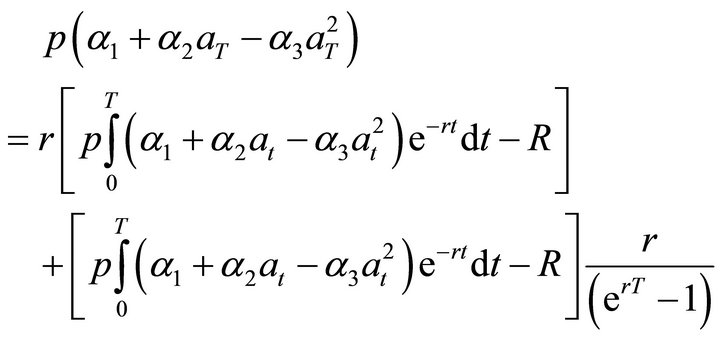 (16)
(16)
3.3. Empirical Model with PC
The grower’s optimization problem is:
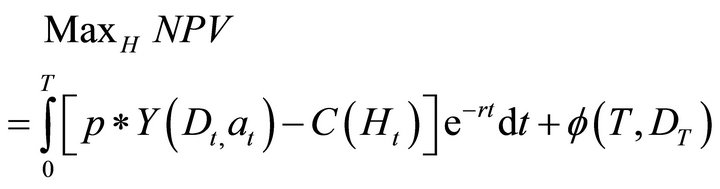 (17)
(17)
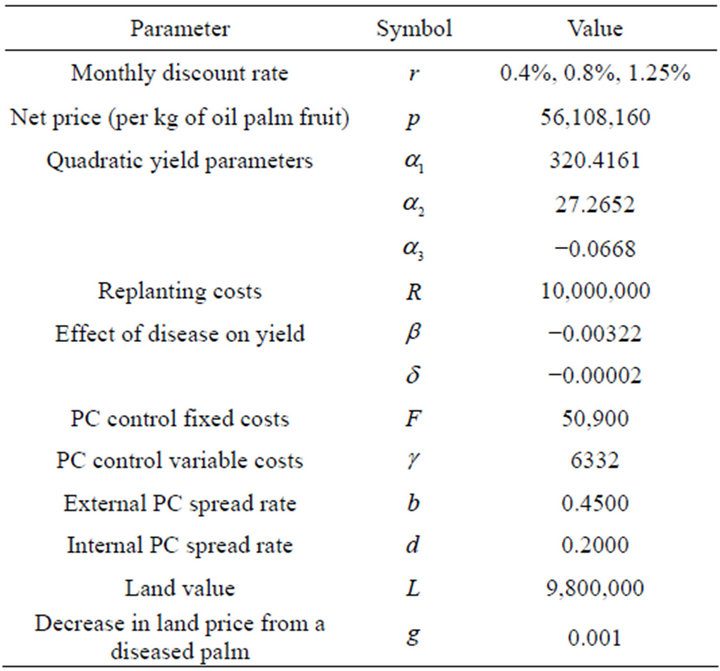
Table 1. Parameters used for estimation (PC models).
Subject to:
 (18)
(18)
 (19)
(19)
 (20)
(20)
 (21)
(21)
 , is the number of diseased trees in a hectare (143 trees/hectare),
  , is the number of diseased trees to be treated, and
 ![]() is the optimal rotation time to maximize net present value (NPV). It is assumed that the treatment proposed by Cenipalma is used opportunely (early detection) and it is fully effective in the sense that diseased oil palms, that got treated, recover.
is the optimal rotation time to maximize net present value (NPV). It is assumed that the treatment proposed by Cenipalma is used opportunely (early detection) and it is fully effective in the sense that diseased oil palms, that got treated, recover.
Additionally, ![]() is net price,
is net price,  is the production per hectare of an oil palm field at age
  with disease incidence
 ,
,  is the control costs function,
  represents the scrap value function, tree age at first disease detection is
  and
and  is the discount rate.
3.4. Empirical Functional Forms Model with PC
Functions in the optimization problem are given by Equations (29) through (33) (Table 1). In Equation (17), assuming no PC disease, yield is a quadratic function of tree age. The proportion of yield that is lost due to the disease, also known as a damage function, is quadratic and based on disease incidence (Table A2):
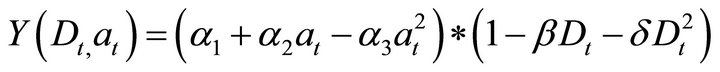 (22)
(22)
Estimation of PC control costs yielded a fixed cost, F, as well as a per unit cost,  (Table A3):
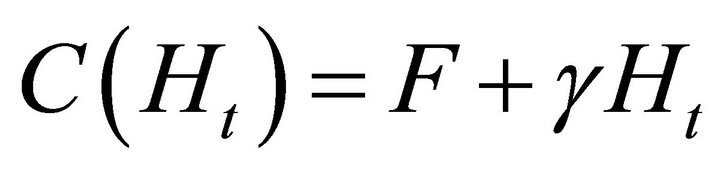 (23)
(23)
Finally, the scrap value is defined as:
 (24)
(24)
where L corresponds to the average land value in Colombia estimated at 9.8 million Colombian pesos per hectare (Duarte y Gutterman, 2008 [16]). Land value is reduced by disease incidence in the final period, which in turn depends on ![]() (per unit impact on land value due to removal of diseased palms). The effect of disease incidence in the final period on land price is small (empirical data indicates
(per unit impact on land value due to removal of diseased palms). The effect of disease incidence in the final period on land price is small (empirical data indicates ), in part due to imperfections in the Colombian land market (Valderrama y Mondragón, 1998 [17]). An entirely diseased field would sell for about 85% of its non-diseased value, where the missing 15% corresponds to costs the buyer may incur when removing dead/diseased palms.
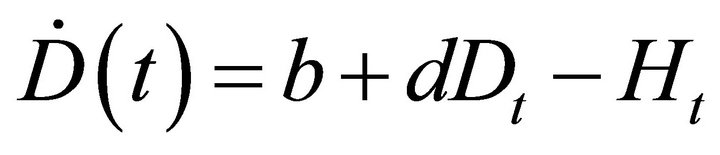
In Equation (18), the equation of motion , inoculum pressure from the environment and diseased oil palms are represented by
  and
and![]() . The control strategy is represented by
. The control strategy is represented by  (treated trees). The transversality conditions are represented by Equations (20) and (21).
3.5. Theoretical Solution to the Model with PC
To solve the optimization problem expressed in Equations (17) to (21), we used an optimal control problem strategy with a control variable,  , and a state variable,
 . Special attention must be devoted to the control variable
  because it enters the problem linearly. This implies a bang-bang optimal control problem (Chiang, 2000 [18])2. The Hamiltonian is given by:
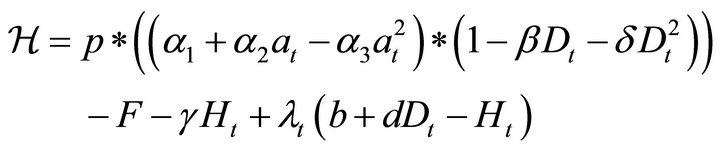 (25)
(25)
which yields the following first order conditions:
 (26)
(26)
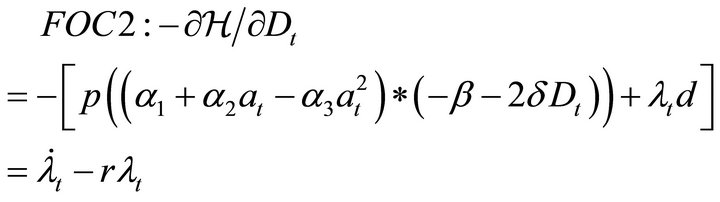 (27)
(27)
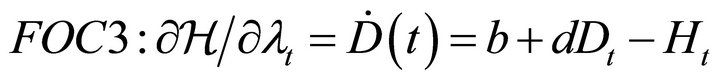 (28)
(28)
From  (Equation (26)) and
  (Equation (27)), the singular path of disease incidence, this is, the number of diseased palms per hectare of oil palm that guarantees a stable condition that does not change over time, is solved:
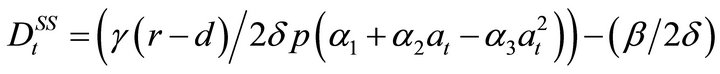 (29)
(29)
The transversality conditions are used to determine the optimal  (Leonard and van Long, 1992 [7]).
  free implies that:
 (30)
(30)
However, as shown in Equation (26), the value of  ex ante is not known. To determine
 , backwards induction is used. In the final period, the derivative of the scrap value function with respect to PC incidence at T represents the marginal value of control, which is more than the marginal cost of control. Consequently, in the final period all disease will be removed yielding
 . Note at T,
  and it must remain on the singular path for the entire rotation (Equation (29)). This is, any PC case in the field must be detected opportunely and treated immediately. T free implies that:
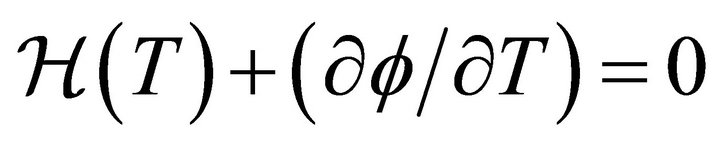 (31)
(31)
 (32)
(32)
Knowing that  implies that
 . Substitution into Equation (32) yields:
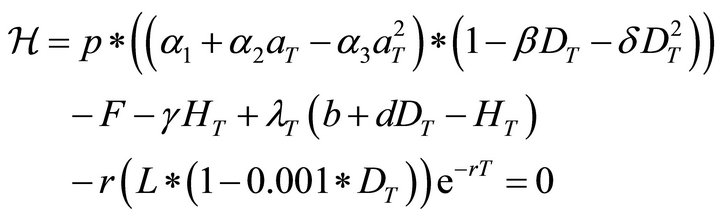
 (33)
(33)
From Equation (33) an optimal solution for T is obtained, knowing that .
.
Equation (33) displays the marginal benefit (LHS), or the additional income from waiting an extra period, which equals the marginal cost of waiting an additional period (right hand side). Terms in the right hand side of Equation (33) correspond, respectively, to: 1) monthly fixed cost for PC control; 2) control costs per treated palm times palms infected due to environmental pressure; and 3) interest from land value that is not received due to postponed removal of trees.
4. Data
Production costs from Cenipalma’s Research Station, Campo Experimental el Palmar de La Vizcaina (CEPLV), are used to calculate net prices and the per kilogram production costs for fresh fruit bunches (FFB) of oil palm. Monthly information for January 2000 to December 2010, obtained from the Colombian Federation of Oil Palm Growers (Fedepalma), was used to estimate market prices net of production costs for a kilogram of oil palm fruit (Fedepalma, 2008 [8]; Fedepalma, 2012 [19]). Due to price fluctuations, three different price levels are set (mean price, mean price plus and minus one standard deviation) (Table 1).
A 30-year monthly yield trend for Colombia was calculated based on information from the Fedepalma yearly costs survey (Duarte y Gutterman, 2008 [16]). A concave yield function was observed, wherein the oil palm goes through a developmental stage, yield is maximized after maturity, and declines in older palms (Table 1 and Appendix). Old palms bear fewer bunches, are difficult to harvest, loose fruit when bunches are harvested from a great height and shatter, and produce bunches for which determination of ripeness is difficult and the proportion of fruit weight to bunch weight decreases. The yield function (Table A1) describes potential yield in the absence of disease (Lichtenberg and Zilberman, 1986 [20]).
For the disease model, data for the effect of PC on yield was available for 2007 from more than 730 plots (about 15,000 acres) in the Tumaco area (Southwestern Colombia) (Table A2). The control strategy proposed by Cenipalma was tested under actual PC pressure, and displayed good efficacy. Records on every activity, input required and PC management costs were kept by Cenipalma’s researchers. Labor requirements were studied at CEPLV with time and motion studies that provided labor costs associated with PC control. From this information the cost per hectare and per treated palm were modeled. Monitoring is set as a fixed cost once PC is present. The cost of removing diseased tissues and the cost of treating surrounding palms with preventative pesticides were calculated on a per diseased palm basis. It was obtained a linear function of costs relating the number of diseased palms to actual control expenses; its intercept represents PC control fixed costs (Table A3).
Data and grower experience indicate that P. palmivora spreads from two sources. First there are “environmental” or exogenous sources. Even when all diseased tissue is removed, new cases still appear. Data from CEPLV were used to estimate exogenous pressure. The second source consists of diseased palms, which if left untreated are pathogen reservoirs. This value was estimated from data from a PC outbreak near Tumaco, from 2005 to 2007 (Table A4)3. Data from CEPLV indicate that spread of PC can be controlled with the Cenipalma PC strategy.
Land value was estimated from cost surveys (Duarte and Gutterman, 2008 [16]). The share of the total costs (per ton of oil palm fruit) corresponding to land was multiplied by the expected production per hectare (kilograms of oil palm fruit) for the oil palm standing rotation length, resulting in a calculated value of 9.8 million pesos per hectare.
When considering the discount rate for the model the safest interest rate for investments in Colombia was considered which corresponds to deposits at a fixed term plus inflation totaling 10%. Although 10% corresponds to the most likely scenario regarding the discount rate (equivalent to 0.8% monthly), 5% and 15% were also considered.
5. Results and Discussion
5.1. Period at Which an Oil Palm Plantation without PC Is No Longer Profitable
Three different net price levels ($56, $108, and $160) with three discount rate scenarios (0.4%, 0.8% and 1.25% per month) were considered. The optimal replanting period for Colombian oil palm cultivars that are highly productive, and are not affected by PC, ranges between 25.5 - 36.6 years, depending on price level and discount rate.
Optimal replanting period is negatively related to the net price per kilogram of oil palm fruit (Table 2). If the price of oil palm fruit were at the low of $56, oil palm plantings should last between 372 (if a 0.4% monthly discount rate is assumed) and 439 months (1.25% monthly discount rate). From Equation (15) it is apparent that net price enters both sides of the equation. A higher net price, ceteris paribus, has a positive effect on the marginal benefit of waiting (LHS of the equation), which lengthens the rotation period. Additionally, a higher net price increases the value of the marginal cost of waiting (RHS) because it increases the NPV. The latter tends to shorten the rotation length. With the above parameters, the effect of increasing the marginal cost dominates the effect of the increase in the marginal benefit, which implies that there is an incentive for the grower to replant earlier.
Note that a higher discount rate corresponds to a greater rotation length. Consider a grower who faces a net price corresponding to the mean price per kilogram of oil palm fruit during the past two decades. In that case, the results indicate that the rotation length should vary according to the discount rate from 350 (r = 0.4% per month) to 402 (r = 1.25% per month) months (Table 2).
The discount rate enters into Equation (16) on the right-hand side, the side of the marginal cost of waiting a month to replant, in multiple places. First, it enters in the interest on the whole stream of profits that gets delayed by one year and in the interest on the site rent. The effect of increasing the interest rate and holding the value of the site rent and stream of profits constant would be an increase in the marginal cost of waiting and hence a shortened rotation length. However, the interest rate also enters into the stream of profits and site rent. An increase in the discount rate decreases the NPV of the stream of profit because later periods in the rotation, which have higher yields than earlier periods, are more heavily discounted. This effect is a decrease in the marginal cost of waiting. With the empirical model for PC, the latter effect dominates, and an increase in the interest rate lengthens the rotation period. In short, with a high interest rate, keeping current trees in the ground is optimal for a longer period of time, because rotating brings low
Table 2. Optimal replanting period (PC free).
yields in early periods and higher yields occur in later periods, which are heavily discounted.
5.2. Model with PC: PC Disease Steady State
Given the estimated parameter values in our empirical model (Table 1), the denominator of the first term of the right hand side (RHS) of Equation (29) is positive, so the first term’s sign will depend exclusively on its numerator. So, the first result concerning the disease scenario indicates  is negative at all times (Figure 1). Since the number of trees infected PC cannot be negative, we conclude that
 . This means that it is optimal for growers to keep PC cases at zero throughout the life of the grove, so once detected a diseased tissue should be immediately eradicated from the orchard. In turn, this implies that the steady state value for PC cases (disease incidence) is zero and the steady state level of control equals b, the outside disease pressure. This confirms the need to follow Cenipalma’s instructions on thorough scouting and immediate treatment of diseased tissue.
5.3. Period at Which an Oil Palm Plantation with PC Is No Longer Profitable
In addition to considering the optimal control in each period, it was found the optimal , at which time the grower may remove all trees in the oil palm plot in order to replant with the current variety, replant with a tolerant variety, replant with a different crop, or sell the land. Table 3 displays the period at which oil palm plots are no longer profitable (for different values of net price, discount rate and age of initial PC detection). In other words, this is the optimal oil palm standing lifespan which maximizes NPV. Note these results hold for plots that are under PC pressure but are managed according to the described control strategy. Figure 2 contains results for a given net price of $108 per kilogram of oil palm fruit, and considers the three values for discount rate referred to in Table 1. Figure 3 displays results for the case in which discount rate is equal to 0.8% per month and consider the three values for net price presented in Table 1.
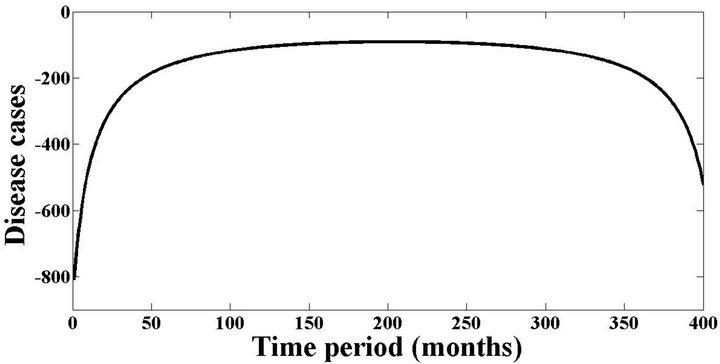
Figure 1. Solution for DSS according to yield (which in turn is a function of age).
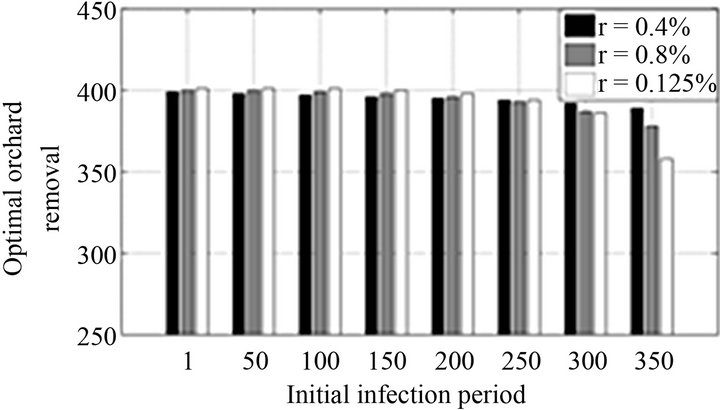
Figure 2. Optimal orchard removal period according to discount rate, holding constant the net price at $108 per kilogram of oil palm fruit.

Figure 3. Optimal orchard removal period according to net price, holding constant the discount rate at 0.8% per month.
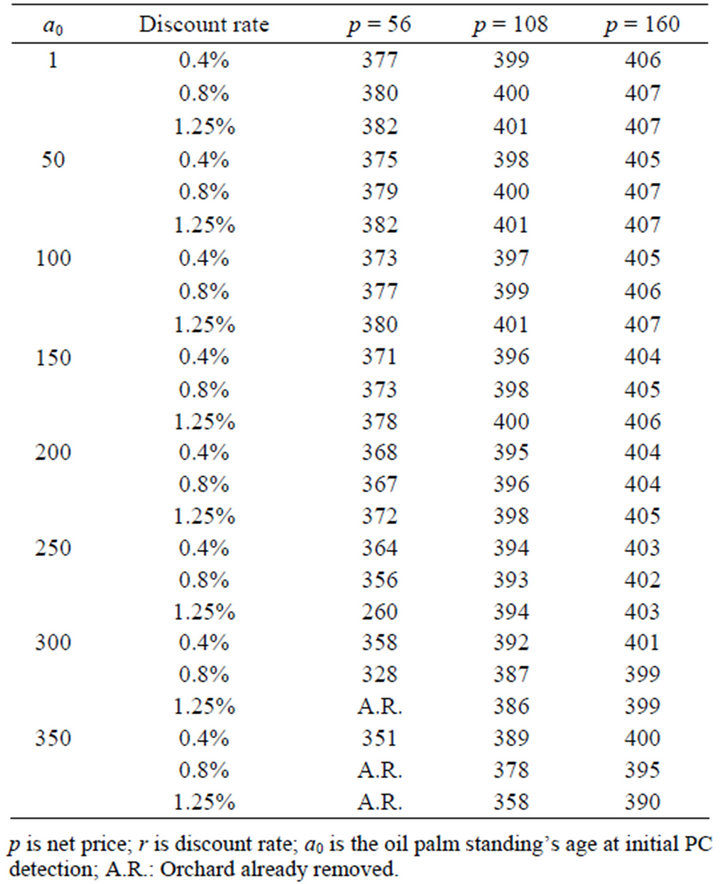
Table 3. Oil palm standings lifespan (a0 + T) for selected values of a0, according to different combinations of net price and discount rate.
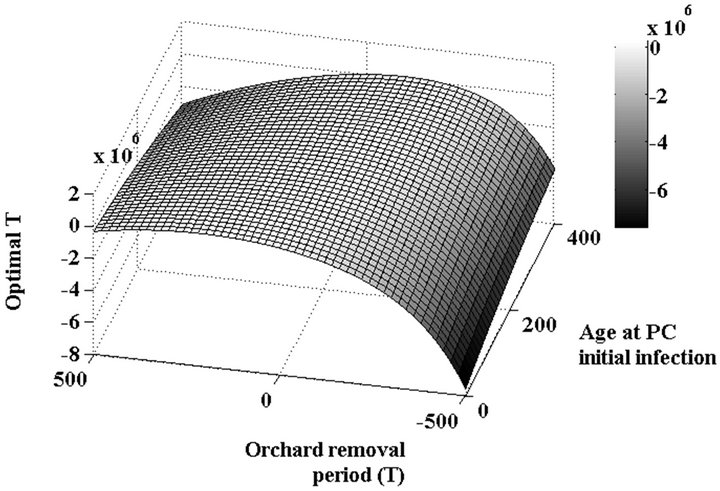
Our results indicate that there is a negative relationship between the optimal age for plantation removal  and the age of the trees at first PC detection, and that this relationship is concave (Table 3) (Figure 4). In addition, net price was positively related to the optimal plantation removal period. In Equation (33), price positively influences the marginal benefit of waiting an extra period (this is the LHS) and, ceteris paribus, implies greater income. In other words, a greater price provides an incentive to lengthen the rotation (Table 3). Note that this contradicts an earlier finding in the Without PC model where a greater net price resulted in earlier replanting periods.
Regarding the discount rate, Equation (33) indicates that it enters the marginal cost. This parameter multiplies the land value and at the same time enters in the discount factor. If one only considers the discount rate multiplying the land value, then a greater discount rate increases the marginal cost and encourages earlier replanting. If one focuses on the discount factor a greater discount rate implies smaller marginal cost which would lengthen the rotation. Interaction of these two effects, coupled with the age of initial infection, determine the outcome. If the
 (a)
(a) (b)
(b)
Figure 4. Optimal solution for the scenario with PC. (a) Mesh grid for T optimal solution; (b) Contour plot. The thicker and solid line represents the optimal solutions for T, where the mesh grid function reaches the zero value. These results illustrate the case of net price equal to 108 and discount rate equalto 0.8% (month).
planting is younger than 200 months at initial PC infection, a greater discount rate implies a decrease in the marginal cost, which in turn results in longer rotations. For plantings that are older than 300 months when attacked by PC, a greater discount rate increases the marginal cost, which shortens the rotation length. For those between 201 and 299 months there is not a clear trend and one must consider other parameters, such as price, to determine the relationship between the optimal period for palm removal and discount rate. It is important to note that for scenarios with PC, changes in net price have a larger magnitude of effect on optimal replanting time than changes in the discount rate.
5.4. Comparison among Results from Both Models
There are two factors that greatly influence these comparisons, net price and when PC attacks an oil palm planting, expressed in months. The latter, as shown above, affects the relationship between discount rates and the optimal time for removal. As indicated above, there is a negative relationship between net price and optimal replanting period in the Without PC model, whereas a positive relationship is found in the With PC model. These results are quite important because they play a major role in the optimal solutions for both models. In addition, with fixed annual discount rates of 5% (0.4% per month), 10% (0.8% per month) or 15% (1.25% per month) (Table 3), lower net prices effect shorter oil palm plot lifespan (with PC model) compared to the optimal time for replanting in the Without PC model. This trend is more prominent at higher discount rates (high risk perception scenarios).
Considering different net prices per kilogram of oil palm fruit (Table 3), removal would take place at the highest net price ($160) later in the With PC scenario than in the Without PC. This is due, in part, to the fact that the results of the Without PC model are more responsive to changes in prices and their promotion of earlier replanting periods.
The opposite occurs if one considers the lowest net price ($56), since the Without PC model indicates a longer planting lifespan with low prices. This responsiveness to net price in the disease-free model is the major factor in determining differences between solutions for theWith PC, and the Without PC models.
6. Concluding Remarks
Two models are proposed here and are intended to maximize the NPV of the orchard by choosing the optimal replanting/orchard removal period. The first model is intended to determine the optimal replanting period that maximizes the NPV of an orchard without disease. This model constitutes the “grower’s original plan” and its foundations are found in the Faustmann Rotation problem for determining the optimal rotation period. This model provides an effective tool for growers to tackle the crucial question of when to replant, which is by no means an easy one. In fact, for Colombian oil palms this was an unsolved question.
The second model seeks to maximize the same orchard’s NPV by determining the optimal amount of control and the optimal orchard removal period after PC is detected in the orchard. This model constitutes the “grower’s modified plan”. It is assumed that there exists an effective strategy for controlling PC.
Note orchard’s age at disease first infection is a parameter entering the second model. Since scientific information on the empirical application presented here state that oil palm trees are susceptible to being infested at any age, it was obtained a solution for each possible orchard age.
The disease model has two important results. First, the steady state level of diseased cases was always negative, which implies that growers must emphasize early detection and immediate orchard removal. Second, the optimal time to destroy Colombian oil palm plantations affected by PC  is negatively related to the plantation’s age when first attacked by PC (holding constant net price and discount rate). The disease model indicates that the optimal time for destruction ranges from 328 to 407 months (27.3 to 33.9 years), depending on a combination of the plantation’s age at PC attack, net price and discount rate. It was also found that regardless of the value of
 , there is a positive relationship between net price and optimal plantation lifespan.
The relationship between the optimal plantation lifespan and the discount rate depends upon the yield function. If the yield function has not reached its maximum when PC enters the field the relationship between discount rate and the optimal lifespan  is positive. On the contrary, if the yield function has already reached its maximum this relationship becomes negative. In other words, if the grower expects that most production will occur in the future and the discount rate is high, there is going to be an incentive to defer removal of the current standing. However, if most of the production has already occurred and the discount rate is high, there is an incentive for earlier removal.
The positive relationship between price and the optimum time for plantation removal differs from that obtained with the disease-free model. As discussed previously, this occurs because in the disease-free scenario net price is in both marginal cost and marginal benefit and the net effect of varying net price favors the marginal cost side. Meanwhile, the disease model displays net price only in the marginal benefit.
In terms of future research, we suggest the further development of this framework by including: varying prices, taking into account spatial and temporal dynamics of the disease, different levels of technology adoption, diverse yield scenarios, relaxing assumptions on effectiveness of the treatment, and relaxing the assumption of opportune detection, among other interesting cases. Additionally, it would be of extreme importance to incorporate the social dimension of the problem in these analyses. This could be done by assuming that there is a Central Planner solving for the NPV maximization problem who knows the parameters showing society’s concern with respect to the use of a specific control strategy.
Our work makes an important contribution to the literature. To our knowledge, no previous work has considered the question of optimal replanting age when disease is present in perennial crops.
7. Acknowledgements
The authors would like to thank Dr. Randy Ploetz, Dr. Pilar Useche and Dr. Richard Weldon for their comments and contributions to this work. Special thanks to Carlos Fontanilla, Camilo Sanchez, and Sebastian Castiblanco, researchers from Cenipalma for providing the bulk of data used in the analysis. This research was supported in part by Cenipalma, University of Florida, Colciencias, Colfuturo, and Fulbright Scholarship. Finally we wish to thank the two anonymous referees for comments to an earlier version.
REFERENCES
- E. A. Evans, “Economic Dimensions of Invasive Species,” Choices, Vol. 18, No. 2, 2003, pp. 5-9.
- R. C. Ploetz, “Diseases of Tropical Perennial Crops: Challenging Problems in Diverse Environments,” Plant Disease, Vol. 91, No. 6, 2007, pp. 644-663. doi:10.1094/PDIS-91-6-0644
- T. H. Spreen, M. L. Zansler and R. P. Muraro, “The Costs and Value Loss Associated with Florida Citrus Groves Exposed to Citrus Canker,” Proceedings of the Florida State Horticultural Society, Vol. 116, 2003, pp. 289-294.
- T. Mitra and H. Y. Wan, “On the Faustmann Solution to the Forest Management Problem,” Journal of Economic Theory, Vol. 40, No. 2, 1986, pp. 229-249. doi:10.1016/0022-0531(86)90073-6
- C. Clark, “Mathematical Bioeconomics: The Math of Conservation,” John Wiley & Sons Inc., New Jersey, 2005.
- K. Deininger, S. Jin and H. K. Nagarajan, “Efficiency and Equity Impacts of Rural Land Rental Restrictions: Evidence from India,” European Economic Review, Vol. 52, No. 5, 2008, pp. 892-918. doi:10.1016/j.euroecorev.2007.08.002
- D. Leonard and N. van Long, “Optimal Control Theory and Static Optimization in Economics,” Cambridge University Press, Cambridge, 1992.
- Fedepalma, “Anuario Estadístico 2007,” Fedepalma, Bogotá, 2008.
- P. L. Gómez, M. Mosquera and C. E. Castilla, “Oil Palm: a Sustainable Agro-industry in Colombia,” Oleagineaux, Gras et Lipides, Vol. 12, No. 2, 2005, pp. 121-124.
- C. Carter, W. Finley, J. Fry, D. Jackson and L. Willis, “Palm Oil Markets and Future Supply,” European Journal of Lipid Science and Technology, Vol. 109, No. 4, 2007, pp. 307-314. doi:10.1002/ejlt.200600256
- M. Mosquera and E. García, “Impacto Social De La Agroindustria De Palma De Aceite en Colombia,” Revista Palmas, Vol. 26, No. 2, 2005, pp. 11-19.
- M. Oliveira, D. Escobar, N. Rojas, J. Moreno, C. Quintero and A. Tibocha, “Caracterización del Empleo en el Sector Palmicultor Colombiano,” Cuadernos Fedesarrollo, Vol. 37, No. 1, 2011, pp. 1-93.
- G. Martinez, N. Arias, G. Sarria, G. Torres, F. Varón, C. Noreña, S. Salcedo, H. Aya, J. Ariza, R. Aldana, L. C. Martinez, O. Moya and C. Burgos, “Manejo Integrado de la Pudrición del Cogollo (PC) de la Palma de Aceite,” SENA-SAC, Bogotá, 2009.
- M. Mosquera, “Propuesta de Evaluación del Impacto Económico de la PC en la Zona de Tumaco,” Working Paper, Cenipalma, Bogotá, 2007
- G. Torres, G. Sarria, and G. Martinez, “Identificación Temprana y Manejo de la Pudrición del Cogollo en la Palma de Aceite,” SENA, Bogotá, 2010.
- E. Duarte and L. Gutterman, “Actualización de los Costos de Producción del Aceite de Palma,” Workingpaper, Fedepalma, Bogotá, 2008.
- M. Valderrama and H. Mondragón, “Desarrollo y Equidad Con Campesinos,” Tercer Mundo Editores, Bogotá, 1998.
- A. Chiang, “Elements of Dynamic Optimization,” Waveland Press Inc., Prospect Heights, 2000.
- Fedepalma, “Anuario Estadístico 2011,” Fedepalma, Bogotá, 2012.
- E. Lichtenberg and D. Zilberman, “The Econometrics of Damage Control: Why Specification Matters,” American Journal of Agricultural Economics, Vol. 68, No. 2, 1986, pp. 261-273. doi:10.2307/1241427
Appendix
Models Used to Parameterize the Models Regarding Pudrición del Cogollo
Empirical functions and parameters were calculated from available information. In what follows it is presented each model used for parameterizing the PC model.
Net Price
Fruit price was calculated from the Crude Palm Oil price series (Fedepalma, 2011) from January 2001-December 2010. Production costs were estimated from CEPLV records.
Potential Yield (Kg/ha/month)
Estimated model: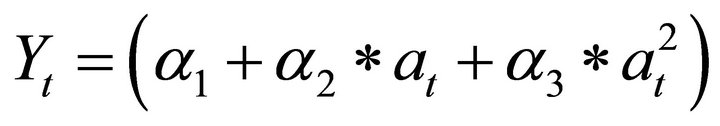 , where
![]() , expected yield and
, expected yield and  (age in months).
Damage Function. Yield in the Presence of PC
Estimated model: where
where , and
, and  is the number of PC cases detected.
Costs of PC Control Strategy (Colombian Pesos/Ha)
Estimated model: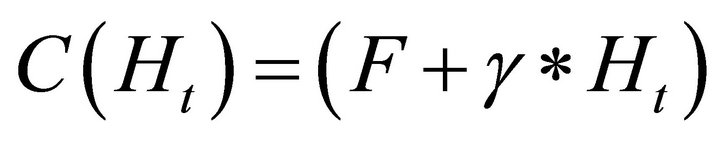 , where
 , PC control costs per month and
  is the number of PC cases treated.
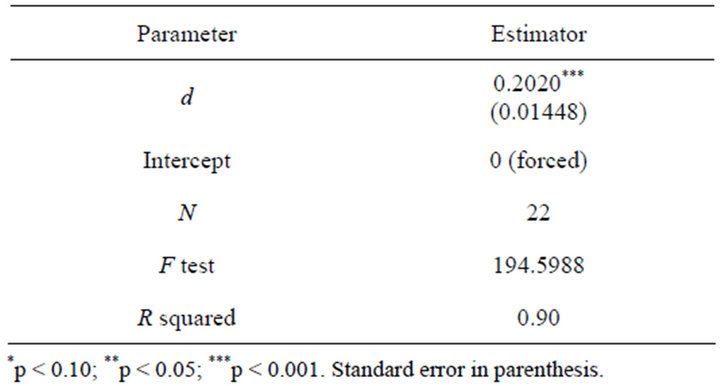
PC Disease Spreading Rate Term “d” In the Equation of Motion
Estimated model: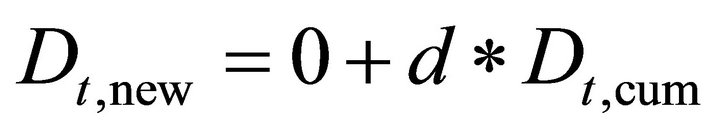 , where
  is PC new cases and
  represents PC cumulative cases. Note this is a regression with no intercept term (forced to the origin).
Table A1. OLS estimates of the effect of age and age squared on yield.

Table A2. OLS estimates of the effect of number of diseased trees and number of diseased trees squared on potential yield.

Table A3. OLS estimates of the effect of number of treated trees on PC control costs.
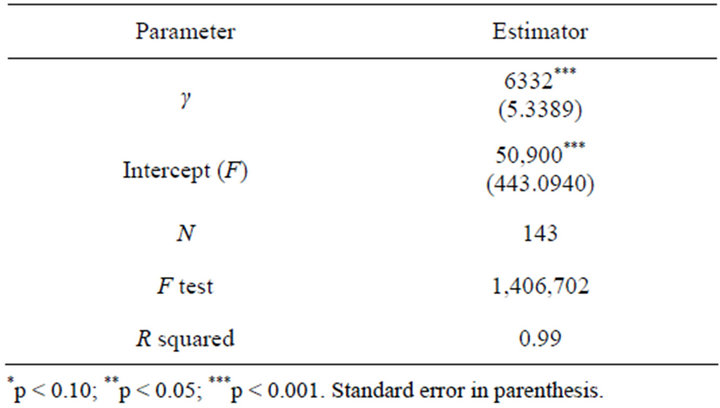
Table A4. OLS estimates of the effect of cumulative PC cases on new PC cases.
NOTES
1We consider a field with high yields because complete data are available for such a field. As will be demonstrated, the qualitative results will remain unchanged when considering a field with average or low yields.
2A bang-bang problem assumes that the control is either: in place or it is not. It is not possible to have intermediate scenarios of control. A good example is a ban on fishing: the policy maker either allows fishing or forbids fishing.
3In this outbreak, no control was implemented, allowing us to determine how the disease spreads from infections within the field. At CEPLV, the strict control program only allows estimation of the exogenous pressure.