Open Journal of Marine Science
Vol.05 No.04(2015), Article ID:60823,20 pages
10.4236/ojms.2015.54038
An Integrated Socio-Economic and Ecological Framework for Evaluating the Societal Costs and Benefits of Fishing Activities in the Pearl River Delta
Ying Wang1,2*, Haoran Pan3, Shiyu Li2, Pierre Failler4
1Zhejiang Provincial Key Research Institute of Philosophy and Social Sciences for Ecological Civilization, School of Economics and Management, Zhejiang Sci-Tech University, Hangzhou, China
2Guangdong Provincial Key Laboratory of Environmental Pollution Control and Remediation Technology, School of Environmental Science and Engineering, Sun Yat-sen University, Guangzhou, China
3School of Economics and Business Administration, Beijing Normal University, Beijing, China
4Centre for the Economics and Management of Aquatic Resources (CEMARE), University of Portsmouth, Portsmouth, UK
Email: *es03ying@163.com
Copyright © 2015 by authors and Scientific Research Publishing Inc.
This work is licensed under the Creative Commons Attribution International License (CC BY).
http://creativecommons.org/licenses/by/4.0/


Received 24 August 2015; accepted 27 October 2015; published 30 October 2015
ABSTRACT
This paper puts forward a model of Pearl River Delta (PRD) fishery in the South China Sea (SCS) that integrates the ecological, social and economic costs and benefits of fisheries activities in a multidisciplinary framework. In particular, an integrated ECOST model is composed of links between an ecological model constructed by Ecopath with Ecosim (EwE) software and a region Social Accounting Matrix (SAM). Then the costs and benefits of five fishing methods are compared from economic, ecological and social three dimensions base on the ECOST model. The potential effects of fishing effort reduction on fishing communication are explored by a series of dynamic simulations for a 10-year period. Key results from prediction (2005-2015) and policy simulations illustrate that fisheries of PRE are geared toward short-term economic profits at the expense of ecological gains and the whole group of societal benefits associated with fishing. However, the status quo can be improved to better levels by reducing fishing efforts.
Keywords:
Integrated ECOST Model, Ecopath with Ecosim, Costs and Benefits Analysis, Fishing Activities

1. Introduction
In China, the Pearl River is the second largest river (2200 km) in terms of water discharge, after the Yangtze. Currently, the coastal region of the Pearl River Estuary (PRE) is a significantly and quickly developing economic zone in China [1] . Due to recent large increases in the number of fishing boats and improvements in fishing technology, intensified fishing pressure on commercial fish species result in a decline in the biomass of many large-size and high-quality species and “prey release” of some low-valued species of small fish [2] -[4] . As an unavoidable result of the overcapacities of the PRD’s fishing fleets and the overexploitation of its fisheries resources, greater numbers of marine fishing vessels are no longer economically viable [5] . Therefore is quit important to understand the trade-offs between ecological, social and economic objectives.
Increasingly, scientists and economists from different disciplines have begun to realize the importance of pooling their information and results into multidisciplinary studies [6] [7] . The published ecological economic models that focus on marine fisheries can be categorized into three groups, traditional bio-economic models, regional fisheries economic models and ecosystem-based fishery management models.
The traditional bio-economic model is based on the Gordon-Schaefer model [8] [9] and has been explored by Clark [10] and other researchers from the mid-1970s onward. Bio-economic model tries to link the biological and economic models and reveal the optimal levels of yield. Traditional fisheries manage tools are more suitable for homogeneous fleets targeting one species and it is difficult to analyze large number of species [11] .
The second group is regional fisheries economic models, which focuses on the regional economic impacts of fishing sector. After Andrews and Rossi [12] reviewed input-output (IO) model studies of fisheries, increasing numbers of regional economic studies of fisheries have been published. In these literatures, regional economic impacts of fisheries have been studied using demand-driven input-output model [13] and supply-driven input-output model [14] . The role and linkages of the fishery sector have been examined in Hawaii [15] and Korean [16] [17] . While many of these studies used conventional IO models, a broader range of regional fisheries economic models has also been utilized [18] [19] . Social Accounting Matrix (SAM) model is an extension of input and output accounts, and the main advantage of a SAM based-analysis over the IO analysis is that the social-economic linkages are taken into account as well as other transactions such as linkages between the production and household sectors. Fernandez-Macho et al. [20] and Seung and Waters [21] develop SAM model to assess the contribution of fishery sector on employment and income. More recently, Arita et al. [22] demonstrate the use of SAM modeling to assess the income distribution linkages of commercial fishery sector in Hawaii. However, these models are static that don’t describe the dynamics interaction in economics and biological system.
Rather than the traditional management focus on individual stocks and individual regional fishery economics, nowadays, widespread acceptance that a more integrated perspective is needed would take marine ecosystem preservation, economics and social objectives into account. In this context, the ecosystem-based fishing management (EBFM) approach has emerged as a promising approach [23] . However, few ecosystem approaches based regional fisheries economic models are carried out, because it requires multi-disciplinary research, which may increase the complexity of the regional economicanalysis. Jin et al. [24] develop an economic-ecological model by coupling a region input-output model of a coastal economy to a linear ecological model of a marine food web. As one of first application of a CGE model in a marine ecosystem-based fishery management, Finn off and Tschirhart [25] [26] developed an integrated regional economic-ecological dynamic CGE model of Alaska fisheries to examine the welfare changes related to regulating commercial fishing quotas. Jin et al. [27] develop the framework by linking a CGE model to an end-to-end (E2E) model of marine food web to help assess the implementation of ecosystem-based fisheries management (EBFM) in New England. To our knowledge, no study has so far estimated the societal benefits and costs from social, economic and ecological three directions at métier level. Here, métiers are defined as a particular fishing fleet targeting at several particular species with a particular gear.
This paper presents the integrated ecological-economic-social model-ECOST on the fisheries societal costs and benefits in the PRD. The ECOST model was developed by Failler and Pan [28] foran international fisheries research project―Ecosystems, Societies, Consilience, Precautionary principle: Development of an assessment method of the societal cost for best fishing practices and efficient public policies (short for ECOST), of the European commission. In particular, the ECOST model is developed by coupling a region Social Accounting Matrix (SAM) to an ecological model constructed by Ecopath with Ecosim (EwE) software. The main goal of this model is to combine social, economic and ecological systems into an integrated assessment, better describing the interaction between socio-economic and ecological systems.
2. Case Study
As a result of rapid economic development in recent decades, the coastal Pearl River Delta has experienced rapid industrialization and urbanization. The high population density and rapid development of industry and agriculture have resulted in severe stress to the aquatic environment. The PRE is also an important fishing ground in the South China Sea, and it provides abundant fishery resources for the PRD. The PRE ecosystem in this study (less than 60 m depth) ranges from 112˚30'E to 115˚00'E, 21˚30'N to 23˚30'N. The PRE falls largely within the PRD Economic zone. The study area is associated with six municipal cities, including Guangzhou, Zhuhai, Zhongshan, Dongguan, Shenzhen and Jiangmen, and two special administered regions, namely, Hong Kong and Macau (Figure 1). According to these boundaries the scope of the research covers approximately 72,490 km2 [29] .
Because of the special hydrological features of the PRE, the interaction among fish species in the Pearl River are quite complex, primarily because of the large variety of species involved, and their diverse mechanisms of biological predation and habits [30] . These factors cause a very composite tropical marine ecosystem to exist in this region.
Chinese fisheries policy has moved in a new direction toward the sustainable utilization of fisheries resources. Since fisheries are facing obvious risks from depleting natural resources and serious environmental pollution [5] [31] , the goal of fisheries is shifting from an emphasis on employment and economic benefits to one that sought a balance between maximizing societal wealth and conservation of fisheries resource [6] [32] . Using the PRE as a case study, the trade-offs between ecological and socio-economic objectives of fisheries management in an estuary ecosystem are explored.
3. Mechanism of ECOST Model
ECOST model presents a fishery assessment method that attempts to assess the social, economic and ecological

Figure 1. Map of the Pearl River estuary.
costs and benefits in a framework coupling the ecosystem to socio-economic systems. As a typical estuary ecosystem, the PRE ecosystem can be described by the interactions of species in a complex food web. Therefore, understanding the biomass stock and ecological relationships of these species is an important part of designing renewable resource policies. In this paper, the PRE ecosystem is simulated by applying an Ecopath model, which has been widely used for constructing food-web models of marine and other ecosystems [33] . The species in the food web are represented by predator-prey relationships, and several of these function groups are commercial fishes that provide inputs to economics system.
An accounting method is applied for economic analysis of the fisheries, and a social accounting matrix (SAM) is constructed for the PRD fishing sector to examine both the linkages between the fishing industry and other industrial sectors, and their relationship with social levels from the household to the global scale. The SAM table provides a consistent database that allows for a detailed analysis of the economic structure of the PRD, and it is a useful tool for assessing the impact of fishing activities on the economy as a whole. Then we try to link the socio-economic model and the ecological model to produce an integrated ECOST model for fisheries management. And this integrated ECOST model is adopted to assess the societal benefits and costs for fisheries activities in the PRD. Finally, simulations are developed for a 10-year (2005-2015) period under five scenarios based of the 1998 Ecopath model with each scenario involving reduction of fishing effort of vessels by different métiers at annual rate of 5% from 1985 to 2015 for 30 years. The heterogeneity of fleets, such as vessel size and fishing gear types, leads to a variety of economic, social and ecological evaluation.
The ECOST model is built on Microsoft Excel 2007 version and contains several sheets, which are divided into the following three parts: data input, connection between ecological and socio-economic systems, and results output. The data input includes six sheets: macroeconomic, métier, microeconomic, economy, social and efforts. The results output includes the biomass, input and output table, multiplier, society and 10-year dynamic simulation. The connection section is an Ecopath sheet in the ECOST model describing the linkage between the socio-economic and ecological models. The results of the biomass changes, which are simulated by Ecosim model, are imported into ECOST model. Finally, fishing policy is simulated through time-series of fishing efforts, which are based on the optimal allocation of fleets among different métiers. The theoretical and mathematical backgrounds of the ECOST model are detailed elsewhere [28] [34] . We used a flow diagram (Figure 2) displaying the variables and process to illustrate the mechanism of integration of social, economic and ecological systems.
3.1. Ecosystem Model
The Ecopath with Ecosim is applied in the ecological model to analyze the structure of trophic interaction in the ecosystem. The method and theory of Ecopath and Ecosim modeling are detailed in the EwE user guide [35] [36] . The vulnerability fact is one of the most important parameters that determine the form of predator-prey re-

Figure 2. ECOST model with integrated of social, economic and ecological system.
lationship. Here, observed time-series catch rate data of commercial fish and fishing effort data of five fishing métiers from 1981-2005 are used to estimate the vulnerability factors which provided some empirical support to the model. A previous constructed Ecopath model [3] for the PRE ecosystem is used as the base for Ecosim prediction of biomass and catches dynamic. The parameters of Ecopath model are presented in Table 1.
3.2. Social Accounting Matrix
Here, a social accounting matrix (SAM) provides a consistent database that allows a detail analysis of the eco-

Table 1. Basic parameters of the PRD coastal ecosystem model (1998).
B―biomass, P/B―production to biomass ratio, Q/B―consumption to biomass ratio, P/Q―production to consumption ratio, EE―ecotrophic efficiency.
nomic structure of a region. It is also a useful tool to assess the socio-economic linkages of a production sector. A SAM can be represented as a square matrix T whose tij element shows the transaction value where the income obtained by account i originates from the expenditure by account j. The matrix of direct coefficient in the PRE SAM model, denoted S, is derived as follows
 (1)
(1)
where S is the matrix of SAM direct coefficients; A is the matrix of technical coefficients, includes sales and purchases; V is the matrix of value added coefficients that includes payments from production accounts to factors; Y is the matrix of value added distribution coefficients that includes factor payments to the institution accounts; C is the matrix of the expenditure coefficients that includes household purchases of industry output; and H is the matrix of institutional and household distribution coefficients that includes inter-household/institution transfer payments.
The SAM model can then be written as follows
 (2)
(2)
or
 (3)
(3)
where x is the vector of total production output; v is the vector of total value added; y is the vector of total institutional income; ex is vector of exogenous goods and services demand (from exogenous stimulus measures, government expenditure/investment, export demand, or other exogenous resources of demand); and ey is vector of exogenous household transfer payment (primarily government transfer payments). Here (I − S)−1 is called the SAM multiplier matrix or matrix of SAM inverse coefficient.
In this paper, the inter-industry accounts of SAM in the PRE are retrieved from the 2002 Guangdong province input-output model (Table 2). As detailed in column 2, the total output value of the PRD fishing reached 1643.82 million Euro in 2004, representing 1.42% of the PRD’s gross production at current price, an increase of 13.4% from the previous year (unless otherwise specified, increase rates are calculated at the constant price of 1990). The value of fishing processes and rest of the fisheries economy are 190.93 and 1314.72 million Euro, respectively. Row 4 shows that, of the 1643.83 million in fishing industry income, 1512.25 million are sales within the PRD region, and 131.57 million are exported to nearby households and neighborhoods (e.g., Hong Kong and Macao).
A simplified basic fish production table that considers the addition of fisheries harvesting sectors to detail the production of fish is presented (Table 3). Our model encompasses five métiers from the PRE area: the demersal species trawling, the shrimps trawling, the Japanese scad purse seine, the threadfin bream gill net and the squids hook and line. The main fishing target species or groups include squids, melon seed, pomfret, upeneus bensasi, chub mackerel, silver croaker, lion head croaker, greater lizardfish, Japanese jack mackerel, threadfin bream, bigeyes, Japanese scad, Cutlass fishes, shrimp, crab, squid, and jellyfish, etc. [37] .
3.3. Valuation of Societal Cost and Benefit
3.3.1. Economic Cost and Benefit
The economy consists of the PRE fishery sectors, including marine capture and fish processing, and the PRD households, and is linked to the rest of the world through the commodity and factor (labor and capital) markets. The economic model combines macroeconomic structure with microeconomic fishery production, thereby reflecting the production chain of the fisheries.
The economic value of an estuary ecosystem is defined on the basis of its relevant ecological features, and its

Table 2.Social accounting matrix(SAM) for the PRD coastal economy in 2004.
Table 3.Fish production make table of the PRD in 2004.
economic value is equivalent to the net present value of goods and services that flow from uses and “non-uses” of the resource. The sum of consumer and producer surpluses associated with identifiable uses of the ocean, such as recreation, commercial fishing, marine transportation, etc. In the ECOST model, we only estimate the direct economics value from fishing activities, economic costs and benefits of fishing activity include the costs and benefits of three fisheries sectors: harvesting, processing and marketing. These cost and benefit must be forecasted into the future and discounted back to the present. We assume that the annual economics discount rate remains at 4% for all simulations and embodied technical change enhances productivity by approximately 1% per year. It is important to understand the SAM model contains both supply-push and demand-pull input-output mechanism at its core to trace the full impacts of marine fishing on the economy, however, it is not a substitute for the calculation of surpluses. Here, the ECOST model provides an approach to estimate the economics cost and benefit. The method and theory of the calculation of economic cost and benefit of fisheries are detailed in the ECOST model user guide [34] , from which the brief description of the model and behavior of each fishing sector provided below borrows extensively.
1) Fishing harvesting sector
The fish harvesting sector consists of a number of producers-the harvesting métier that are defined as a particular fleet equipping with a particular gear and targeting at a particular species as main catch. Therefore, the benefit of a harvesting métier is the total value of a mix of different species including by catch. In addition, the producer may receive management benefit and subsidy for production from public sector. Then, the producers’ total benefits can be calculated as follows
 (4)
(4)
where, bhar represents the benefit from harvesting sector of fisheries; s indicates species of fish, qs and
 are the catch of species sand the landing price of this fish;
 and
and
 are the management benefit and subsidy for fishing harvesting sectors from public sector, respectively.
The fishing harvesting production requires inputs of intermediate products, services, labor, capital and tax (production tax, environmental or resource tax, etc.). The cost and benefit of the producer by métier can be calculated as follows
 (5)
(5)
where,
 represents the cost of fisheries harvesting sector;
 ,
,
 and
and
 are intermediate products, labor and capital;
 ,
,
 and
and
 are their prices, respectively;
 and
and
 arefixed cost and tax.
2) Fish processing sector
The fish-processing sector is considered to consist of multiple types of producers, which specialize in processing a single species of fish. In addition, the producer may receive management benefit and subsidy for production from public sector. Therefore, the value output of the processing activities can be calculated as follows
 (6)
(6)
where,
 represents the benefit from processing sector of fisheries; sp indicates the species of fish processed, and
 and
and
 are the quantity and price of the process fish;
 and
and
 are the management benefit and subsidy for fishing harvesting sectors from public sector, respectively.
The production of each type of fish processing sector requires input of a particular species of raw fish among the species sp, non-fish intermediate products and services, labor and capital. Thus, the cost per unit of processing activity of processing sectors can be calculated as follows
 (7)
(7)
where,
 represent the cost of fisheries processing sector;
 ,
,
 ,
,
 and
and
 are input of raw fish, non-fish intermediate products, labor and capital;
 ,
,
 ,
,
 and
and
 are their prices, respectively;
 and
and
 are fixed cost and tax of processing sectors.
3) Fish marketing sector
The fish-marketing sector is considered to consist of three types of distributors, including small-scale distributor focusing on local markets, large-scale distributor focusing on domestic markets, and exporter. Each distributor sells multiple products including both raw and processed fishes and they may receive management benefit and subsidy for activity from public sector. Thus, the distributor’s total benefit is
 (8)
(8)
where,
 represents the benefit from marketing sector of fisheries;
 and
and
 are the price of the raw and the processed fish;
 and
and
 are the qualities of the raw and the processed fish;
 and
and
 are the management benefit and subsidy for fishing harvesting sectors from public sector, respectively.
The marketing sectors production requires inputs of raw fishes, processed fish products, non-fish intermediate products are services, labor and capital. Thus, the cost of marketing activities can be calculated as follow
 (9)
(9)
where,
 represents the cost from marketing sector of fisheries;
 ,
,
 ,
,
 ,
,
 and
and
 are input of raw fish, processed fish, non-fish intermediate products, labor and capital;
 ,
,
 ,
,
 ,
,
 and
and
 are their prices, respectively;
 and
and
 are fixed cost and tax of processing sectors.
3.3.2. Ecological Cost and Benefit
One link between the ecosystem and economic systems involves the supply of ecosystem resources, goods, and services to the economy, such as fish stocks as inputs to the fish-harvesting sector. The concept of ecosystem service value can be a useful tool for evaluating ecological costs and benefits. Ecosystem services to human being can often be simply assessed, as in the case of fish harvested from the ocean, but in other cases they may be indirect and difficult to determine, such as gas and climate regulation, leisure and recreation, and nutrient cycling [38] .
Ideally, we would estimate the ecological impact on the food web and habitat, i.e. benefits from ecosystem services and external costs on biodiversity losses and habitat destruction. Due to limitations on the availability of data, it is unable to estimate all of the cost and benefit of ecosystem impacts. Instead we purse a simplification of the concept of ecological benefit and cost that we focus on the direct economics value from fishery and ecological losses from overfished resource stocks. Specifically, the landing value of fish species is defined as the ecological benefit of this fish species provided to the fishery. The ecological benefit of fisheries activities is defined as the landing value of fish harvested which is equal to the economic benefit. Therefore, the ecological benefits of fishing are calculated as zero to avoid double counting.
Traditional concepts of overfishing include growth overfishing, recruitment overfishing, maximum sustainable yield (MSY), maximum economic yield (MEY) and potential biological removals-PBR-of marine mammals, etc. [39] [40] . Although classic economic definition of overfishing is relative to maximum economic yield not maximum sustainable yield, using the MSY benchmark is more realistic than classic MEY [41] . In our research, we adopt the maximum sustainable yield (MSY), which considers the economic capture of marine fish beyond maximum sustainable yield levels, to calculate the ecological cost of fishing.
The concept of MSY in single-species is criticized for many reasons [42] . One of the obvious limitations of single-species fisheries management is that it is not holistic. It generally does not consider the species interaction, changes in ecosystem structure or function, biodiversity and ecosystem services, etc. The study showed that widespread application of single-species MSY policies would in general cause severe deterioration in ecosystem structure, in particular the loss of top predator species [43] . The difference between the MSY of a species calculated from single-species assessments to those calculated from multi-species assessment is estimated using the already developed routine in Ecosim. Furthermore, ecosystem-based overfishing concepts played greater role in fishery management [40] . Ecopath and Ecosim model provides an ecosystem-based approach, which can be expressed as different equations defining trophic interactions as dynamic relationships varying with biomass and catch changes. However, Ecopath only provides a static picture of ecosystem trophic structure. Ecosim is a dynamic model, which simulates changes in ecosystems that are described under Ecopath. Ecosim model has been fitted to the catch and fishing effort time-series data from 1981 to 2005 of the PRE ecosystem [2] [3] , for which there are long-term data that confirm the ability of the model to reproduce past responses of many species to harvesting, and to predict the biomass and catch dynamics in the simulated years (2005-2015). The dynamic changes in the biomass and catch date of each functional group resulting from the Ecosim simulation are then imported into the ECOST model to calculate the economic benefit and ecological costs changes. Here, ecological cost is measured as foregone losses from overfishing resource stocks. This paper is much more about over fished resource stocks not ecosystem impacts, even if Ecopath is used to capture some of the ecosystem dynamics rather than a single-species population model.
In this study, we want a measure of the total quantity of goods and service the economy and ecosystem is producing that is not affected by changes in the prices of those goods and service. Thus, the nominal value is evaluated by using prices that are fixed at 2004 level. It shows that how the production of goods and service changes over time [44] [45] . The prices of landing are assumed to be constant which were collected from market survey data in 2004 (unpublished data). Catch data of fish species in the PRE are derived from 1981-2005 Fisheries Yearbook, and biomass data are estimated by the model or obtained from stock assessment reports, field survey data, or other models. The price, biomass stock and catches of commercial fish species in ECOST model are showed in Table 4.
For each species, we estimate MSY levels based on Ecosim predictions. Let el refer to the ecological system,
 indicate the total catch of a species s, and
 and
and
 represent the price and maximum sustainable yield of the species, respectively. The Schaefer model is applied to estimate the maximum sustainable yield (MSY) for fishes in the delta regions. Therefore, the ecological cost is
 (10)
(10)
If the maximum sustainable yield is below the actual landings, there exists an ecological cost, which is positive. If the maximum sustainable yield (MSY) exceeds the actual landings , the ecological cost falls to be negative, presenting an ecological benefit.
3.3.3. Social Cost and Benefit
The concept of social service is discussed in Millennium Ecosystem Assessment [46] [47] . The services include five categories, namely basic material needs, health, social relations, personal security, and freedom and choices. Clearly, the first two categories are directly related to personal income that is generated from the economy.
Table 4. Input ecology data of ECOST model of the PRD in 2004.
While there are numerous studies on the economic benefit and cost of fishing activities, there is rare literature on social benefit and cost. The Social consideration tends to include benefits for fish communities and fishermen’s livelihood [48] . Personal income distribution is commonly regarded as one of the main forces determining the social cost and benefit of fishing activity. It is closely related to wellbeing, poverty, and other income-based social issues. After all, some no-income based social issues are also indirectly related to personal income distribution.
The model assumes that the linkages between the social and economic systems are made through income distribution and that personal income distribution is one of the main forces determining social costs and benefits. Fishery household expenses can be classified into basic material needs, health, social relations, personal security, freedom and choice, according to the agriculture statistical yearbook of Guangdong province (2005) (Table 5). Personal security refers to health care and savings, which account for 8% and 39% of personal expense, respectively. Household saving is thus the major components of personal expenses in China.
The ECOST model focuses on the social cost and benefit of basic material needs and health, leaving all other social services to the other categories. Let BMN, HLH and OTH represent basic material needs, health care and other social services, respectively. PIF represents personal income for fisheries households, and α indicates the share of each expense in personal income. PEH represents the average personal expenses for fishermen in the PRD. The social benefit of social services can be calculated with the formula
 (11)
(11)
To address the social cost, at first, we define a society’s economic position. We assume that an ideal level of personal income in a society is known. Based on this, ideal levels of spending on basic material needs, health and others can also be derived. Furthermore, based on the current situation, we can calculate the necessary spending on basic material needs, health and others, respectively. If we define the real spending as social benefit, the difference between the ideal and real situation measures the social cost. Since it is difficult to define the value of ideal levels, we assume the local residents’ average level is an ideal level for fishermen. Thus, the social cost is the difference between local residents’ average expenses and those of fisheries households in the PRD. Let PEN represent personal expense at the average level of locate residents, the social cost for the fisheries community is calculated as
 (12)
(12)
3.3.4. Societal Costs and Benefits
As previously stated, the societal costs and benefits of fishing activities are accounted for by the sum of their social, economic and ecological costs and benefits. Let st indicate the society and en, el and sc indicate economic, ecological and social factors, respectively. B, C and P indicate benefit, cost and profit, respectively. The societal costs and benefits can be calculated by
 (13)
(13)
The societal profits are calculated as
Table 5. Personal expenses of local residents and fishermen of the PRD in 2004.
Note: Date from the Agriculture statistical yearbook of Guangdong province, 2005.
 (14)
(14)
4. Results
4.1. Cost and Benefit Valuation
The ECOST model can assess the societal costs and benefits of fishing activities at the métier level and it is applied in this paper to compare and analyze the economic, social and ecological costs and benefits of fisheries activities in the PRD of China. Five métiers are selected for the cost and benefit valuation: demersal species pair and stern trawling (M1), shrimp trawling (M2), Japanese scad purse seine fishery (M3), threadfin bream gill net fishery (M4) and squids hook and line fishery (M5). Figure 3(a) to Figure 3(d) show the cost and benefit analyses of the economic, ecological and social systems as well as for the whole fisheries community. To compare the costs and benefits of métiers in a consistent framework, the unit euro/ton is used in the figures. All values in RMB are converted to Euro?by assuming the fixed exchange rate of 1 EUR = 10.29CNY in 2004. In theory but seldom in practice, a shadow exchange rate should be employed to provide society’s accurate valuation of foreign exchange, which may be a potential source of bias.
The economics costs, benefits and profits of the fisheries under the different métiers in 2004 are shown in Figure 3(a). In terms of economic revenue, shrimp trawling and demersal species pair and stern trawling are the most profitable métiers, it is therefore clear that trawlers play an important role in the PRE’s marine fishing. Trawlers are one of the least selective gear types, with significant mortality of all fish ages (and particularly high

 (a) (b)
 (c) (d)Notes: M1: Demersal species trawling, M2: Shrimps trawling, M3: Japanese scad purse seine, M4: Threadfin bream gill net, M5: Squids hook and line.
Figure 3. Economic, ecological and social profits for per ton catches of the PRD in 2004. (a) Economic cost and benefit of per ton catches the PRD in 2004; (b) ecological cost and benefit of per ton catches the PRD in 2004; (c) socialcost and benefit of per ton catches the PRD in 2004; (d) societal cost and benefit of per ton catches the PRD in 2004.
for the younger ones), high by-catch and discard rates [49] . The coastal trawlers catch mostly juveniles, small fishes and invertebrates, such as shrimps and crabs, which have high market prices. Squids hook and line and threadfin bream gill net, which generated 718.74 Euro/ton and 663.92 Euro/ton, rank third and fourth respectively. Japanese scad purse seine is the least profitable technique, the use of purse seine gear is discouraged in the PRE, and only a few seiners operate in Shenzhen, Zhongshan and Jiangmen cities, catching a relatively small amount of fish. Because hook and line and gill net métiers generally are practiced by small scale, family- based fisheries, which target their product at high market prices, they generated more economic benefits than purse seiner fishery.
The ecological cost, benefit and profit of fisheries under different métiers are shown in Figure 3(b). In this analysis, it can be observed that marine resources are overexploited by all five fishing métiers, causing a loss to the ecosystem. The ecological profits are negative, which indicates that fishing efforts have exceed the natural growth of several fish species harvested. Bottom trawling causes a widespread disturbance of sediments in the estuary and has negative impact on both seabed and its organisms. Both the pair and stern trawling and shrimp trawling practices caused great ecological costs due to overfishing. The ecosystem structure of the PRE has shifted over time as large predatory species are depleted and smaller fishes gained dominance [2] . High demand for small fish and juveniles for the booming Mari-culture of predatory fishes, the high market price of invertebrates, and the reduced operational costs of fishing by smaller boats evidently provide the support and incentive for continued resource depletion [50] .
The social costs, benefits and profits of fisheries under different métiers are shown in Figure 3(c). As observed in the graph, the social benefits of the five métiers follow similar trends to their economic benefits, as their social costs, which result from personal expenses being closely related to economic revenue. Our social profitability analysis shows that even though small-scale fishing generates positive profits, average fishing income is below the average income of local residents in the PRD, and is barely enough to cover household expenses.
Finally, we combined the economic, ecological and social profits of the PRD into the same graph to determine why these fishing profits fall to be negative. The societal costs, benefits and profits of fisheries under different métiers are shown in Figure 3(d). Although shrimp trawlers have the highest economic and social profits, they also have negative impacts on the estuary ecosystem. Gill netis a métier with the most advantageous trade-offs between ecological and socio-economic objectives. Although economic performance of the gill net is not as good as trawlers do, it is environmentally friendly. The design of gill net has several favorable characteristics: low energy use, high selectivity and low discard rates. The squid hook and line and Japanese scad purse seine methods both generate low socio-economic benefits while producing relatively huge ecological cost. The ECOST model develops an integrated framework in which the economic, ecological and social systems interact with each other. The societal costs and benefits of fishing activities are accounted for by the sum of their social, economic and ecological costs and benefits. There sults reveal that the PRE fisheries are in a loss state in which all of the societal profits fell into the negative. This analysis suggests the currently status of the PRD fisheries appeared to pursuit economic benefits at expense of ecological gains. Therefore, effective conservation policy is critically needed to counter the strong tendency to overfishing.
The ECOST model develops a methodology to assess the societal costs and benefits of fishing activity in the PRE of China at the métier level. However, from a policy maker’s perspective, it is more convenient and desirable to compare all fishery-related costs and benefits in a common unit. The costs and benefits of the social, economic and ecological systems are all analyzed in this paper.
4.2. Cost and Benefit Prediction
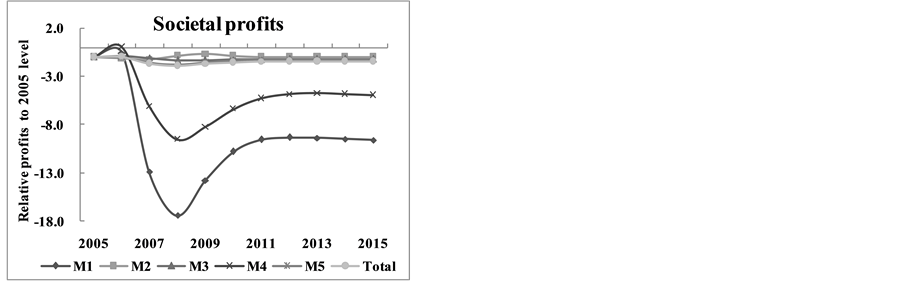
The ECOST model can also be applied in benefit and cost prediction. Changes in the profits of fishing activities for ten years are simulated using historical time-series data of fishing efforts from 1985 to 2005 (Total engine power of boats in the South China Sea, Administration of Ocean and Fisheries, 2005). The economic impact multipliers contain indirect and induced along with direct impacts. Two assumptions are required before ten years simulation: 1) There is excess capacity in the economy over this entire time period and 2) labor employed due to these secondary impacts is drawn from the ranks of unemployed and under employed and not from the ranks of the already employed. The simulation results of fishery profits from 2005 to 2015 are presented in Figure 4.


 Notes: M1: Demersal species trawling, M2: Shrimps trawling, M3: Japanese scad purse seine fishery, M4: Threadfin bream gill net fishery, M5: Squids hook and line fishery.
Figure 4. Predicted changes over time in PRE ecosystem from 2005 to 2015 driven by fishing efforts. Changes are shown relative to the ecological, economic, social and societal profits in 2004, respectively.
As the first chart indicates, the variation ranges of the total societal profits of shrimp trawler, purse seine, and hook and line fishery are all within ±50% of current level. However, the societal profits of stern and pair trawling and gill net fishery declined sharply from 2006 onward, with the downward trend stabilizing from 2008 onward. As previously explained, ecological cost is composed of landings minus maximum sustainable yield (MSY), and it appears that the ecological profits of all métiers are negative in the simulation years. The curves of ecological profits demonstrate dramatic decreases in the first three years, although the downward trends somewhat stabilized from 2008 to the end of the simulation. It is apparent that ecological losses will only intensify under current exploration levels. In terms of economic objectives, all of the métiers would become less profitable, with the exception of shrimp trawling. The increased dominance of small pelagic fishes and invertebrates is one of the main reasons for the rising economic profits of shrimp trawlers. They possess very robust life characteristics of being fast growing, short lived and highly fecund. This result suggests that the economic benefits play a dominant role across whole fisheries communities. Furthermore, the social profit also invariably experienced an increasing trend, although it appears that the value changes of social profit are not as abrupt (within 20% of current levels).
4.3. Policy Simulations
To address the issue of excessive capacity, the Chinese government has taken measures to limit (and in some cases reduce) the fishing capacity of the fleets [32] . Previous study has suggested that the Northern South China Sea ecosystem could be restored by reducing fishing effort at annual rate of 5% for 30 years [51] . In this paper, we simulate the policy of reducing fishing effort by different métiers at annual rate of 5% from 1985 to 2015 for 30 years. Fishing vessel or license buybacks have been proposed as possible means to reduce fishing capacity and restructure fishing fleets to achieve specific management objectives [52] . Buybacks can be viewed as a second-best policy (A first-best policy is the most economically efficient instrument that addresses the problem in question), although there are first-best exceptions such as the buying back of harmful gear and its replacement with biodiversity friendly gear [53] . Due to limitations on the availability of cost data, it is infeasible to estimate full cost curves of fishing effort-reducing program. Therefore, it is should be admitted that the societal profits are overstated, and the economics cost of fishing effort control policy are excluded from the analysis. Figure 5 shows the resultant simulation trends for the following scenarios: S0, status quo; S1, simulation of the reduction of fishing effort for pair and stern trawlers; S2, simulation of the reduction of fishing effort for shrimp trawler; S3, simulation of the reduction of fishing effort for vessels using purse seine gear; S4, simulation of the reduction of fishing effort for vessels using gill nets; S5, simulation of the reduction of fishing effort for vessels using hook and line gear.
The simulation results suggest that the status quo can be improved to optimal levels by reducing fishing efforts. The policies of reducing the efforts of most fishing métiers create major improvement in societal profits. Reducing the fishing efforts of pair and stern trawlers generates the maximum societal profits gain, while reducing the efforts of shrimp trawling, purse seine fishing and gill net fishing all had similar positive impacts on total profits. Most of the métiers achieve an increase in societal profits under effort reduction policies with the exception of shrimp trawling and Hook and line, which experience a decline in profits due to their inherently high profitability.
Overall, vessel buyback programs can reduce fishing capacity and moderate negative impacts on the fishing communities. In terms of the ecological system, decreasing fishing effort would help to restore the PRE ecosystem and prevent the depletion of several vulnerable species that have already been heavily fished. Economically, many commercially valuable species are heavily over-exploited, which leads to the diminishing of potential economic benefits. However, restoration can increase stock abundance and improve the profitability of fishing


Figure 5. Predicted changes in societal profits of five métiers compared to the status quo after a 10 years period of simulation.
activities. Policies that reduce the fishing efforts of those métiers that have large negative impacts on the ecosystem should be implemented while contributing relatively minor economic benefits. For example, reducing pair and stern trawlers can effectively improve total profits. Purse seiners also generate low economic revenues while exerting negative influences on juvenile fish populations.
5. Discussion
5.1. Sensitivity Analysis
We conduct a sensitivity analysis to study the effect changes in the key economic and biological parameters on the optimal policy. The vulnerability factor is a key uncertainties parameter in the Ecopath model. Low vulnerability (close to 1) means that an increase in predator biomass will not cause any noticeable increase in the predation mortality; high vulnerability (e.g., of 100) indicates that the predator biomass will create large fluctuations in predation mortality.
The biomass dynamic is sensitive to the vulnerability factor, particularly in a top-down controlled ecosystem [54] . As expected, that the top-down controlled system varies more considerably than the entire system is assumed to be either bottom-up (Vulnerability factor = 1) controlled or estimated “optimal solutions” (Figure 6). When ecosystem is assumed to be bottom-up controlled, the profits become closed to a linear relationship. Also, the estimated profits are similar to those from scenarios with vulnerability parameter obtained from time-series fitting (base estimation).
The ecological, economics and societal profits predicted from bottom-up controlled scenarios are higher than those from scenarios with vulnerability parameters obtained from time-series fitting, whereas the lower social profits are predicted. Under the top-down controlled assumption, plot of estimated maximum achievable ecological, economic and social benefits is highly scattered at beginning and finally rebound to original level.
The discount rate is an important parameter to calculate the net present value in economic analysis [3] . Usually, a lower discount means more weights are placed on future net benefits relative to the higher discount rates [55] . In general, the trade-off of relative profits is qualitatively robust to the discount rates (2% and 10%) used in this study. The shapes of profits are similar under different discount rate scenarios while the absolute values varied (Figure 7). As expected, a higher discount rate (10%) reduces the net present value of profits from


Figure 6. Predicted changes in ecological, economic, social and societal profits under 1) V1-bottom-up controlled (vulnerability parameters = 1), 2) V10-top-down controlled (vulnerability parameters = 10) and 3) Vb-base estimation (vulnerability parameters estimated from fitting with time series data) were included in the figures for comparisons.


Figure 7. Predicted changes in ecological, economic, social and societal profits under 1) D2-annual discount rates 2%, 2) D10-annual discount rates 10% were included in the figures for comparisons.
the fisheries. The result suggests that high discount rates focus on short term economic benefits at the expense of long-term socio-economic and ecological gains.
5.2. Fishing Policy Optimization
The impacts of fishing policy on the benefits and costs of fishing activities are simulated by the ECOST model. Temporal scales are clearly important for both ecological and socio-economic dynamics. The long-term forecast (10 year) using the ECOST model is to reach a steady state balance, which allows us to derive the dynamic changes of benefits and costs. The simulations predict fisheries of PRE are geared toward short-term economic profits at the expense of ecological gains under current exploited level and the status quo can be improved to better levels by reducing fishing efforts. According to the observation fisheries data in Northern South China Sea [56] [57] , the result of predicting is accordance with the actual case.
Conventional economic theory predicts that for an overfished ecosystem, profits from the system will increase if fishing capacity is reduced to a level that produces the maximum economic rent [8] . However, the optimal fishing efforts for maximum societal benefits cannot be obtained using the ECOST model. A numerical optimization ecological modeling (Ecopath with Ecosim) has been used to explore the trade-offs between conservation and socio-economic objectives in the management of a tropical marine ecosystem [58] . More recently, a trophic ecosystem model constructed by Ecopath with Ecosim is linked to a value chain approach in which the flows (amounts, revenue, and cost) of fish product are explicitly tracked from the ecosystem level through the consumer level [59] .
In this paper, the Ew Emodel is only used in the biomass dynamic of the ECOST model. Further combinations of the ECOST model and the EwE model hold great promise in future fishing policy evaluations especially for optimizing the ecosystem impacts and economic and social benefits of these policies.
6. Conclusions
The PRE is regarded as one of the most important ecosystems in China’s coastal sea, as it provides high biological productivity and sustains important commercial fisheries for the Pearl River Delta (PRD). The fishing industry in the PRD is previously the top primary production sector but now represents only 1.4% of the area’s Gross Domestic product (GDP). However, the status of fishery resources and ecosystem structure in the PRD has changed substantially due to overexploitation. As the contradictions between the economy, society, resources and environment become gradually apparent, it is necessary to develop an integrated method to evaluate the total societal costs and benefits of policy decisions. When fishery managers attempt to reduce fishing effort substantially, economic forces often lead participants in the fishery to resist. Decreased fishing levels would lead to reductions in the fishermen’s earnings and welfare. This paper provides an ecological-economic model of the fishery for important commercial fishes in the Pearl River that is compatible with the ecosystem models currently used to produce management advice. An integrated model ECOST is developed by merging a Social Accounting Matrix (SAM) of PRD economy with an ecological model of the PRD coastal ecosystem. It thus bridges the gap between economic and biological models. Based on the Pearl River Delta 2004 fisheries SAM table, we have estimated the costs and benefits to economic, ecological and social systems. An accounting framework is developed for evaluating the contribution of environmental assets to the overall economy. The costs and benefits are compared among different métiers, leading to the conclusion that management and conservation can be improved by adjusting fishing efforts.
Our results indicate that total societal net benefits from the fishery could increase by up to 33% through reallocation of the fishery harvest. A possible consequence of restricting the fishery would be that part of the labor and capital currently engaged in the pair and stern trawling and gill net fisheries would move to coastal shrimp trawling fishery. Furthermore, the substantial increase in the recreational catch would likely create new employment opportunities in providing services for recreational fisheries. Through shifts in labor force part of the increased social net benefits generated by the optimal policy could be directed to those currently participating in the trawling fisheries.
Multi-objective management remains a great challenge for fisheries management and decision-making, as conflicts between socioeconomic and ecological goals always exist. We believe that the integrated ECOST model provides a useful approach to quantify the trade-offs between ecological and socioeconomic systems. In addition, the findings in this study are applicable to other marine ecosystems.
Acknowledgements
This study is conducted under the project “An ecological computable general equilibrium (ECGE) model for marine fishery management: Linking ecosystem and socio-economic system” is supported by National Natural Science Foundation of China (Contract No. 71303220), the project “Ecosystems, Societies, Consilience, Precautionary principle: Development of an assessment method of the societal costs for best fishing practices and efficient public policies” is funded by the EU Sixth Framework Program (Contract No. 003711), Foundation of Applied Economics Base for Humanities & Social Science in Zhejiang Province (Grant No. 2014YJZD09) and Science Foundation of Zhejiang Sci-Tech University (ZSTU) (Grant No. 13092180-Y).
Cite this paper
YingWang,HaoranPan,ShiyuLi,PierreFailler, (2015) An Integrated Socio-Economic and Ecological Framework for Evaluating the Societal Costs and Benefits of Fishing Activities in the Pearl River Delta. Open Journal of Marine Science,05,477-497. doi: 10.4236/ojms.2015.54038
References
- 1. Duan, L.J., Li, S.Y., Liu, Y., Jiang, T. and Failler, P. (2009) A Trophic Model of the Pearl River Delta Coastal Ecosystem. Ocean & Coastal Management, 52, 359-367.
http://dx.doi.org/10.1016/j.ocecoaman.2009.04.005 - 2. Duan, L.J., Li, S.Y., Liu, Y., Moreau, J. and Christensen, V. (2009) Modeling Changes in the Coastal Ecosystem of the Pearl River Estuary from 1981 to 1998. Ecological Modelling, 220, 2802-2818.
http://dx.doi.org/10.1016/j.ecolmodel.2009.07.016 - 3. Wang, Y., Li, S.Y., Duan, L.J. and Liu, Y. (2012) Fishery Policy Exploration in the Pearl River Estuary Based on an Ecosim Model. Ecological Modelling, 230, 34-43.
http://dx.doi.org/10.1016/j.ecolmodel.2012.01.017 - 4. Wang, Y., et al. (2015) Modeling the Effect of the Seasonal Fishing Moratorium on the Pearl River Estuary Using Ecosystem Simulation. Ecological Modelling, 312, 406-416.
http://dx.doi.org/10.1016/j.ecolmodel.2015.06.011 - 5. Yu, H.G. and Yu, Y.J. (2008) Fishing Capacity Management in China: Theoretic and Practical Perspectives. Marine Policy, 32, 351-359. http://dx.doi.org/10.1016/j.marpol.2007.07.004
- 6. Ommer, R.E., et al. (2012) Social-Ecological Dynamism, Knowledge, and Sustainable Coastal Marine Fisheries. Current Opinion in Environmental Sustainability, 4, 316-322.
http://dx.doi.org/10.1016/j.cosust.2012.05.010 - 7. Kittinger, J.N., Finkbeiner, E.M., Ban, N.C., Broad, K., Carr, M.H., Cinner, J.E., Gelcich, S., Cornwell, M.L., Koehn, Z.J., Basurto, X., Fujita, R., Caldwell, M.R. and Crowder, L.B. (2013) Emerging Frontiers in Social-Ecological Systems Research for Sustainability of Small-Scale Fisheries. Current Opinion in Environmental Sustainability, 5, 352-357. http://dx.doi.org/10.1016/j.cosust.2013.06.008
- 8. Gordon, H.S. (1954) The Economic Theory of a Common-Property Resource: The Fishery. Journal of Political Economy, 62, 124-142. http://dx.doi.org/10.1086/257497
- 9. Schaefer, M.B. (1957) Some Considerations of Population Dynamics and Economics in Relation to the Management of Marine Fisheries. Journal of Fisheries Research Board of Canada, 14, 669-681.
http://dx.doi.org/10.1139/f57-025 - 10. Clark, C.W. (1976) Mathematical Bioeconomics: The Optimal Management of Renewable Resources. Wiley, New York.
- 11. Worm, B., Hilborn, R., Baum, K.J., Branch, T.A., Collie, J.S., Costello, C., Fogarty, M.J., Fulton, E.A., Hutchings, J.A., Jennings, S., Jensen, O.P., Lotze, H.K., Mace, P.M., McClanahan, T.R., Minto, C., Palumbi, S.R., Parma, A.M., Ricard, D., Rosenberg, A.A., Watson, R. and Zeller, D. (2009) Rebuilding Global Fisheries. Science, 325, 578-585. http://dx.doi.org/10.1126/science.1173146
- 12. Andrews, M. and Rossi, D. (1986) The Economic Impacts of Commercial Fisheries and Marine Related Activities: A Critical Review of Northeastern Input-Output Studies. Coastal Zone Management Journal, 13, 335-367. http://dx.doi.org/10.1080/08920758609361987
- 13. Steinback, S. (1999) Regional Economic Impact Assessments of Recreational Fisheries: An Application of the IMPLAN Modeling System to Marine Party and Charter Boat Fishing in Maine. North American Journal of Fishery Management, 19, 725-736.
http://dx.doi.org/10.1577/1548-8675(1999)019<0724:REIAOR>2.0.CO;2 - 14. Leung, P. and Pooley, S. (2002) Regional Economic Impacts of Reductions in Fisheries Production: A Supply-Driven Approach. Marine Resource Economics, 16, 251-262.
- 15. Cai, J.N., Leung, P.S., Pan, M.L. and Pooley, S. (2005) Economic Linkage Impacts of Hawaii’s Long Line Fishing Regulations. Fisheries Research, 74, 232-242. http://dx.doi.org/10.1016/j.fishres.2005.02.006
- 16. Kwaka, S.J., Yoob, S.H. and Changa, J.I. (2005) The Role of the Maritime Industry in the Korean National Economy: An Input-Output Analysis. Marine Policy, 29, 371-383.
http://dx.doi.org/10.1016/j.marpol.2004.06.004 - 17. Lee, M.K. and Yoo, S.H. (2014) The Role of the Capture Fisheries and Aquaculture Sectors in the Korean National Economy: An Input-Output Analysis. Marine Policy, 44, 448-456.
http://dx.doi.org/10.1016/j.marpol.2013.10.014 - 18. Seung, C. and Waters, E. (2006) A Review of Regional Economic Models for Fisheries Management in the U.S. Marine Resource Economics, 21, 101-124.
- 19. Seung, C. and Waters, E. (2006) The Role of the Alaska Seafood Industry: A Social Accounting Matrix (SAM) Model Approach to Economic Base Analysis. The Annals of Regional Science, 40, 335-350. http://dx.doi.org/10.1007/s00168-005-0048-0
- 20. Fernandez-Macho, J., Gallastegui, C. and Gonzalez, P. (2008) Economic impacts of TAC Regulation: A Supply-Driven SAM Approach. Fisheries Research, 90, 225-234.
http://dx.doi.org/10.1016/j.fishres.2007.10.019 - 21. Seung, C. and Waters, E. (2009) Measuring the Economic Linkage of Alaska Fisheries: A Supply-Driven Social Accounting Matrix (SDSAM) Approach. Fisheries Research, 97, 17-23.
http://dx.doi.org/10.1016/j.fishres.2008.12.013 - 22. Arita, S., et al. (2014) The Distributive Economic Impacts of Hawaii’s Commercial Fishery: A SAM Analysis. Fisheries Research, 145, 82-89. http://dx.doi.org/10.1016/j.fishres.2013.02.005
- 23. Pikitch, E.K., Santora, C., Babcock, E.A., Bakun, A., Bonfil, R., Conover, D.O., Dayton, P., Doukakis, P., Fluharty, D., Heneman, B., Houde, E.D., Link. J., Livingston, P.A., Mangel, M., McAllister, M.K., Pope, J. and Sainsbury, K.J. (2004) Ecosystem-Based Fishery Management. Science, 305, 346-347.
http://dx.doi.org/10.1126/science.1098222 - 24. Jin, D., Hoagland, P. and Dalton, T.M. (2003) Linking Economic and Ecological Models for a Marine Ecosystem. Ecological Economics, 46, 367-385. http://dx.doi.org/10.1016/j.ecolecon.2003.06.001
- 25. Finnoff, D. and Tschirhart, J. (2003) Harvesting in an Eight-Species Ecosystem. Journal of Environmental Economics and Management, 45, 589-611. http://dx.doi.org/10.1016/S0095-0696(02)00025-6
- 26. Finnoff, D. and Tschirhart, J. (2008) Linking Dynamic Economic and Ecological General Equilibrium Models. Resource and Energy Economics, 30, 91-114. http://dx.doi.org/10.1016/j.reseneeco.2007.08.005
- 27. Jin, D., et al. (2012) Development of an Integrated Economic and Ecological Framework for Ecosystem-Based Fisheries Management in New England. Progress in Oceanography, 102, 93-101.
http://dx.doi.org/10.1016/j.pocean.2012.03.007 - 28. Failler, P. and Pan, H.R. (2007) Global Value, Full Value and Societal Costs: Capturing the True Cost of Destroying Marine Ecosystems. Social Science Information, 46, 109-134.
http://dx.doi.org/10.1177/0539018407073660 - 29. Qiu, Y.S., Zeng, X.G., Chen, T., Wang, Y.Z. and Yuan, W.W. (2008) Fisheries Resource and Fisheries Management in South China Sea. Beijing Press, Beijing.
- 30. Li, Y.Z., Chen, G.B. and Sun, D.R. (2000) Analysis of the Composition of Fishes in the Pearl River Estuarine Waters. Journal of Fisheries of China, 24, 312-317.
- 31. Xue, G.F. (2004) China’s Response to International Fisheries Law and Policy: National Action and Regional Cooperation, Centre for Maritime Policy. University of Wollongong, Wollongong.
- 32. Zhong, Y. and Power, G. (1997) Fisheries in China: Progress, Problems, and Prospects. Canadian Journal of Fisheries and Aquatic Sciences, 54, 224-238. http://dx.doi.org/10.1139/f96-265
- 33. Plagányi, é.E. (2007) Models for an Ecosystem Approach to Fisheries. FAO Fisheries Technical Paper, No. 477, FAO, Rome.
- 34. Pan, H.R. (2009) The ECOST Model: An Integration of Social, Economic and Ecological Systems for Fisheries. http://www.ird.fr/ecostproject/doku.php?id=wp_5_production_of_ecost_model_9_months
- 35. Christensen, V., Walters, C.J. and Pauly, D. (2005) Ecopath with Ecosim: A User’s Guide. Fisheries Centre, University of British Columbia, Vancouver.
- 36. Christensen, V. and Pauly, D. (1992) ECOPATH II: A Software for Balancing Steady-State Ecosystem Models and Calculating Network Characteristics. Ecological Modelling, 61, 169-185.
http://dx.doi.org/10.1016/0304-3800(92)90016-8 - 37. Jia, X.P., Li, C.H. and Qiu, Y.S. (2005) Survey and Evaluation of Guangdong Marine Fishery Resources and the Measures for Sustainable Utilization. Chinese Ocean Press, Beijing.
- 38. Farber, S., Costanza, R., Childers, D.L., Erickson, J., Gross, K., Grove, M., Hopkinson, C.S., Kahn, J., Pincetl, S., Troy, A., Warren, P. and Wilson, M. (2006) Linking Ecology and Economics for Ecosystem Management. BioScience, 56, 121-133.
http://dx.doi.org/10.1641/0006-3568(2006)056[0121:LEAEFE]2.0.CO;2 - 39. Pauly, D. (1988) Some Definitions of Overfishing Relevant to Coastal Zone Management in Southeast Asia. Tropical coastal Area Management, 3, 14-15.
- 40. Murawski, S.A. (2000) Definitions of Overfishing from an Ecosystem Perspective. ICES Journal of Marine Science, 57, 649-658. http://dx.doi.org/10.1006/jmsc.2000.0738
- 41. Srinivasan, U.T., Cheung, W.W.L., Watson, R. and Sumaila, U.R. (2010) Food Security Implications of Global Marine Catch Losses Due to Overfishing. Journal of Bioeconomics, 12, 183-200.
http://dx.doi.org/10.1007/s10818-010-9090-9 - 42. Mace, P.M. (2001) A New Role for MSY in Single-Species and Ecosystem Approaches to Fisheries Stock Assessment and Management. Fish and Fisheries, 2, 2-32.
http://dx.doi.org/10.1046/j.1467-2979.2001.00033.x - 43. Walters, C.J., Christensen, V., Martell, S.J. and Kitchell, J.F. (2005) Possible Ecosystem Impacts of Applying MSY Policies from Single-Species Assessment. ICES Journal of Marine Science, 62, 558-568. http://dx.doi.org/10.1016/j.icesjms.2004.12.005
- 44. Liu, Y.J., Sumaila, U.R. and Volpe, J.P. (2011) Potential Ecological and Economic Impacts of Sea Lice from Farmed Salmon on Wild Salmon Fisheries. Ecological Economics, 70, 1746-1755.
http://dx.doi.org/10.1016/j.ecolecon.2011.04.017 - 45. Gourguet, S., Macher, C., Doyen, L., Thébaud, O., Bertignac, M. and Guyader, O. (2013) Managing Mixed Fisheries for Bio-Economic Viability. Fisheries Research, 140, 46-62.
http://dx.doi.org/10.1016/j.fishres.2012.12.005 - 46. Millennium Ecosystem Assessment (2003) Ecosystems and Human Well-Being: A Framework for Assessment. Island Press, Washington DC.
- 47. Millennium Ecosystem Assessment (2005) Ecosystems and Human Well-Being: Synthesis. Island Press, Washington DC.
- 48. Teh, L.S.L., Teh, L.C.L. and Sumaila, U.R. (2011) Quantifying the Overlooked Socio-Economic Contribution of Small-Scale Fisheries in Sabah, Malaysia. Fisheries Research, 110, 450-458.
http://dx.doi.org/10.1016/j.fishres.2011.06.001 - 49. Crilly, R. and Esteban, A. (2013) Small versus Large-Scale, Multi-Fleet Fisheries: The Case for Economic, Social and Environmental Access Criteria in European Fisheries. Marine Policy, 37, 20-27.
http://dx.doi.org/10.1016/j.marpol.2012.04.018 - 50. Cheung, W.W.L. and Sadovy, Y. (2004) Retrospective Evaluation of Data-Limited Fisheries: A Case from Hong Kong. Reviews of Fish Biology and Fisheries, 14, 181-206.
http://dx.doi.org/10.1007/s11160-004-5422-y - 51. Cheung, W.W.L. and Pitcher, T.J. (2006) Designing Fisheries Management Policies That Conserve Marine Species Diversity in the Northern South China Sea. In: Kruse, G.H., Gallucci, D.E., Hay, R.I., Perry, R.I., Peterman, R.M., Shirley, T.C., Spencer, P.D., Wilson, B. and Woodby, D., Eds., Fisheries Assessment and Management in Data-Limited Situations, Alaska Sea Grant College Program, University of Alaska Fairbanks, Alaska, 439-466.
- 52. Zivin, J.G. (2013) Vessel Buybacks in Fisheries: The Role of Auction and Financing Structures. ISSF Technical Report International Seafood Sustainability Foundation, Washington DC.
- 53. Squires, D. (2010) Fisheries Buybacks: A Review and Guidelines. Fish and Fisheries, 11, 366-387.
http://dx.doi.org/10.1111/j.1467-2979.2010.00365.x - 54. Pauly, D. and Christensen, V. (1993) Stratified Models of Large Marine Ecosystems: A General Approach and an Application to the South China Sea. In: Sherman, K., Alexander, L.M. and Gold, B.D., Eds., Large Marine Ecosystems: Stress, Mitigation, and Sustainability, American Association for the Advancement of Science, Washington DC, 148-174.
- 55. Heymans, J.J., Sumaila, U.R. and Christensen, V. (2009) Policy Options for the Northern Benguela Ecosystem Using a Multispecies, Multifleet Ecosystem Model. Progress in Oceanography, 83, 417-425. http://dx.doi.org/10.1016/j.pocean.2009.07.013
- 56. Lu, H.-J. and Lee, H.-L. (2014) Changes in the Fish Species Composition in the Coastal Zones of the Kuroshio Current and China Coastal Current during Periods of Climate Change: Observations from the Set-Net Fishery (1993-2011). Fisheries Research, 155, 103-113.
http://dx.doi.org/10.1016/j.fishres.2014.02.032 - 57. Qiu, Y.S., Lin, Z.J. and Wang, Y.Z. (2010) Responses of Fish Production to Fishing and Climate Variability in the Northern South China Sea. Progress in Oceanography, 85, 197-212.
http://dx.doi.org/10.1016/j.pocean.2010.02.011 - 58. Cheung, W.W.L. and Sumaila, U.R. (2008) Trade-Offs between Conservation and Socio-Economic Objective in Managing a Tropical Marine Ecosystem. Ecological Economics, 66, 193-210.
http://dx.doi.org/10.1016/j.ecolecon.2007.09.001 - 59. Christensen, V., Steinback, J. and Failler, P. (2011) A Combined Ecosystem and Value Chain Modeling Approach for Evaluating Societal Cost and Benefit of Fishing. Ecological Modelling, 222, 857-864.
http://dx.doi.org/10.1016/j.ecolmodel.2010.09.030
NOTES

*Corresponding author.