Open Journal of Marine Science
Vol.4 No.2(2014), Article ID:45121,11 pages DOI:10.4236/ojms.2014.42014
Detecting Oil Spill Contamination Using Airborne Hyperspectral Data in the River Nile, Egypt
Islam Abou El-Magd*, Sameh El Kafrawy, Islam Farag
National Authority for Remote Sensing and Space Sciences (NARSS), Cairo, Egypt
Email: *imagd@narss.sci.eg
Copyright © 2014 by authors and Scientific Research Publishing Inc.
This work is licensed under the Creative Commons Attribution International License (CC BY).
http://creativecommons.org/licenses/by/4.0/


Received 10 January 2014; revised 9 March 2014; accepted 21 March 2014
ABSTRACT
Egypt is a highly populated country of about 85 million inhabitants that are concentrated on the Nile Delta and on the flood plain of the Nile River. More than 90% of this population relies on the Nile River in their water demand for domestic use. Currently, Egypt is facing a problem with the trans-boundary water budget coming from the Nile basin. This urges for managing the water quantity and quality to secure the water needs. This paper discusses the potential use of airborne hyperspectral data for water quality management in the form of detecting the oil contamination in the Nile River in integration with in-situ measurements including ASD spectroradiometer and eco-sounder multi-probe devices. The eco-sounder multi-probe device measured most of the water quality parameters and detected the existence of oil contamination at 1200 bb downstream of the study area. The airborne hyperspectral images were analyzed and calibrated with the spectral library determined from the in-situ spectroradiometer to map the patches of the oil contamination. The details of the findings and learning lessons are fully discussed in the paper.
Keywords
Oil Slicks; Remote Sensing; Hyperspectral Data; Image Processing; River Nile

1. Introduction
The Nile River is the main source of fresh water resources in Egypt for domestic use and agricultural purposes [1] . The Egyptian water budget is limited to 55 billion m3 from the transboundary Nile River water course. Egypt is currently facing the problem of water shortage due to the development of some mega projects on the catchment of the Nile River, which consequently created some political conflicts on the Egyptian transboundary water budget. This might create a future threat on the population [2] . Therefore, there is a need to manage the quantity and quality of the water resources to secure the population needs.
Important issue is the water quality such as the flush of agricultural wastes and human wastes and unforeseeable pollution crisis. Generally, the water quality of the Nile River, including the delta, is fragmentary and there is an absence of long-term data that could be used to establish trends. For example, in the industrial estates of Cairo suburbs, Helwan and Alexandria, oil spills are frequent due to river-navigation accidents [3] . Recently in November 2012, an accident of oil contamination from unknown source discharged a huge quantity of hydrocarbons to the Nile River. Unfortunately, this is the case, where unknown source of nearly 10 tons of oil hydrocarbon discharged into the upstream of the Nile River within the Egyptian Territory. The treatment plants for drinking water are taking the water from the River Nile; this, indeed, made a serious national worry about the health of the people. This kind of pollution will probably create a major damage to the aquatic environment and the people’s health, which requires an urgent response from the government to a) determine the size and expansion of the oil slick; b) identify the point-source of this oil slick; and c) determine its environmental implications on the water quality. This requires an effective and synoptic tool to provide quick response to the decision makers that is not applicable using conventional methodologies. This challenged us for adopting the advanced remote sensing technology such as hyperspectral imaging that offer such capabilities for monitoring and mapping the contamination in a synoptic and comprehensive approach [4] .
New approaches and methodologies of remote sensing, including active and passive, are available for the detection and monitoring of environmental parameters, particularly oil slicks in the marine environment [5] [6] . However, radar sensors showed extensive applications in open marine pollution with oil slicks, there is a lack in this technology in developing countries and it is probably not applicable in small water mass. Recently, hyperspectral sensors have started to be used for oil slick monitoring purposes [7] . Key advantage of hyperspectral imaging is that it provides sufficient spectral information to identify and distinguish between spectrally similar objects. This is due to the fact that it measures the reflected solar signal at very narrow band width up to 5 or/and 10 μm with wide range from visible to the infrared electromagnetic radiation. This enables for the ability to make proper distinctions among materials with only subtle signature differences [8] [9] . Hyperspectral images show hence potentiality for proper discrimination of oil slicks from the surrounding environmental parameters.
The National Authority for Remote Sensing and Space Sciences (NARSS) has recently been equipped with airborne hyperspectral HySpex camera that is used to capture images for the Nile River in response to this accident of oil pollution. To precisely analyze, interpret and validate the airborne hyperspectral data, two types of in-situ measurements were carried out including 1) spectroradiometer and 2) eco-sounder of water quality parameters. This paper aims at testing the efficiency of detecting oil slick pollution and manages such environmental crisis using our resources of airborne hyperspectral camera and ASD spectroradiometer and multi-probe eco-sounder. It is anticipated that the outcomes of this research will be the baseline for crisis management in Egypt in similar environmental problems.
2. Area of Study
The area of study is part of the Nile River between 29˚55ꞌ to 30˚25ꞌN and 31˚10ꞌ to 31˚15ꞌE, which lies between Central Cairo and El-Hawamdya suburb area (few kilometers from the city of Cairo). This region of the Nile River is particularly investigated due to its closure to Cairo city and the existence of a water treatment station. The setup of sampling profile was for about 20 km length and about 10 sampling sites within the Nile River. Figure 1 shows the study area (left) and the in-situ sampling sites (right) that measured both spectral behave using the spectroradiometer and the water quality parameters using the eco-sounder multi-probe device.
3. Materials and Methods
3.1. Materials
For the purpose of mapping the oil slick contamination, a combination of airborne derived hyperspectral imaging and near-real time in-situ measurements, of hyperspectral signatures using the ASD spectroradiometer and the water quality parameters using the multi-probe eco-sounder devices, was used.
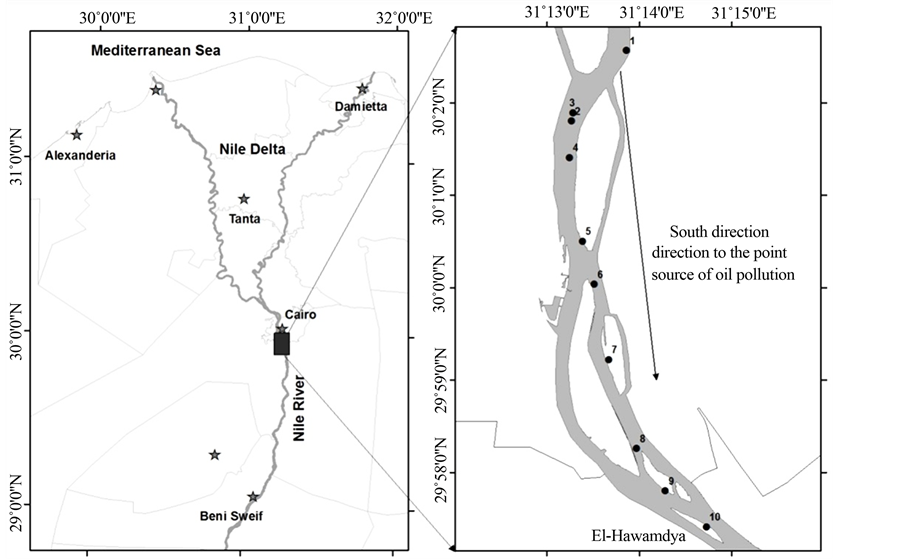
Figure 1. Area of study (left = over view of the area of study, right = sampling sites of the in-situ for the ASD spectroradiometer and eco-sounder multi-probe device for water quality.
3.1.1. Airborne Hyperspectral
Hyperspectral imaging is based on a highly advanced HySpex camera, which acquires the light intensity (radiance) for a large number of contiguous spectral bands (up to 270 channels). It is potentially capable to spectrally characterize objects at good level of accuracy. The HySpex camera was used in this study, which is capable for acquiring data from 400 nm to 2500 nm including a large portion of the infrared spectrum. The HySpex camera has largely been used for previous studies and has shown its usability to monitor water quality. The spectral line of HySpex camera comprises of VNIR model operating in the range from 400 to 1000 nm, and SWIR models operating in the range from 900 to 2500 nm. The altitude of the camera was 800 meter above sea level (ASL) and the Field of View was 16˚ for the VNIR and 13.5˚ for the SWIR, which provided spatial resolution of 35 cm for the VNIR and 70 cm for the SWIR images. For many applications such as the oil slick contamination the reflection and absorption properties in the infra-red (IR) bandwidth are essential to characterize, quantify or classify the objects in the scene.
The imaging system should have an IMU-GPS (Inertial Measurement Units) system for auto georeferencing of the images based on the continuous logging of the position and attitude data for the camera. Unfortunately, this system was not fully functioned during this flight, which generated arbitrary images that are not georeferenced to the real world coordinate.
3.1.2. In-Situ Spectroradiometer
The ASD spectroradiometer was used to measure the spectral characteristics of water and any other contaminants in the spectral range from 350 nm to 2500 nm. The technical specification of this device is shown in Table 1 below. It was planned for real time measurements at the same time of capturing the airborne hyperspectral imaging (Figure 2—Right) [10] ; but due to accessibility issues there was little time lap of about 6 - 8 hours.
3.1.3. In-Situ Water Quality–Eco-Sounder Device
Water Quality multi-probe device (Manta 2™) was used to measure directly some of the water quality parameters including temperature, turbidity, pH, Oxidation Reduction Potential, Conductivity, Crude Oil and Chlorophyll. The sensor has a built-in GPS system (Global Positioning System) that enables for obtaining the real
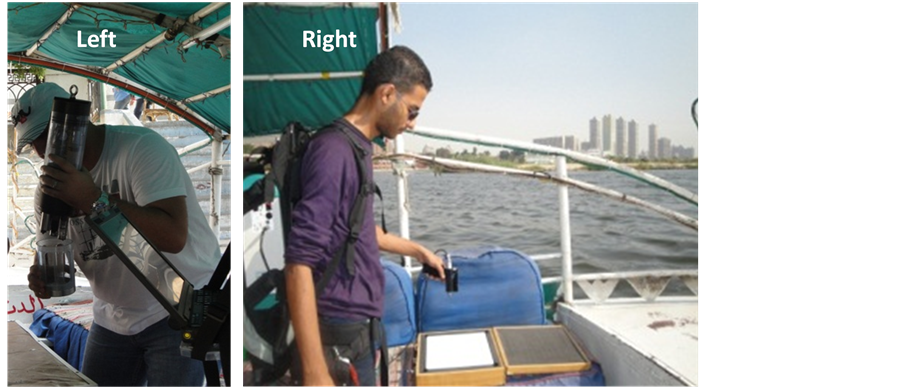
Figure 2. Field picture of the in-situ measurement devices (right = ASD spectroradiometer, left = eco-sounder multi-probe).

Table 1. Technical specifications of the ASD spectroradiometer.
geographic location for the sampling sites (Figure 2—Left). The device is designed to directly measure these parameters while it is in the water and directly store the results into the connected laptop. The advantage of the existence of the GPS system is that enabled for automatic transfer of the data into a GIS format for geographic information analysis.
3.2. Methodology
Unfortunately, it is discovered, during the flight, that the IMU system (Inertial Measurement Units) was not fully functioned, which resulted in the airborne hyperspectral images were not geometrically referenced. The attempts to rectify these images using GCPs or other sources of geographic coordinates failed due to a) the obliqueness of the images, and b) the GCPs that are not correctly aligned. Therefore, it was decided to use these hyperspectral images in an arbitrary manner to identifying the occurrence and the spatial extent of the oil contamination and more importantly not to waste the time and efforts spent on the airborne data. Besides there was an urgent need to provide response to the decision makers about the oil slick contamination.
Basic image processing techniques including filtering (e.g. convolution filters), enhancements (e.g. stretching) were used to discriminate the patches of the oil spill contaminations. This was based on the spectral absorption windows of oil slicks in the electromagnetic radiation and using the spectral signature taken by the spectroradiometer. A classification of the hyperspectral channels were carried out to extract and identify the oil spills.
4. Results
The interaction between the oil slick and the optical electromagnetic radiation is governed by the light transmission and reflection through the oil slick [11] . This light includes down-welling solar radiation and upwelling reflected light and scattered light from the underlying water and the oil itself. Four recognizable windows of absorption of electromagnetic radiation with oil contamination, which are 1) visible range from 400 - 800 μm; 2) near infrared range from 1100 μm to 1220 μm; 3) near infrared range from 1600 μm to 1760 μm; and 4) short wave infrared range from 2200 μm to 2350 μm [12] -[14] . Figure 3 shows the spectral response of the 10 in-situ sampling sites in the Nile River in correlation with the predefined four absorption windows.
Basically, in the visible spectrum range the optical behavior of oil is governed by the light transmission and reflection through the oil slick. Identification of the oil layer in contrast with the under-laying water is almost successful where sub-surface upwelling radiance is higher relative to specular sky radiance water reflection in the range of 480 - 570 nm [15] . However, thin layer of up to 10 μm generated a steeper fall off in the reflectance (i.e. great absorption) towards blue for spectra spanning from 470 to 800 nm [16] . This behavior of oil slick with optical radiation was clearly observed with the in-situ measurements in the range from 580 μm to 800 μm (Figure 4). The high absorption of this electromagnetic window increases downwards to the direction of the source of the oil contamination in the Nile River, which might indicate for increasing the thickness of the oil layer in the south direction to the point-source (Figure 4—Arrow Line).
The second absorption window is in the near infrared spectrum range, the appearance of the oil slick in this range is controlled by the carbon-hydrogen bond, which is clearly generate an absorption window in the range from 1190 nm to 1210 nm [11] [12] . Figure 5 shows the occurrence of an absorption window in the range from 1120 μm to 1160 μm. It is highly correlated with the previous findings by [12] , however there is minor shift of the spectral response. Since the controller in this electromagnetic radiation behave is the Carbon-Hydrogen bond, it might be the difference between the type of the crude oil, or its interaction with fresh water rather than sea water has created such shift of the absorption window. However, the spectral response maintained the same shape of fall down of reflectance (i.e. absorption window—Arrow Line).
The behavior of electromagnetic radiation with the oil contamination in the other ranges of the shortwave infrared was not almost clear and not corresponding to the exact central wavelength determined in earlier research by [13] . The spectral behave showed the occurrence of series of absorption windows in this spectrum range but not well centered and correlated with the previous research outcomes. However, the short wave infrared range showed clear absorptions with little shift of the central wavelengths. This shift might be due to a) the variability of the thickness of the oil layer, and b) the spectral behave of the oil layer within the aquatic fresh water environment that includes flora.
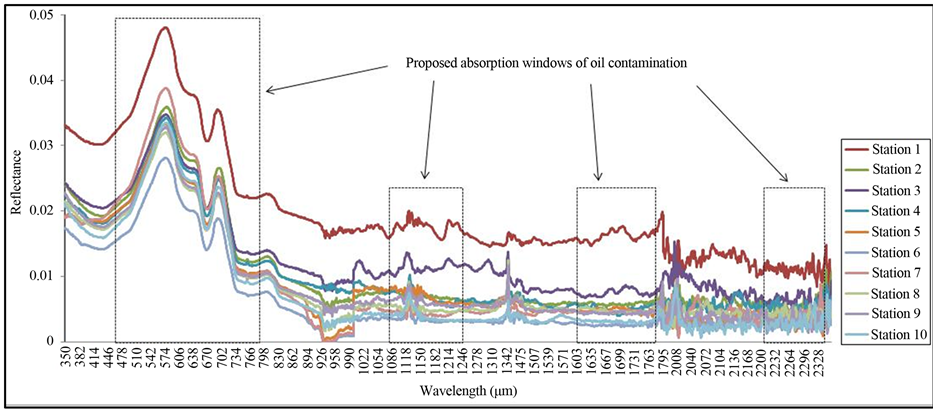
Figure 3. The ASD hyperspectral curve of the Nile River overlaid with the known four absorption windows of crude oil pollution.
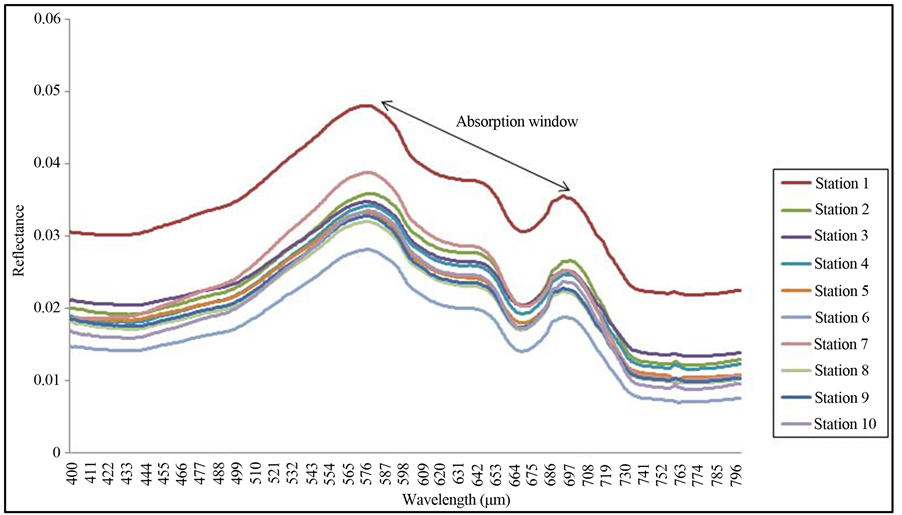
Figure 4. The reflectance of the ASD hyperspectral visible range from 480 - 800 nm in response to the oil contamination.
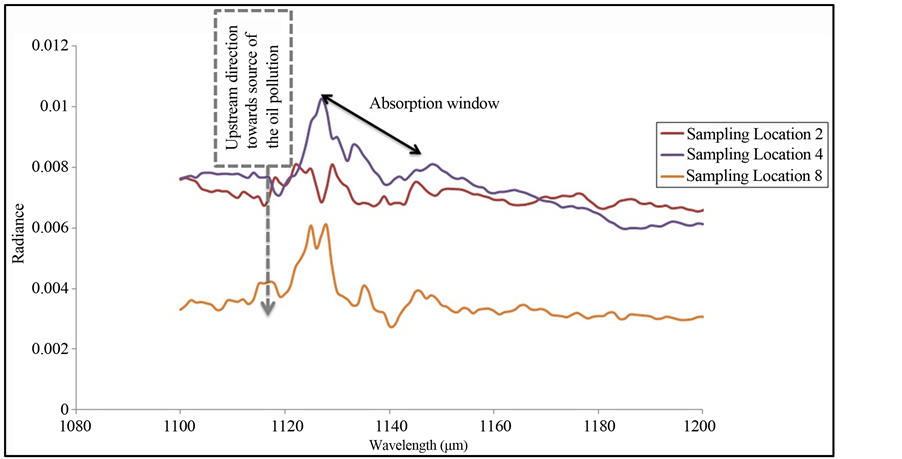
Figure 5. The reflectance of the ASD hyperspectral in the range from 1100 - 1160 nm in response to the oil contamination.
The ASD field spectroscopy showed considerable high absorption window in the range from 1120 to 1140 nm, which is more indicative for the presence of the oil hydrocarbons contamination. This was confirmed with the in-situ measurements, where scattered oil slicks in dark patches were recorded moving on the surface water of the Nile River. The longitudinal cross section of the in-situ measurements showed thicker oil slicks towards the upstream of the Nile River in the direction of the point-source of the oil hydrocarbons contamination. This was clearly recorded at El-Hawamdya station, which is getting closer to the source of the oil pollution (Figure 6).
However, the airborne images were not geometrically corrected due to the malfunction of the IMU system, they were used arbitrarily to determine the extension of the oil slicks and pathway. The most recognizable area for oil hydrocarbon contamination using the ASD in-situ spectroradiometer was at El-Hawamdya area (station
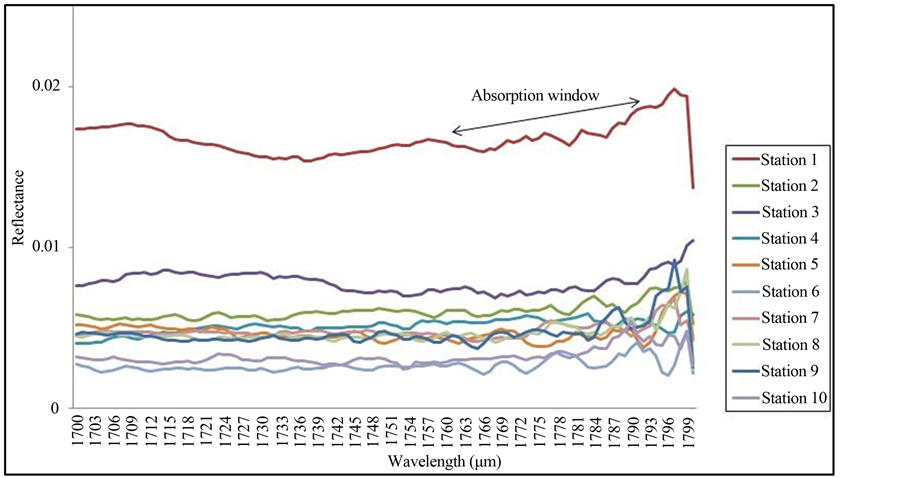
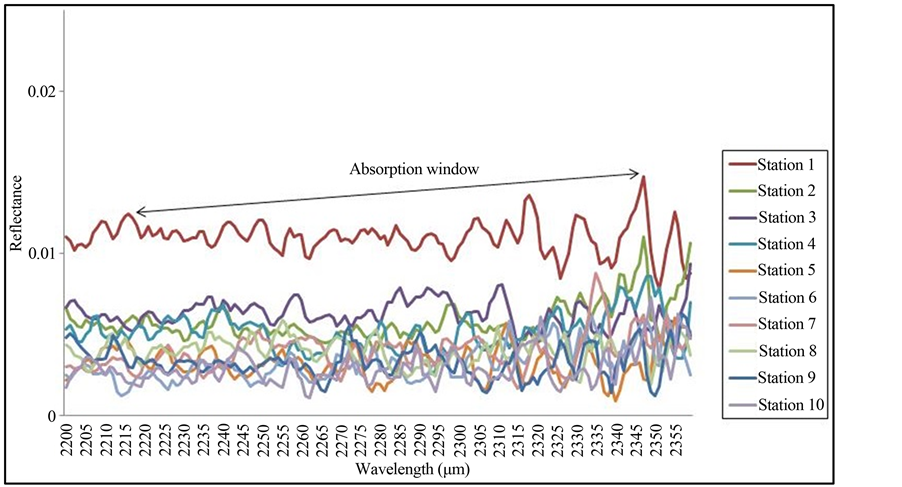
Figure 6. The reflectance of the ASD hyperspectral in the shortwave Infrared in response to the oil contamination.
10). This site was used to test the airborne images, the spectral analysis of the airborne hyperspectral image at this site showed a nearly similar behave to the obtained from the in-situ measurements. Figure 7 shows the spectral curve obtained from the hyperspectral image showing particular absorption windows at near infrared between 1000 and 1200 μm.
There were other absorption windows that are recorded at the shortwave infrared between 1550 and 1700 μm. However the shortwave infrared between 2000 and 2500 mm was showing some oscillation of the curve that looks like absorption windows but it could not precisely interpreted as a response to oil hydrocarbon contamination.
Applying the digital image processing of enhancement and classification on the airborne hyperspectral image at El-Hawamdyasite has clearly showed patches of oil slicks. Figure 8 shows an enhanced hyperspectral image for El-Hawamdya site, which clearly shows an oil contamination, patches outlined by yellow color lines and moving downstream to the north direction.
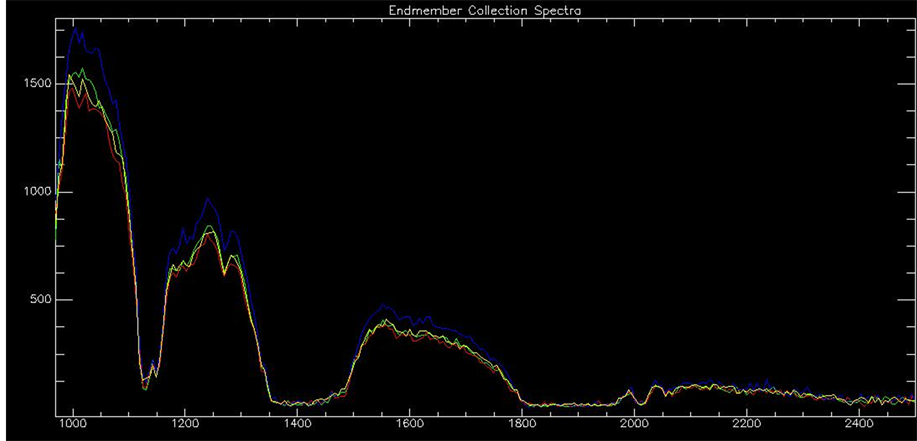
Figure 7. The reflectance of the airborne hyperspectral image at El-Hawamdya site.
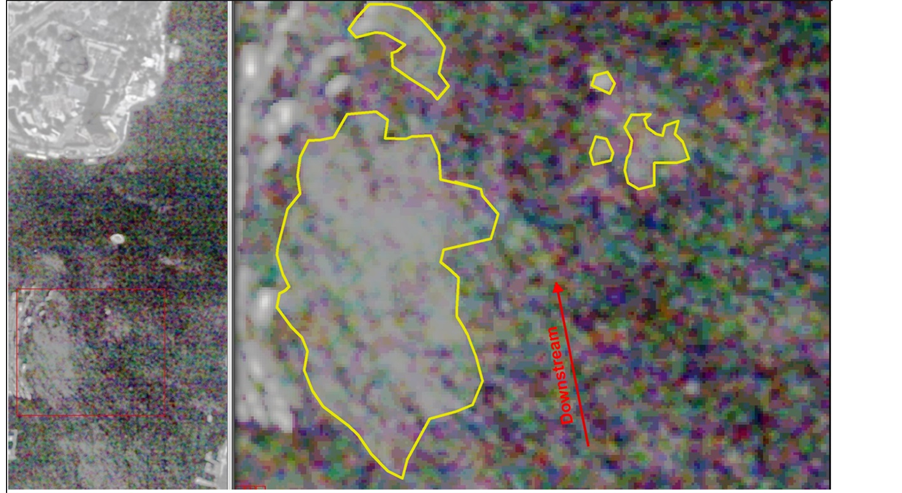
Figure 8. Enhanced airborne hyperspectral image showing the detected oil hydrocarbon contamination outlined in yellow color.
Finally, correlation between the two methodologies of hyperspectral measurements using the in-situ and the airborne were validated against the in-situ measurements of water quality using the eco-sounder multi-probe device. The correlation between the two types of in-situ measurements showed positive correlation between the absorption window of the spectroradiometer and the presence of oil slicks recorded by the eco-sounder. The increase of the oil slicks thickness, which supposed to be in the range of 10 - 50 μm, was in the direction of the point-source. In the same direction, the water quality device recorded an increase of the CO-rfu parameter, which is indicative for the occurrence of oil hydrocarbons contamination.
The rest of the measured water quality parameters including the conductivity or Raw Fluorescence Units (CO-rfu) and the Oxidation Reduction Potential (ORP) which recorded with high values are correlated with the occurrence of the oil contamination. Figure 9 shows the significant increase of the CO-rfu towards the upstream
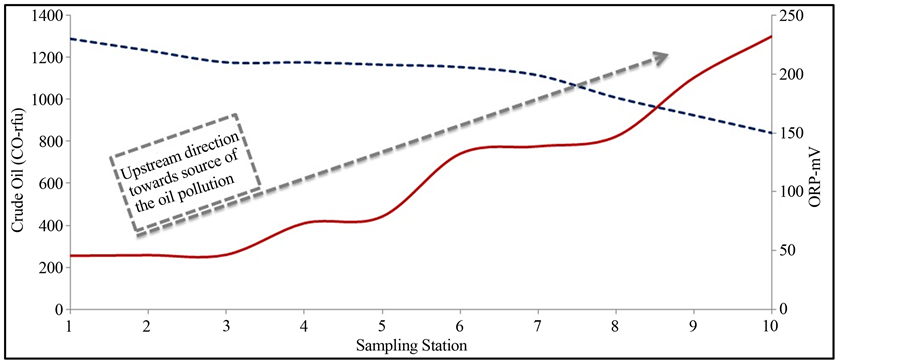
Figure 9. Curve of the in-situ measurements of CO-rfu and ORP using the eco-sounder multi-probe device.
(the direction to the point-source of the oil contamination); which significantly increased from 200 at station 1 (downstream) to 1300 at station 10 (upstream). Comparatively, the higher the CO-rfu the lower the ORP (oxidation reduction Potential); which is the case where there is a decrease of ORP from north to south in the direction to the point-source of oil hydrocarbon pollution [17] .
The longitudinal cross section of the in-situ water quality measurements indicated for a significant increase of the concentration of the CO-rfu downstream in the direction of the source of contamination from station 1 to 10. It is found that the ORP-mV parameter is showing concentration decrease compared to the CO-rfu in the same direction (i.e. in the direction to the point-source of the oil contamination). This is the typical negative correlation between ORP and CO-rfu. Indeed, this confirms and agrees with the spectral findings in the same direction of absorption windows related to oil hydrocarbons contamination.
5. Discussion and Conclusion
Oil slick contamination in fresh water supplies, such as the Nile River, is more dangerous on the domestic use of water creating health problem as well as other threats on the aquatic resources. It might also negatively impact the living organisms particularly the fish, which is one of the main resources for securing food in the country.
This research was in response to an incident of oil slick contamination in the Nile River, which is the main domestic water supply to the country. The research plan was to operationally manage the oil slick contamination using the airborne hyperspectral data and in-situ measurements of spectroradiometer and water quality ecosounder multi-probe devices. The main objective was to develop full synergy of these data sources to enable for synoptic and precise mapping of the contaminant and create possible action plan for mitigation measures. The outcomes of this research confirmed that the hyperspectral technology is very useful for detecting and mapping oil slick contamination, however, the planning was not as optimum as supposed to be in such or similar crisis management. Figure 10 shows the correlation between the hyperspectral response obtained from the airborne system and the same pixels obtained from the ASD spectroradiometer on-site. It shows linear positive correlation with r2 of 0.55, which is indicative of the conformity between the two systems. This provides a concept for future use of the in-situ spectroradiometer measurements as the spectral signature for the airborne system.
The use of water quality eco-sounder multi-probe was important to identify the relevant water quality parameters that are directly correlated with the spectral response of oil contaminations such as ORP. Since the aquatic fresh water of the River Nile is dominant by flora (halophytes) that probably create influence on the dispersion, patching or/and scattering of the oil contamination within the fresh water environment. This might not be the same as sea water, since the sea water is an open mass of water.
Continuous data acquisition is considered as an important factor for understanding the response from the Nile River surface water to different phenomena and frequent changes. The use of such in-situ spectroradiometer sensor in conjunction with the airborne hyperspectral imaging is becoming an efficient and reliable data source to detect and monitor oil slicks. The airborne hyperspectral imaging system is making potential use of larger incidents due to the advantages of obtaining larger area coverage and the efficiency of detecting and mapping the
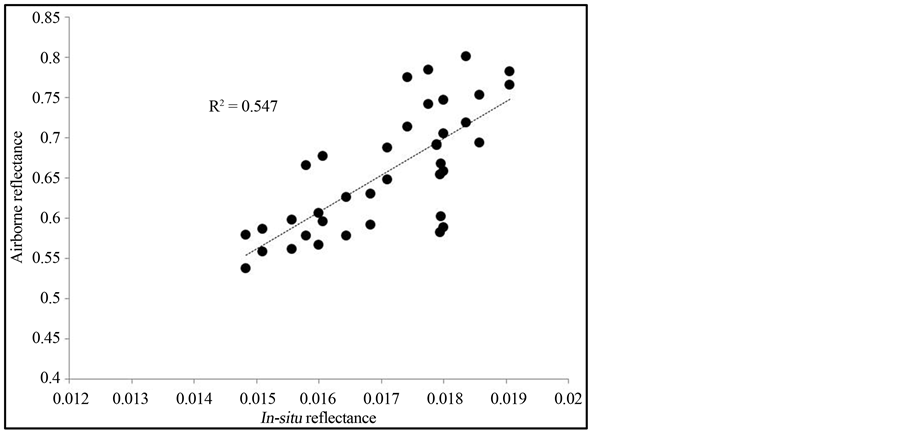
Figure 10. Correlation coefficient between the spectral reflectance obtained from both the airborne hyperspectral and the in-situ ASD spectroradiometer.
oil contamination slicks based on the absorption windows.
This is the first action plan to test and examine such advanced techniques in Egypt to manage pollution crisis, which created learning lessons and findings for future plans. The argument case here is that there was a failure to achieve full synergy between the airborne hyperspectral imaging system and the in-situ measurements that lead to the potential needs for:
• Full checkup of the airborne system before starting to fly over or implementation process
• Procuring more advanced planning package for flights to enable getting flight line as quickly as the crisis needs, which makes maneuver and saving time, effort and success of capturing the images
• Testing the IMU system for georeferencing the captured images to the real-state plan. This is an important step towards obtaining information for the right location to enable for the correct measures to mitigate the crisis.
Finally, in developing countries, there is a need for practicing more on the best fit scenario for crisis management and planning and interactive dealing with the crisis particularly the synergy between multi-sources of data in an urgent matter and short-time.
References
- Food and Agriculture Organization (2011) Information Products for Nile Basin Water Resources Management. Project GCP/INT/945/ITA 2004 to 2009, FAO, Rome. www.fao.org/nr/water/faonile
- Carroll, K. (2011) China Dams in Africa: A Case Study May 2011. Culture and Conflict Studies Program, China Studies Center. www.c4ads.org
- El-Sheekh, M. (2009) River Nile Pollutants and Their Effect on Life Forms and Water Quality. In: Dumont, H.J., Ed., The Nile: Origin, Environments, Limnology and Human Use, Series: Monographiae Biologicae, Vol. 89, Springer, Dordrecht, 395-406.
- Ramirez-Marquez, J.E. and Sauser, B.J. (2009) System Development Planning via System Maturity Optimization. IEEE Transactions on Engineering Management, 56, 533-548. http://dx.doi.org/10.1109/TEM.2009.2013830
- Brekke, C. and Solberg, A.H.S. (2005) Oil Spill Detection by Satellite Remote Sensing. Remote Sensing of Environment, 95, 1-13. http://dx.doi.org/10.1016/j.rse.2004.11.015
- Fingas, M.F. and Brown, C.E. (1997) Review of Oil Spill Remote Sensing. Spill Science & Technology Bulletin, 4, 199-208. http://dx.doi.org/10.1016/S1353-2561(98)00023-1
- Shen, S.S. and Lewis, P.E. (2011) Deepwater Horizon Oil Spill Monitoring Using Airborne Multispectral Infrared Imagery. SPIE, Orlando.
- Migliaccio, M., Gambardella, A. and Nunziata, F. (2009) The PALSAR Polarimetric Mode for Sea Oil Slick Observation. IEEE Transactions on Geosciences and Remote Sensing, 47, 4032-4041. http://dx.doi.org/10.1109/TGRS.2009.2028737
- Swayze, G.A., Furlong, E.T. and Livo, K.E. (2007) Mapping Pollution Plumes in Areas Impacted by Hurricane Katrina with Imaging Spectroscopy. Fall Meeting, H31L-07, American Geophysical Union, San Francisco.
- ASD (2008) Technical Manual of the ASD Spectroradiometer Device, USA, 106p. www.asd.com
- Clark, R.N. (1999) Spectroscopy of Rocks and Minerals, and Principles of Spectroscopy. In: Rencz, A.N., Ed., Manual of Remote Sensing, Remote Sensing for the Earth Sciences, John Wiley and Sons, New York, 3-58.
- Lammoglia, T. and De Souza Filho, C.R. (2011) Spectroscopic Characterization of Oils Yielded from Brazilian Offshore Basins: Potential Applications of Remote Sensing. Remote Sensing of Environment, 115, 2525-2535. http://dx.doi.org/10.1016/j.rse.2011.04.038
- Hörig, B., Kühn, F., Oschütz, F. and Lehmann, F. (2001) HyMap Hyperspectral Remote Sensing to Detect Hydrocarbons. International Journal of Remote Sensing, 22, 1413-1422. http://dx.doi.org/10.1080/01431160120909
- Kühn, F., Oppermann, K. and Hörig, B. (2004) Hydrocarbon Index an Algorithm for Hyperspectral Detection of Hydrocarbons. International Journal of Remote Sensing, 25, 2467-2473. http://dx.doi.org/10.1080/01431160310001642287
- Byfield, V. and Boxall, S.R. (1999) Thickness Estimates and Classification of Surface Oil Using Passive Sensing at Visible and Near-Infrared Wavelengths. IEEE 1999 International Geosciences and Remote Sensing Symposium, IGARSS '99 Proceedings, 3, 1475-1477.
- Wettle, M., Daniel, P.J., Logan, G.A. and Thankappan, M. (2009) Assessing the Effect of Hydrocarbon Oil Type and Thickness on a Remote Sensing Signal: A Sensitivity Study Based on the Optical Properties of Two Different Oil Types and the HYMAP and Quickbird Sensors. Remote Sensing of Environment, 113, 2000-2010. http://dx.doi.org/10.1016/j.rse.2009.05.010
NOTES

*Corresponding author.