Open Journal of Clinical Diagnostics
Vol.3 No.4(2013), Article ID:40284,12 pages DOI:10.4236/ojcd.2013.34034
Detection of plasmodium parasites from images of thin blood smears
![]()
1Meru University of Science and Technology, Meru, Kenya
2University of Nairobi, Nairobi, Kenya
3Chuka University, Chuka, Kenya
Email: gitonga30@yahoo.com
Copyright © 2013 Daniel Maitethia Memeu et al. This is an open access article distributed under the Creative Commons Attribution License, which permits unrestricted use, distribution, and reproduction in any medium, provided the original work is properly cited.
Received 15 October 2013; revised 15 November 2013; accepted 22 November 2013
Keywords: Mobidity; Mortality; Malaria; Classification Accuracy
ABSTRACT
Malaria is the leading cause of morbidity and mortality in tropical and subtropical countries. Conventional microscopy is the Gold standard in the diagnosis of the disease. However, it is prone to some shortcomings which include time consumption and difficultness in reproducing results. Alternative diagnosis techniques which yield superior results are quite expensive and hence inaccessible to developing countries where the disease is prevalent. Thus in this work, an accurate, speedy and affordable system of malaria detection using stained thin blood smear images was developed. The method uses Artificial Neural Network (ANN) to test for the presence of plasmodium parasites in thin blood smear images. Images of infected and non-infected erythrocytes were acquired, pre-processed, relevant features extracted from them and eventually diagnosis was made based on the features extracted from the images. Diagnosis entailed detection of plasmodium parasites. Classification accuracy of 95.0% in detection of infected erythrocyte was achieved with respect to results obtained by expert microscopists. The study revealed that artificial neural network (ANN) classifiers trained with colour features of infected stained thin blood smear images are suitable for detection. It was further shown that ANN classifiers can be trained to perform image segmentation.
1. INTRODUCTION
Malaria is a common but serious protozoan disease caused by peripheral blood, spleen or liver parasites of the genus Plasmodium. It is estimated that approximately 781,000 people of the 225 million people infected worldwide by the disease succumb to this menace annually [1]. Majority of these deaths are children from sub-Saharan Africa [2]. The disease causes a heavy economic burden to those affected in terms of the costs incurred to treat the disease and absenteeism from work and school. The key to effective management of malaria lies in prompt and accurate diagnosis of the disease.
Several methods exist for malaria diagnosis. These methods can be classified into two, based on their cost and performance. These are the high cost methods and low cost methods. Polymerase Chain Reaction (PCR)- based techniques that detect specific nucleic acid sequences [3] and Third Harmonic Generation (THG) imaging of emission from the Hemozoin using infrared ultrafast pulsed laser excitation [4], belong to the class of high cost methods. Studies have shown that these techniques can yield high sensitivity and specificity to malaria diagnosis. However, they are rarely used in developing countries where the disease is endemic because of the high cost, specialized infrastructure needs and handling difficulties. Rapid Diagnostic Test (RDTs) which detects specific antigens derived from malaria parasites in lysed blood [5] and conventional microscopy [6,7] belong to the low cost class. RDTs are relatively fast in malaria diagnosis and can be administered by unskilled personnel. However, their results can be unreliable [7]. Besides, commercially available RDT kits are specific to single species of plasmodium parasites and in cases where mixed infection is suspected, all the four kits should be used. This makes the technique relatively expensive. Conventional microscopy is the gold standard method of malaria diagnosis. The technique can be used to detect, and differentiate between different life stages and species of plasmodium parasites. The most serious limitation of this technique is time consuming. Besides, the results obtained are difficult to reproduce.
From the above discussion of malaria diagnosis methods, it can be deduced that the more sophisticated the technique is, the more reliable the result of the diagnosis. However sophisticated techniques are expensive and unaffordable in places where malaria is a serious problem. On the other hand, less sophisticated techniques are affordable but their results are not always reliable. Low cost malaria diagnosis techniques can be improved by incorporating some processing component in their outputs. As a result we can devise a new framework of classifying malaria diagnosis techniques based on the complexity involved in detection and processing. This scheme would therefore yield four classes of diagnosis techniques. These classes are summarized in the Table 1.
From Table 1 below, the ideal diagnosis technique would be that from class A. However, no such technique has yet been developed whose results are within reasonable degree of accuracy. Class D is the least desirable category as it would call for expensive detection and processing schemes. This would translate to high cost of installation, operating and high skilled personnel requirement besides being time consuming. This leaves us with class B and C as our methods of choice. Most conventional diagnosis techniques would fall in class C, where effort is placed in detection and very little processing if any is carried out. As a result of the sophisticated apparatus required, the process ends up being expensive and sometimes out of reach. Class B calls for simple detection scheme and complex processing algorithms. Simple detection and complex processing is feasible since the semiconductor industry has made tremendous improvements in fabrication of low cost and high speed computer processors.
In this work, a class B scheme of malaria diagnosis was explored. An automatic method of detecting plasmodium parasites was investigated. Image processing and machine learning techniques were utilized to solve this problem. The ultimate goal of the study was to develop a fast, accurate and affordable technique for malaria diagnosis using images of stained thin blood smears. Stained blood smear images were acquired and preprocessed. Relevant features were then extracted and classified using neural network classifiers.
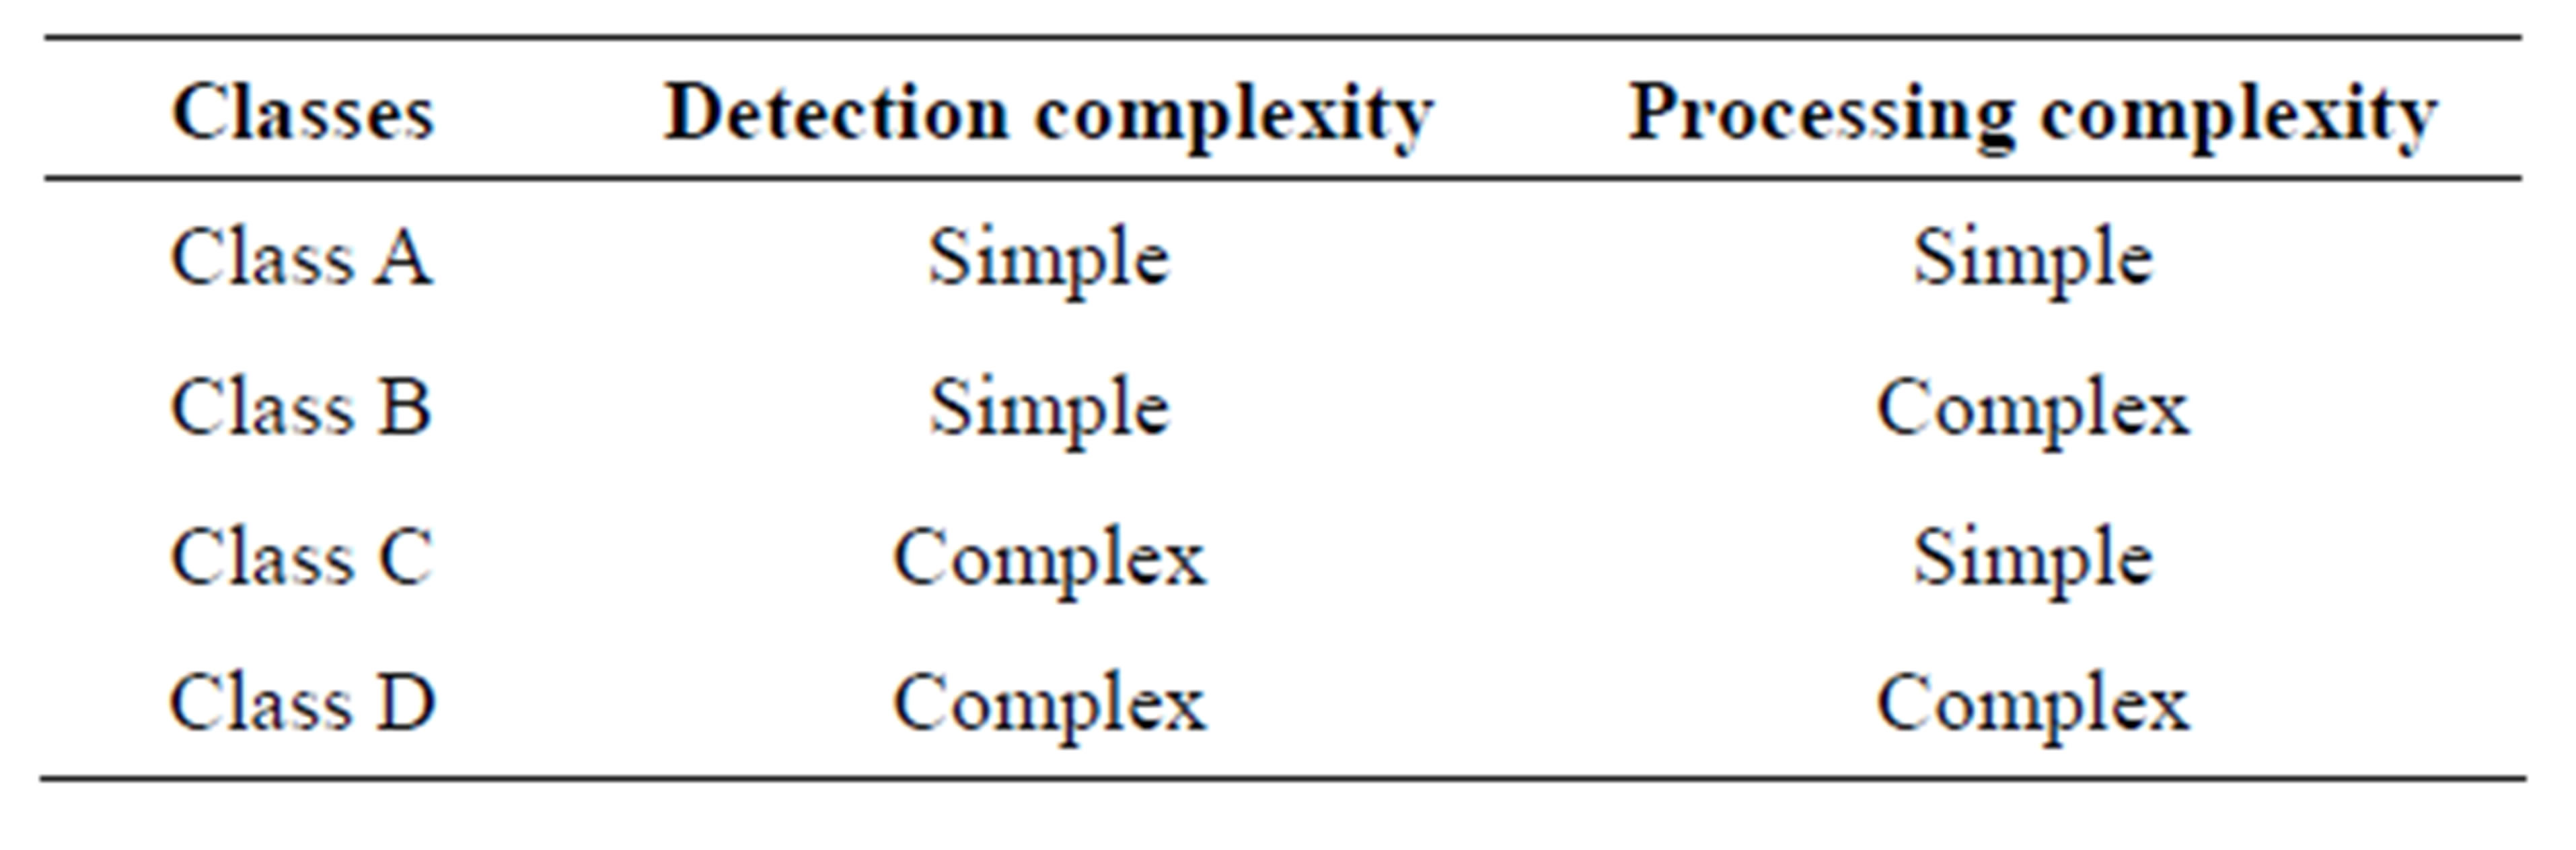
Table 1. Malaria diagnosis classification schemes.
2. RELATED WORK
A number of studies on the possibility of detecting plasmodium parasites using images of thin blood smear have been done in the past. In this section a number of these studies are reviewed.
Ross et al., [8] proposed a technique for automating malaria diagnosis using light microscopy. Here, a light microscope fitted with a digital camera was used to capture image of Giemsa stained blood slides. After images were captured they were loaded to a Personal Computer (PC) for processing. Image processing techniques and neural network classifiers were used. Infected erythrocytes were positively identified with a sensitivity of 81% while the accuracy for species determination was 73%. Morphological image processing techniques used for erythrocyte segmentation could not produce satisfactory results for erythrocytes which are heavily clustered [9]. The sizes of erythrocytes were determined using granulometry with circular structuring element (SE). The assumption was erythrocyte shapes are circular. This is not always the case. Sometimes erythrocytes shapes are deformed especially if they are infected with diseases such as sickle cell or if they appear in clusters [9].
Diaz et al., [10] developed a technique for detection, quantification of parasitemia and parasite life stages. Pixels’ colour features were extracted and used to train classifiers for detection and determination of parasite life stages. Clustered erythrocytes were resolved by use of template matching before parasitemia was estimated. The study reported a sensitivity of 94% for detection of infected erythrocytes and 79% for stages identification. The technique was not fully automatic as it called for human intervention during training of the classifier every time diagnosis had to be made.
Di Ruberto et al., [11] proposed a technique of automatically detecting and quantifying malaria parasites infection in blood images of patients. The method employed a modified watershed algorithm to segment erythrocytes. There were two alternatives proposed for classifying parasite stages. One was the use of morphological thinning, where skeletons of parasites images were used to categorize parasites into their respective stages of infection. The second option was use of colour histograms similarity. The efficiency of the segmentation algorithm proposed reduces with the degree of clustering of erythrocytes. Similarly the accuracy of colour histogram similarity for classification of parasites would depend on the imaging parameters and illumination conditions under which the image being probed is taken. The detection accuracy of parasitemia reported was relatively low, 50%.
Most of the techniques proposed in the previous works didn’t address the distinction of plasmodium parasites from the rest of stained objects (artefacts) in the blood sample [9]. In this work, this limitations of the previous works have been addressed. A novel method of segmenting erythrocytes and plasmodium parasites using artificial neural networks (ANN) has been developed. This technique has solved the problem of distinguishing between the plasmodium parasites and other stained objects (artefacts) in images of thin blood smears. Identification of erythrocytes is performed by ANN. The classifier is trained to recognize erythrocytes with varied features. This makes the technique more robust than granulometry which has been used extensively in previous studies in erythrocyte recognition [8,11].
3. THE PROCESS MODEL
The ultimate goal of this work was to develop a system for detecting malaria using microscopic images of stained blood samples. This being image recognition and classification task, a systematic sequence of events was followed to achieve the objective. Generally, the procedure followed in solving such a problem is as follows. First an image is acquired and pre-processed, it is then segmented into different regions and appropriate features extracted. Next, a suitable classifier is used to categorize the features into their different classes. Finally, a decision is made about the information conveyed by the image based on the classes of features found by the classifier. Figure 1 below gives a block diagram of the algorithmic steps for detection of plasmodium parasites in thin blood smears.
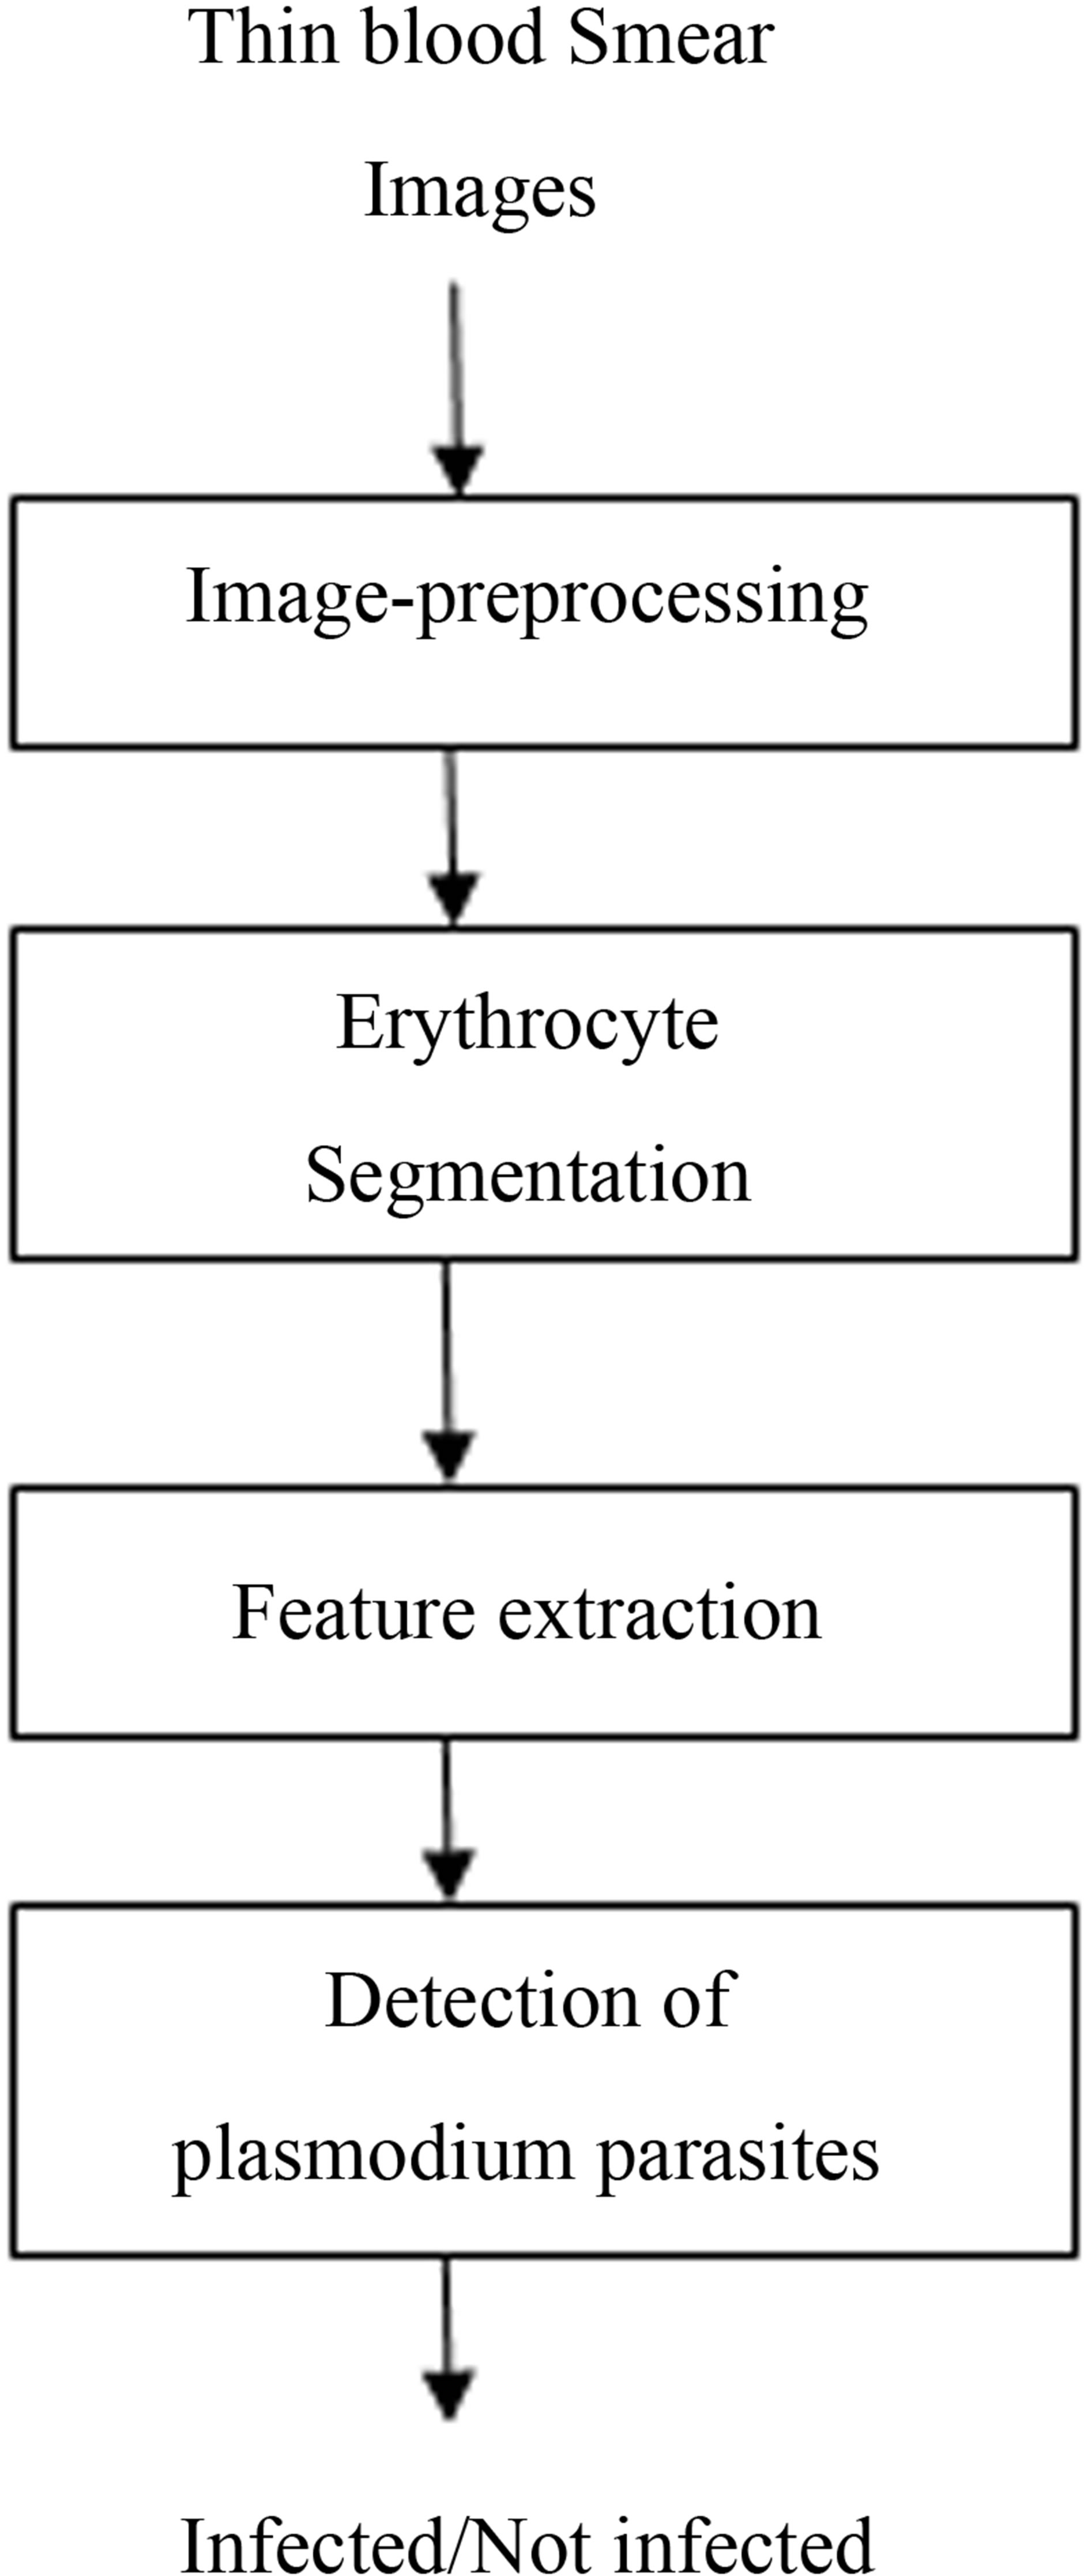
Figure 1. Model of plasmodium parasite detection.
4. IMAGE PRE-PROCESSING
The goal of this step is to make the acquired images more suitable for subsequent processes-mainly image segmentation and feature extraction. Basically, there are three main objectives for image pre-processing. One is to resize the image for the purposes of either magnifying the image through digital zooming, or reducing the image size in order to speed up processing. The second objective of image pre-processing is to reduce or eliminate noise from the acquired image. Third is to enhance the image contrast for visual evaluation.
In this case, digital zooming and contrast enhancement is not necessary since the task of image classification and recognition is to be performed by a computer and not a human operator. However image size normalization is essential in order to standardize the spatial resolution for images from different sources. Image filtering is also necessary in order to reduce or eliminate noise in images which could have been acquired during the process of sample preparation or image acquisition.
5. IMAGE SEGMENTATION
Image segmentation involves partitioning a digital image into its constituent regions. The goal of image segmentation is to locate objects and boundaries (lines and curves) in an image. Each of the pixels in a given object in an image share similar characteristics with other pixels belonging to the same object (set). These characteristics include; colour, texture, size, orientation, intensity, connectivity etc.
There are two reasons for performing image segmentation in the detection of plasmodium parasites from thin blood smear images. One is to isolate individual erythrocytes from the rest of blood constituents and the second is to locate probable plasmodium parasites from infected erythrocytes.
6. FEATURE EXTRACTION
This stage is about choosing suitable parameters which adequately describes the information of the image. These parameters are grouped together in vector form and are referred to as feature vectors. Features can be obtained directly from images e.g., raw image pixel values or they could be derived quantities such as average image intensity, image histogram moments, shape signature and object area.
7. DETECTION OF PLASMODIUM PARASITE
This stage falls under image classification. Feature vectors formed in the above stage are used as input to this stage. Trained classifiers are used to categorize thin blood smear images as either infected or not infected.
8. METHODOLOGY FOR DESIGN
The procedure for detection of plasmodium parasites in thin blood smear images has been highlighted in the process model. Images were acquired from two sources; Kenya Medical Research Institute (KEMRI) [12], and Centre for Disease Control (CDC) website [13].
Microscopic images of KEMRI samples were captured using a LEICA ICC50 RGB digital camera (with a maximum camera resolution of 1600 × 1600 pixels) fitted on the ocular lens of a LEICA DM500 microscope available at the Department of Veterinary Medicine, University of Nairobi. A blank glass slide image was also captured to be used as a reference sample. The captured images spatial resolution was automatically set to 300 by 300 pixels by the microscope software. To correct for non-uniform illumination in the KEMRI thin blood smear images, the absolute difference of KEMRI images and the blank sample image was performed.
Images from CDC are posted to the website for either confirmation of diagnosis or archiving from laboratories all over the world. These images are of different visual quality i.e. the images vary in their intensity contrast, hue, and magnification. This is a consequence of different techniques used in sample preparation, image capturing and processing. Correction for non-uniform illumination was expected to have been performed to these images since this is a standard practice.
9. IMAGE PRE-PROCESSING
There were two goals for image preprocessing. First was size normalization and second was noise reduction.
Size normalization was necessary in order to have all images with uniform size proceeding to the next stage. Images from CDC were of different spatial resolution with 300 by 300 square pixel images being the smallest of all. KEMRI images had their size normalized to 300 by 300 square pixels by the microscope software.
Noise reduction was considered to reduce some undesirable effects in the images which often are acquired during the process of sample preparation and image acquisition such a non-uniform illumination, salt and pepper noise and image blurring. Filtering operation using a square median filter was performed to both images from CDC and from KEMRI. This operation served to remove spurious noise present in the images. The length of the median filter used was 5 by 5 square pixels, a value obtained from the previous related work of Ross et al. [8]. After filtering, HSI images of the corresponding images were computed and stored. This was motivated by the fact that HSI colour spaces can easily highlight some parasite information which is difficult to identify in RGB colour space [11]. Table 2 below gives the algorithmic steps involved in this stage.
Test Results for Image Size Rescaling
Figure 2 shows two images from CDC and KEMRI before and after size normalization. Figure 2(a) is an image from CDC whose size is 1600 by 1600 pixels while Figure 2(b) is an image captured from KEMRI blood samples. Figures 2(c) and (d) give the resultant images after image rescaling operation.
After image rescaling CDC image size reduced to 300 by 300 pixels while maintaining its useful features such as erythrocytes, parasites and background regions. The KEMRI image size remained the same after rescaling. This therefore confirmed that the image rescaling algorithm given in Table 2 produced the desired results of rescaling images from both KEMRI and CDC to the same spatial resolution. Image rescaling was necessary to speed up computation in the subsequent stages i.e., feature extraction, image segmentation, and detection of plasmodium parasites.
Test Results for Noise Reduction
The effect of image filtering using median filtering and compensation of non-uniform illumination (in the case of KEMRI images) described in the algorithmic
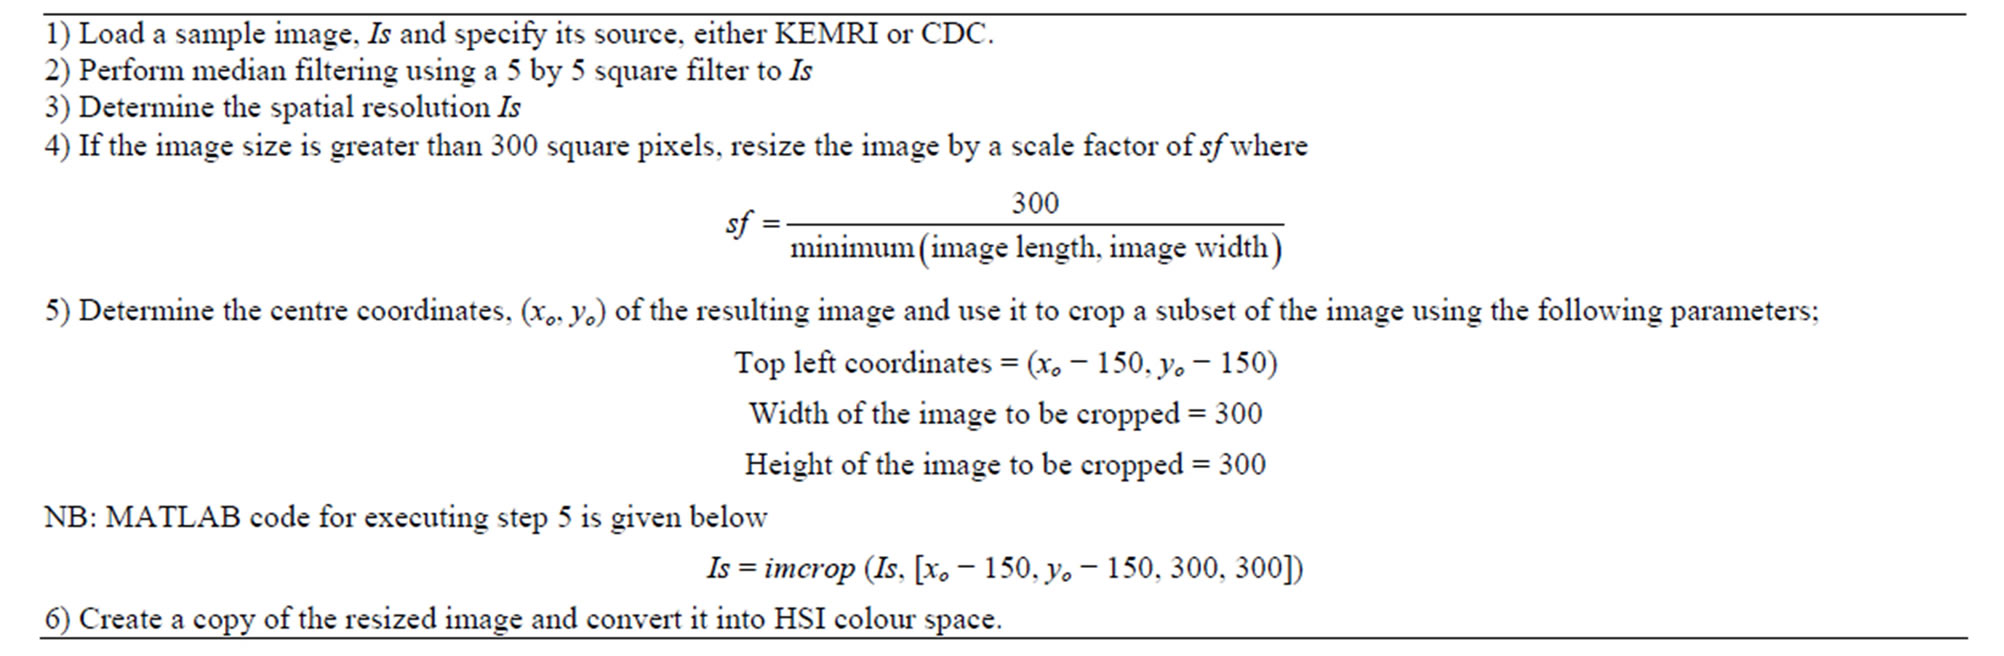
Table 2. Pre-processing steps for KEMRI and CDC images.
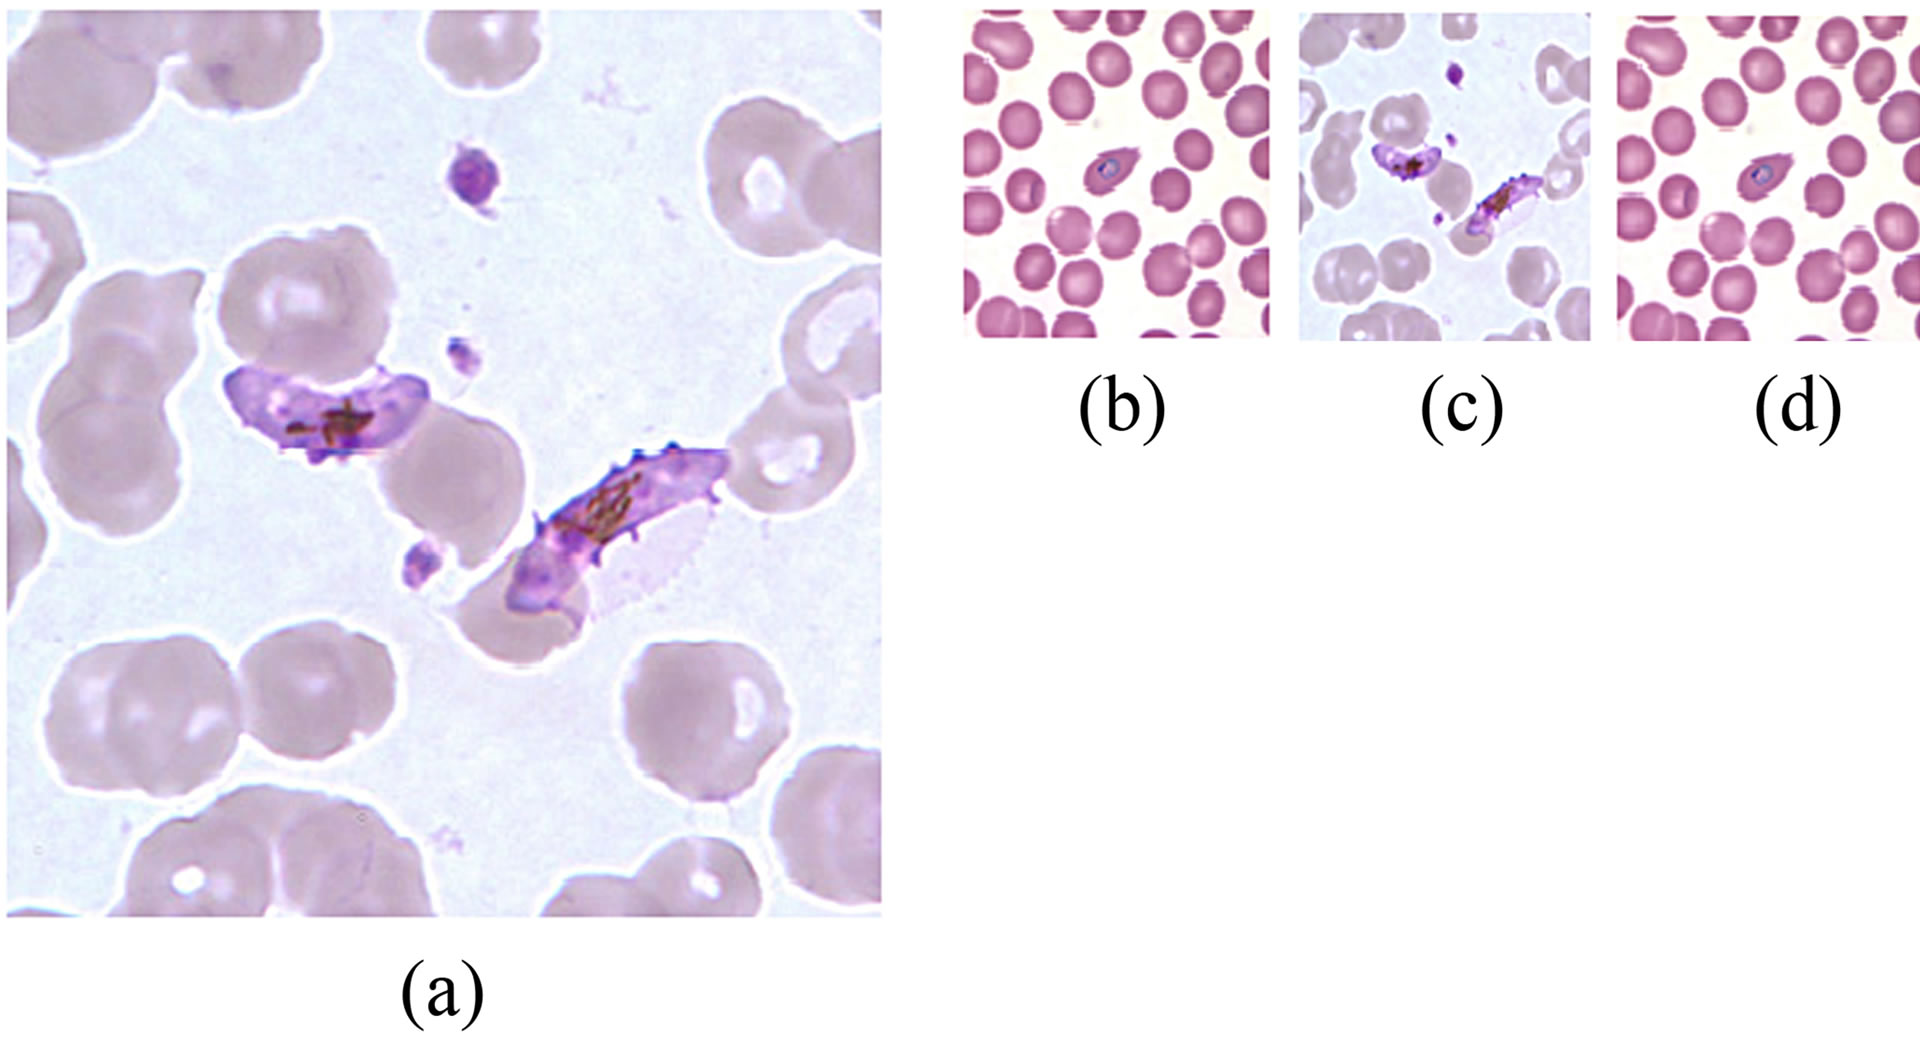
Figure 2. Results of image rescaling, (a) CDC image, (b) KEMRI image, (c) and (d) rescaled CDC and KEMRI images respectively.
steps in Table 2 was investigated. Here, both the raw images and pre-processed images of Figure 2 were segmented using Zack’s algorithm [14]. The test results of the segmentation process are presented in Figure 3.
Figures 3(a) and (d) are the rescaled KEMRI and CDC images respectively. Erythrocytes of these images were segmented before and after performing the filtering operation with a median filter. From the results it can be seen that for KEMRI image, there is no notable difference in the two binary images. However, for CDC image segmenting the image after the filtering operation resulted to a significant improvement of the binary image quality. This could be as a result of CDC images being degraded by noise, an effect that is corrected by median filtering. Some of the possible sources of such noise include unbalanced illumination of the sample in the microscope, poor sample preparation, sample degradation or a combination of these factors. By performing median filtering random noise also referred to as salt and pepper noise was smoothed and this led to an improvement in the quality of the segmented binary image.
10. IMAGE SEGMENTATION
There were two objectives of image segmentation. One was to isolate individual erythrocytes from the rest of blood constituents and the second was to partition probable plasmodium parasites from the infected erythrocytes. Two image segmentation schemes were explored and their results compared. One was the traditional image segmentation technique of histogram thresholding and the other was the use of artificial neural network for image segmentation.
Erythrocyte Segmentation by Histogram Thresholding
Both RGB and HSI images were used for segmentation. For RGB images, the green component was used. This is because the green colour component is the least noisy of RGB components and parasites are most visible [8]. For HSI colour space, both hue and saturation com-
 (a)
(a)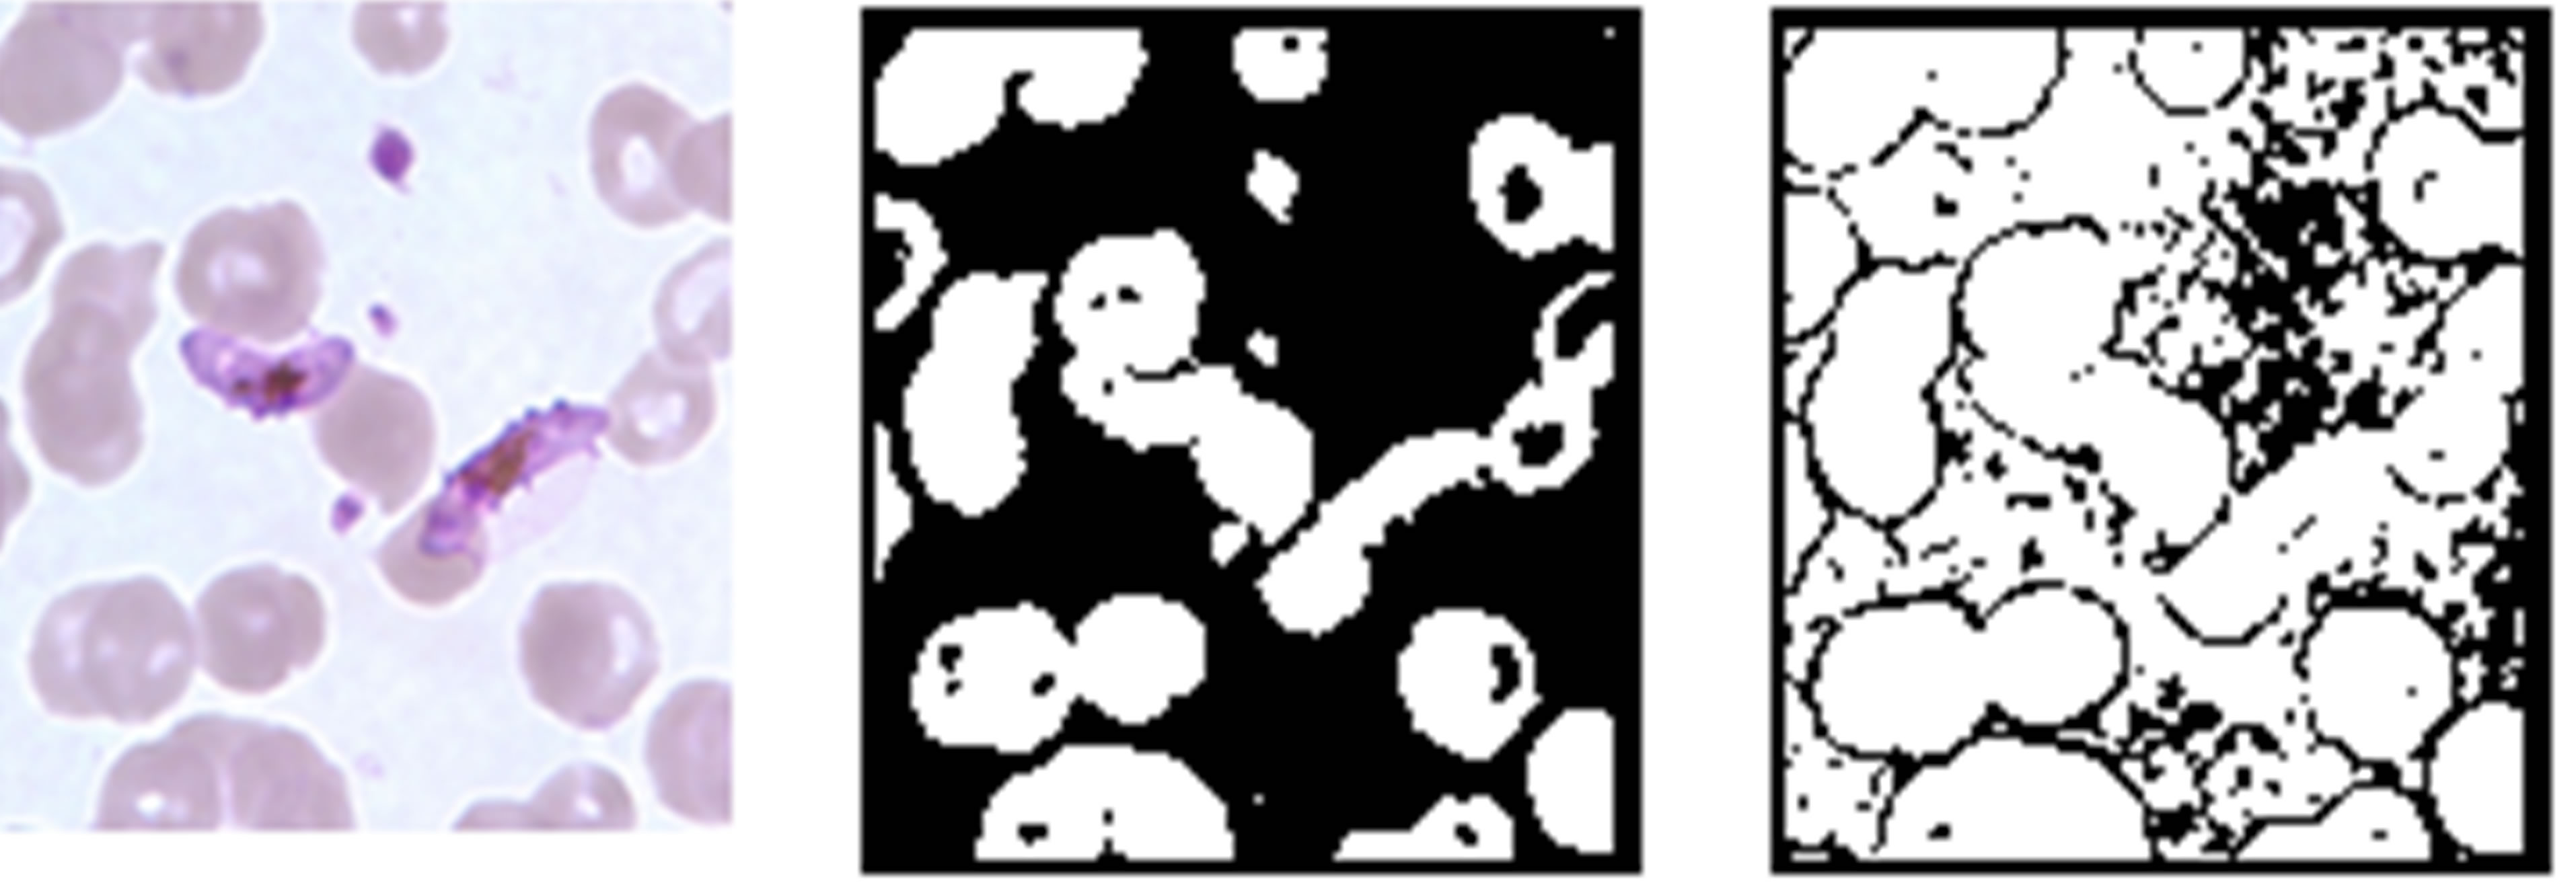 (b)
(b)
Figure 3. Effect of image filtering, (a) and (d) pre-processed KEMRI and CDC images, (b) and (e) binary images obtained from the pre-processed images, (c) and (f) binary images obtained from raw images from KEMRI and CDC respectively.
ponents were used for segmentation.
Histograms of these gray scale images were obtained and their threshold values determined by implementing Otsu’s algorithm [15]. The Algorithmic steps for erythrocyte segmentation are given in the Table 3.
Test Results for Erythrocyte Segmentation Using Histogram Segmentation
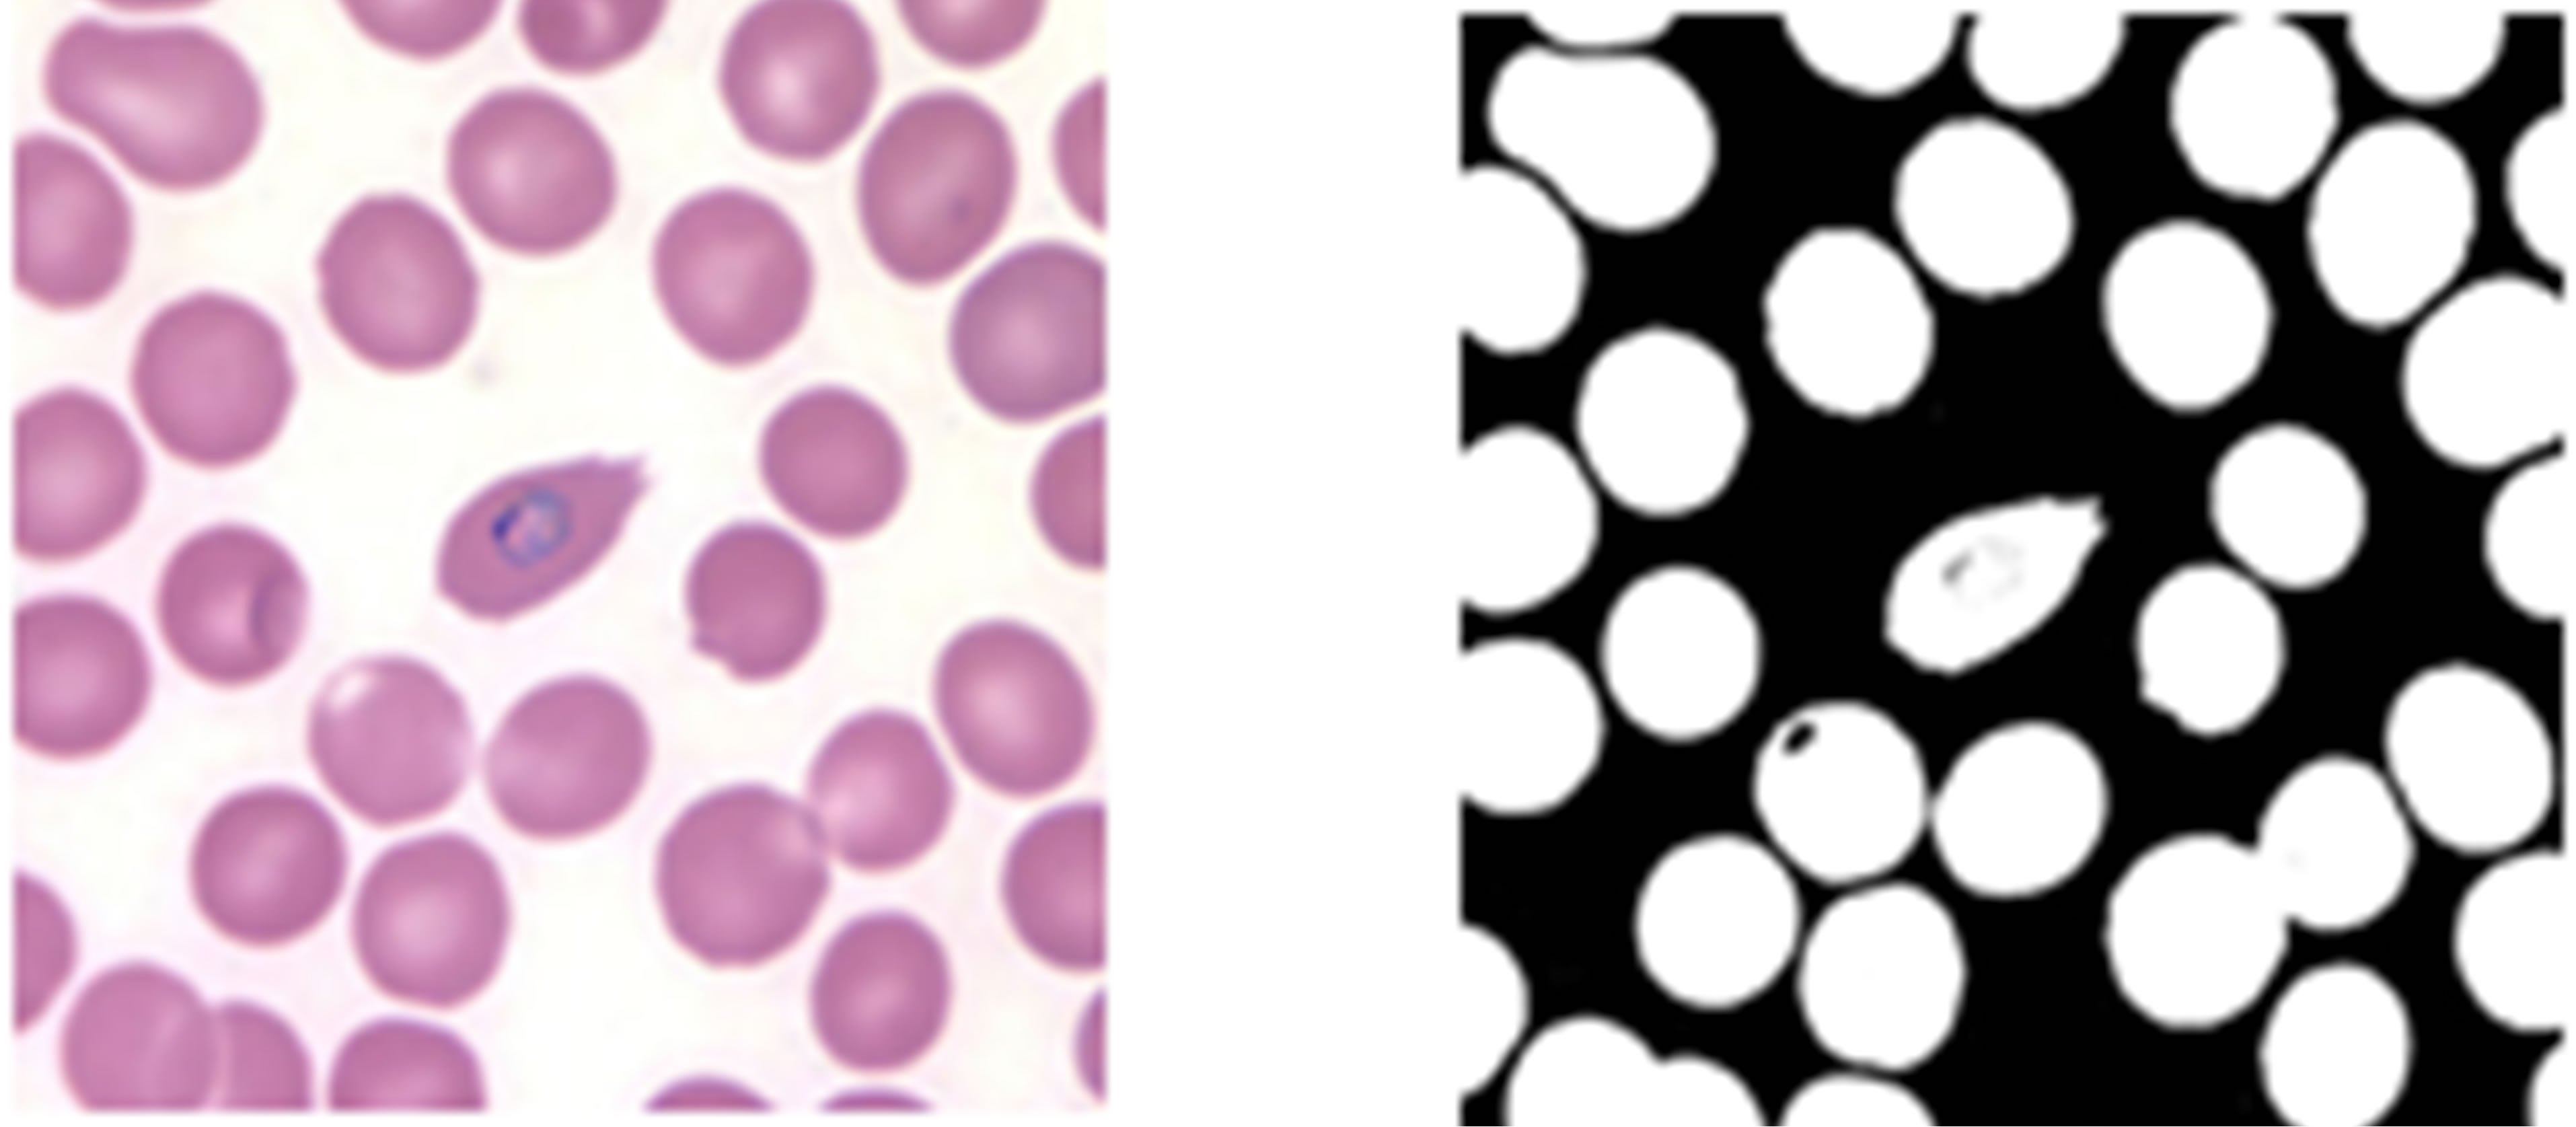
Histograms of sampled images from CDC and KEMRI were obtained and their threshold values determined using Otsu’s algorithm. Test results of erythrocyte segmentation obtained using image histogram are presented in Figures 4 and 5 for a CDC image and a KEMRI image respectively.
For CDC image, the green component image produced good segmentation results for erythrocytes but it also captured the plasmodium parasite regions as part of the foreground. The hue component resulted to a binary image whose foreground (erythrocyte regions) had noisy boundaries. The saturation component failed to produce erythrocytes as the objects but instead segmented the parasites.
The same test was conducted with a KEMRI image to determine which colour component image would produce the best erythrocyte segmentation results. Figure 5 shows the KEMRI image, and the resulting binary images from its corresponding green, hue, and saturation image colour components. It can be observed from the figure above that the binary images from green component of RGB images and saturation component image produced good erythrocytes regions but as in the case of CDC image, hue component image produced a noisy binary image.
From these observations, it was deduced that the green colour component of RGB image is the most suitable for
Table 3. Algorithmic steps for Erythrocyte segmentation.
 (a) (b) (c) (d)
Figure 4. CDC image histogram thresholding, (a) Pre-processed image from CDC, (b)-(d) Resultant binary images obtained from thresholding the green, hue, and saturation component images.
 (a) (b) (c) (d)
Figure 5. KEMRI histogram thresholding, (a) Pre-processed image from KEMRI, (b)-(d) Resultant binary images obtained from thresholding the green, hue, and saturation component images.
segmentation using histogram segmentation techniques. This is in agreement with the findings of Di Ruberto et al. [11] that the green colour component is the least noisy.
Training of Artificial Neural Network
ANN is a supervised learning technique used to classify patterns into different classes based on a training set. Training an ANN involves supplying the network with input features and their corresponding targets (desired outputs). The network then tries to adjust its input coefficients (commonly referred as the weights and biases) until a point where its output matches the corresponding target for a given input feature. When this happens the network is said to have learnt to classify different classes of input features. A trained ANN is capable of correctly classifying features which it has not been trained with. This is known as network generalization.
MATLAB™ has a toolbox for creating artificial neural networks. This toolbox divides input features into three groups. The first group is made of 60% of the total training set. It is used in training the network (adjusting the weights and the biases). The second and the third groups each consist of 20% of the training set. One group is used for validating the network. This means checking that the network is generalizing and it stops training before over-fitting. The other group is used as an independent test of the network generalization.
Artificial Neural Network Segmentation of Erythrocytes
In this method, a multilayer back propagation neural network was trained to partition the image into two regions; erythrocytes region and the image background. Two sets of feature vector were used to train two artificial neural networks. One network was trained with RGB pixel values and the other one with both RGB and HSI image pixel values. The features were divided into two classes; erythrocytes and the background pixel values. A total of 540 feature vectors were used to train the neural network, with 340 feature vectors belonging to the erythrocytes class and 192 feature vectors belonging to the background class.
Test Results for Artificial Neural Network Segmentation of Erythrocytes This Should Go to Results
Erythrocyte segmentation using two ANN classifiers were tested. The first classifier was trained with only pixel values of RGB images. The other classifier was trained with both RGB and HSI image pixel values. Table 4 below gives the classification accuracy in percentage attained by the two ANN classifiers. The regression plots of the two classifiers are given in Figures 6 and 7.
From the results given in Table 4 below, the performance of the two ANN classifiers was impressive (above 99%). However, the network trained only with RGB features performed marginally better than the one trained with both RGB and HSI features. This can be attributed to the fact that neural network classification accuracy decreases when the number of features is increased while the sample size is held constant [16,17]. It can be concluded that RGB features are adequate to distinguish erythrocytes from the rest of the thin blood smear image using an ANN.
The Artificial Neural Network trained with RGB features was used to segment the same images used in histogram segmentation, one from KEMRI and the other from CDC. The binary images of Figures 8(b) and (d) were
Table 4. Performance of erythrocyte segmentation using ANN classifiers.
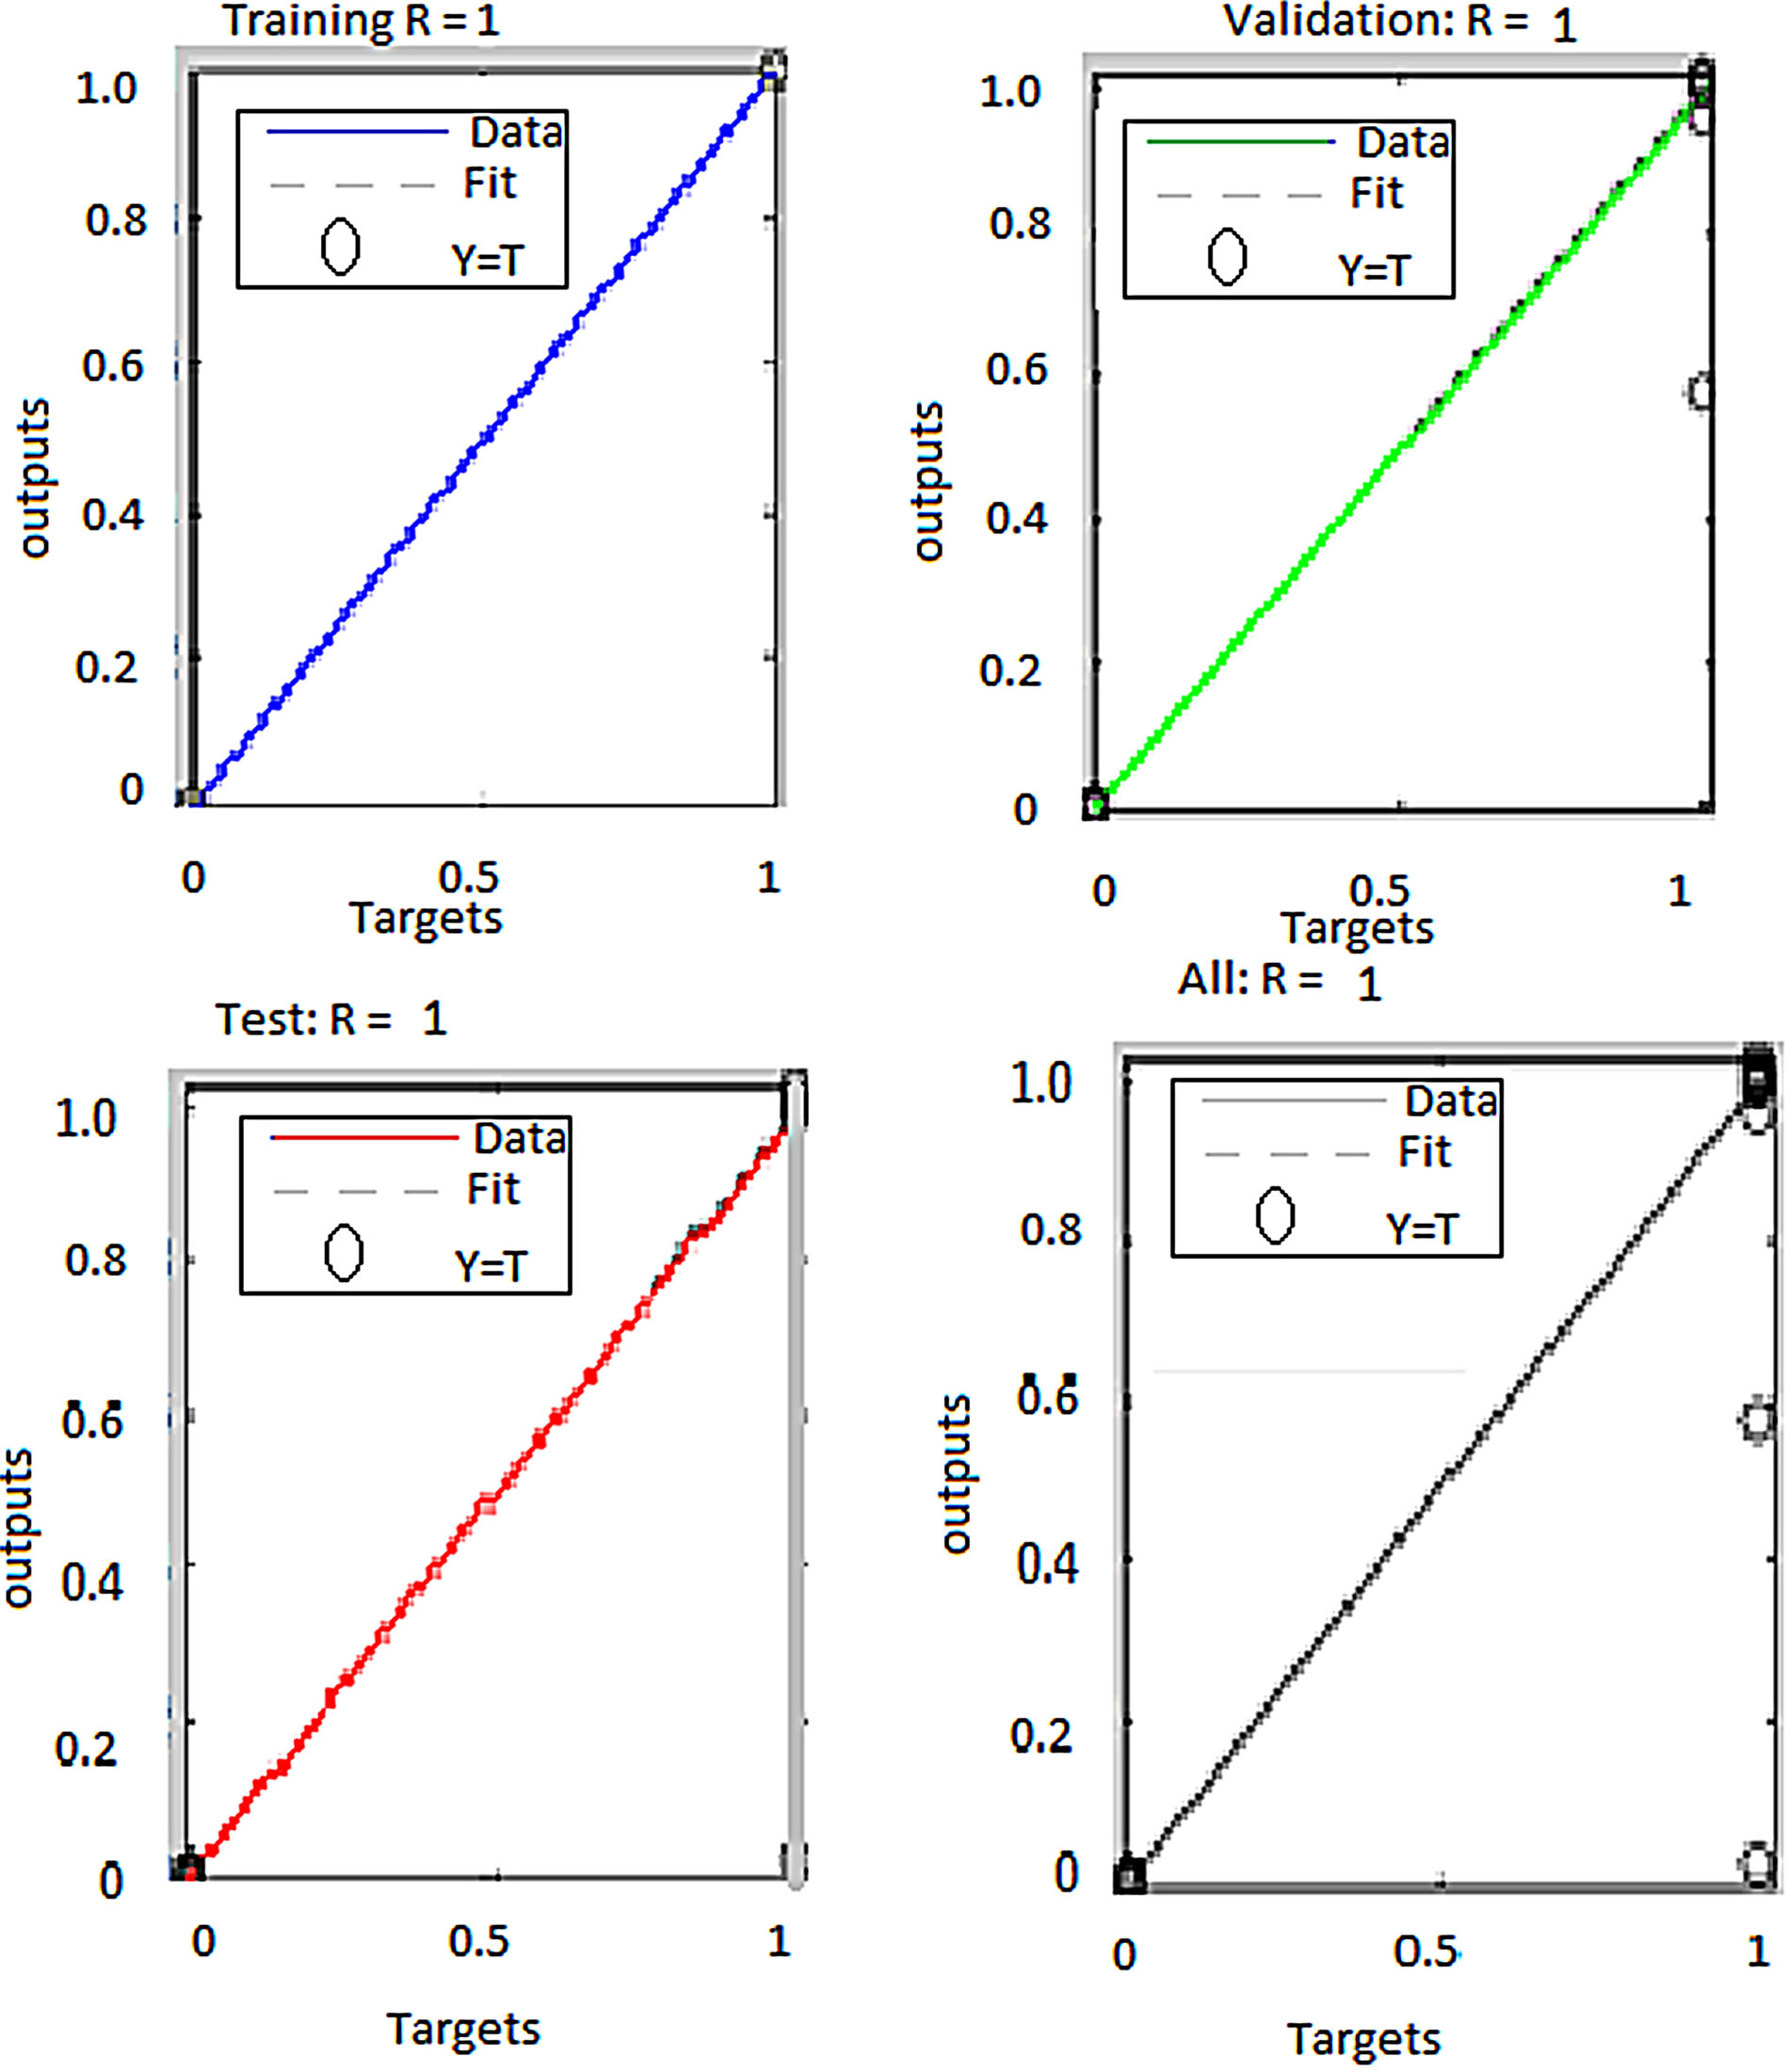
Figure 6. ANN regression plots for erythrocyte segmentation classifier using RGB features.
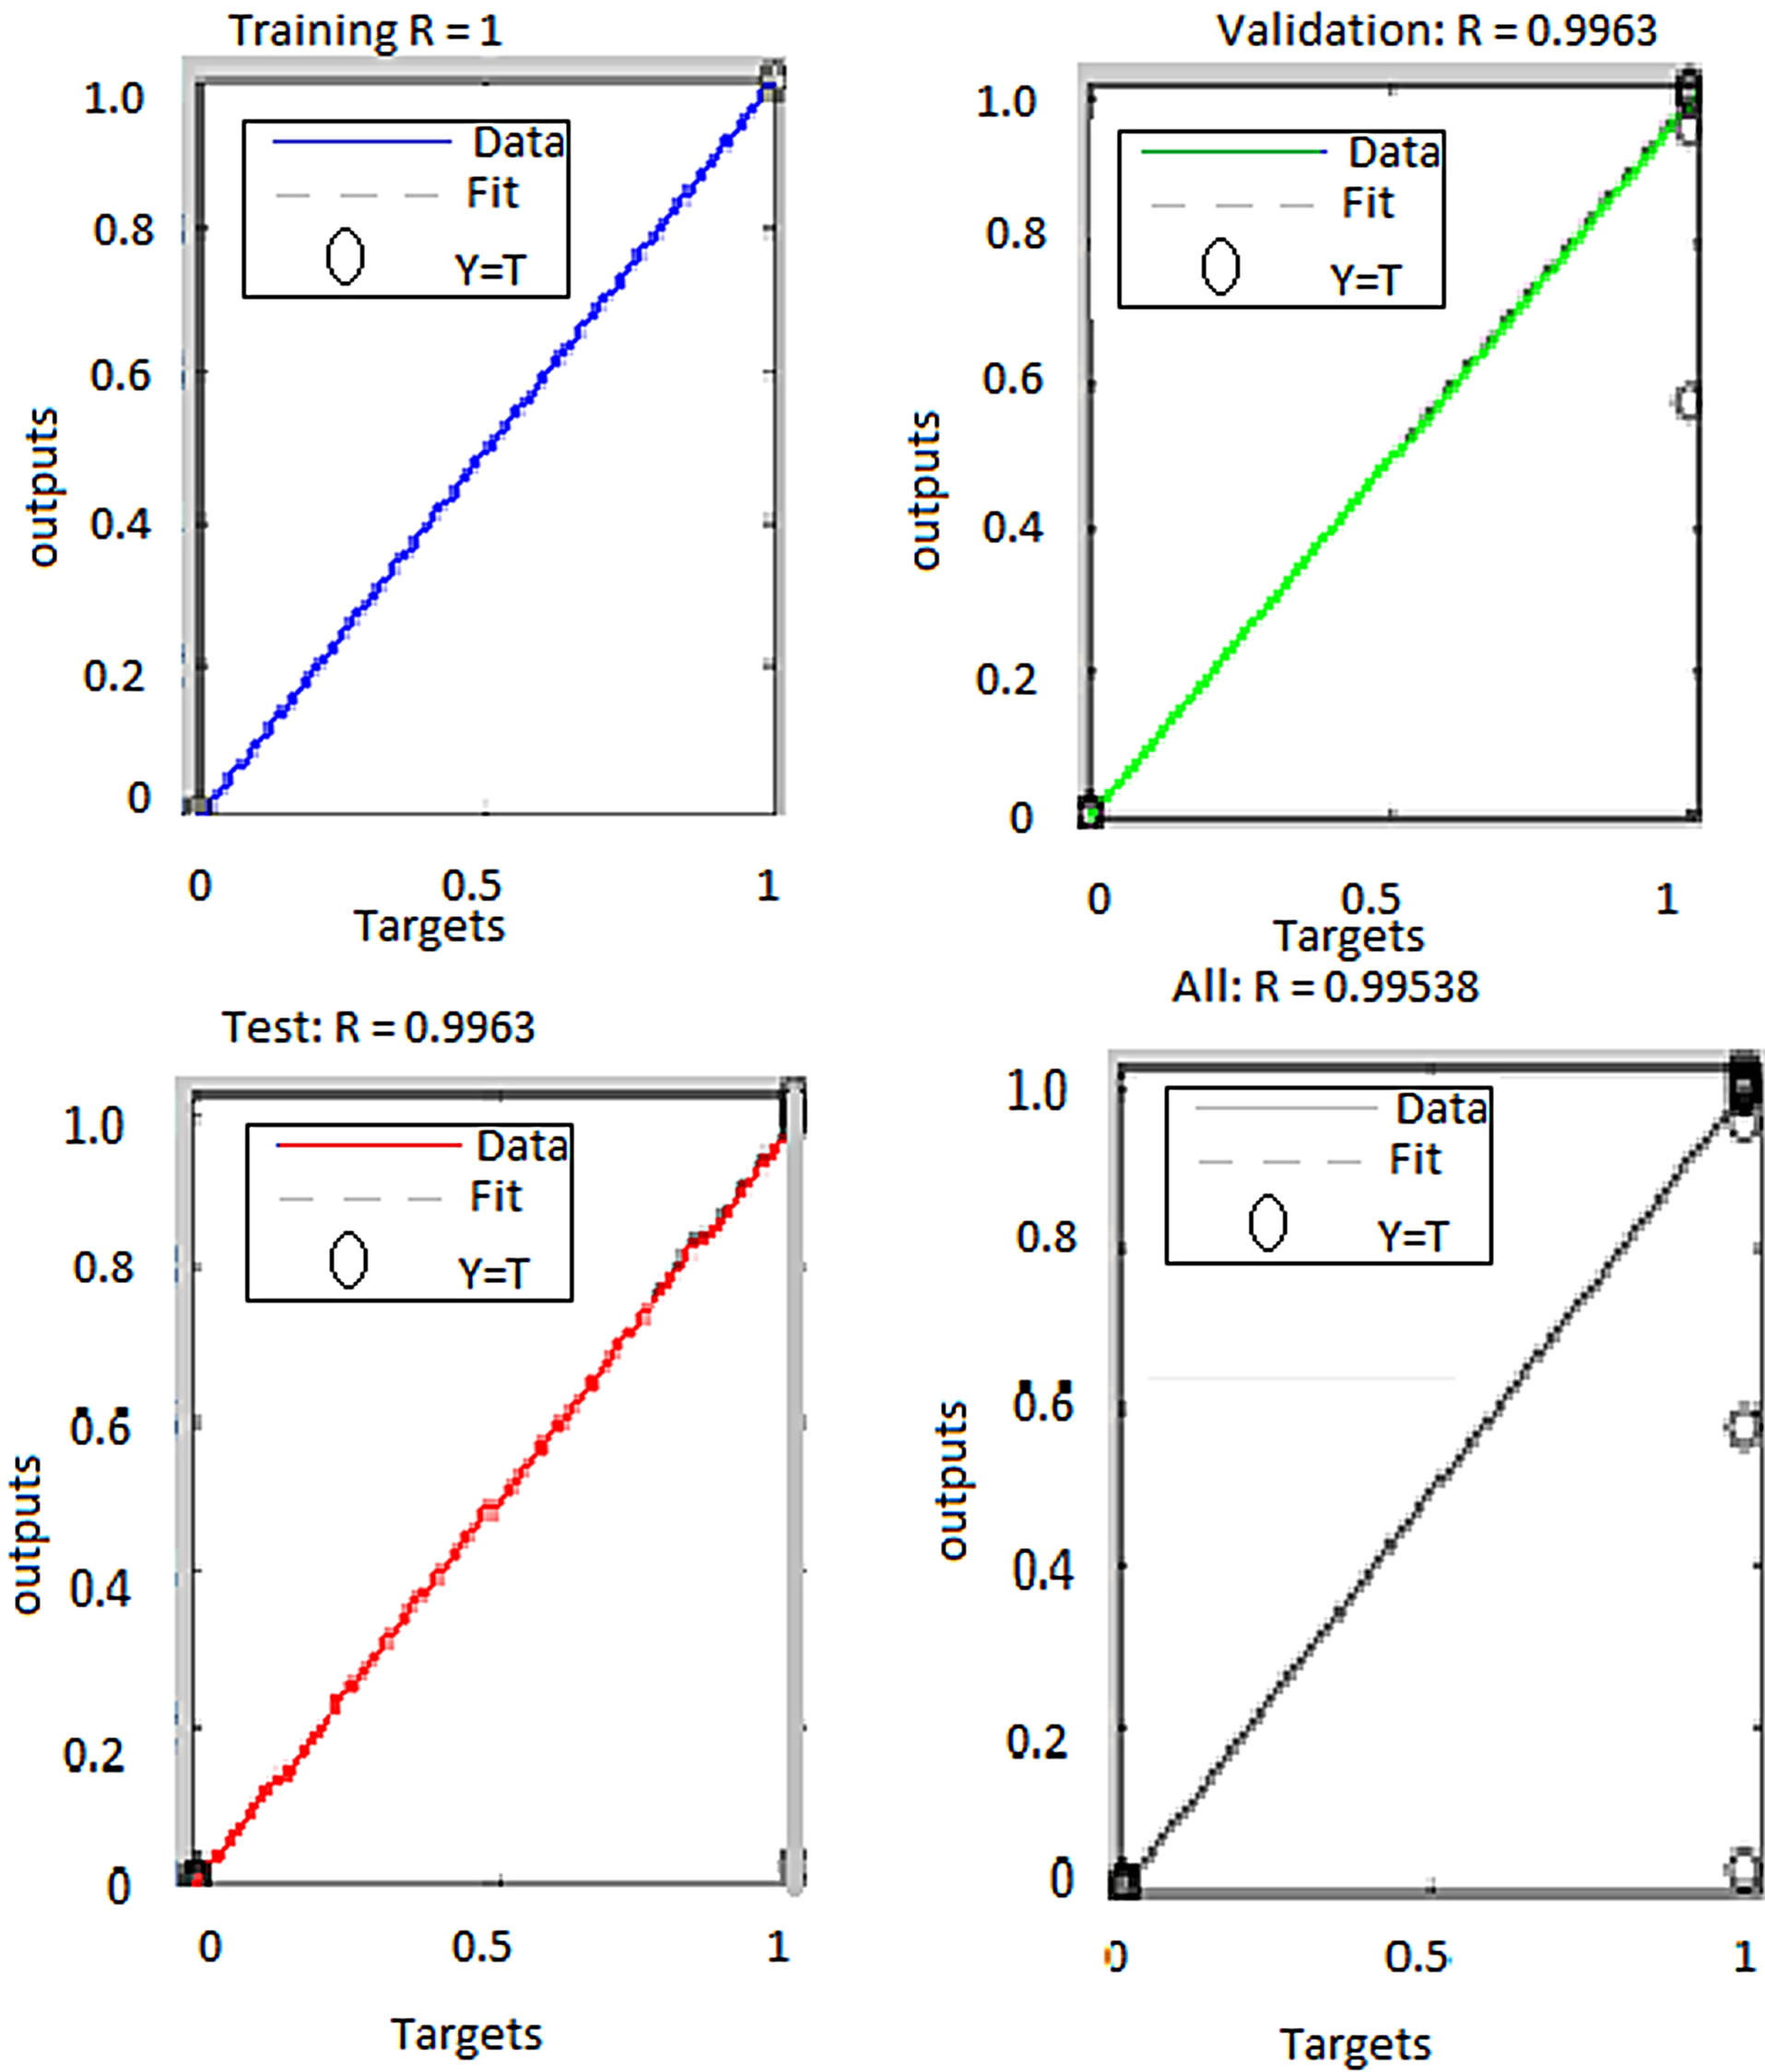
Figure 7. ANN regression plots for erythrocyte segmentation classifier using RGB and HSI features.
 (a)
(a)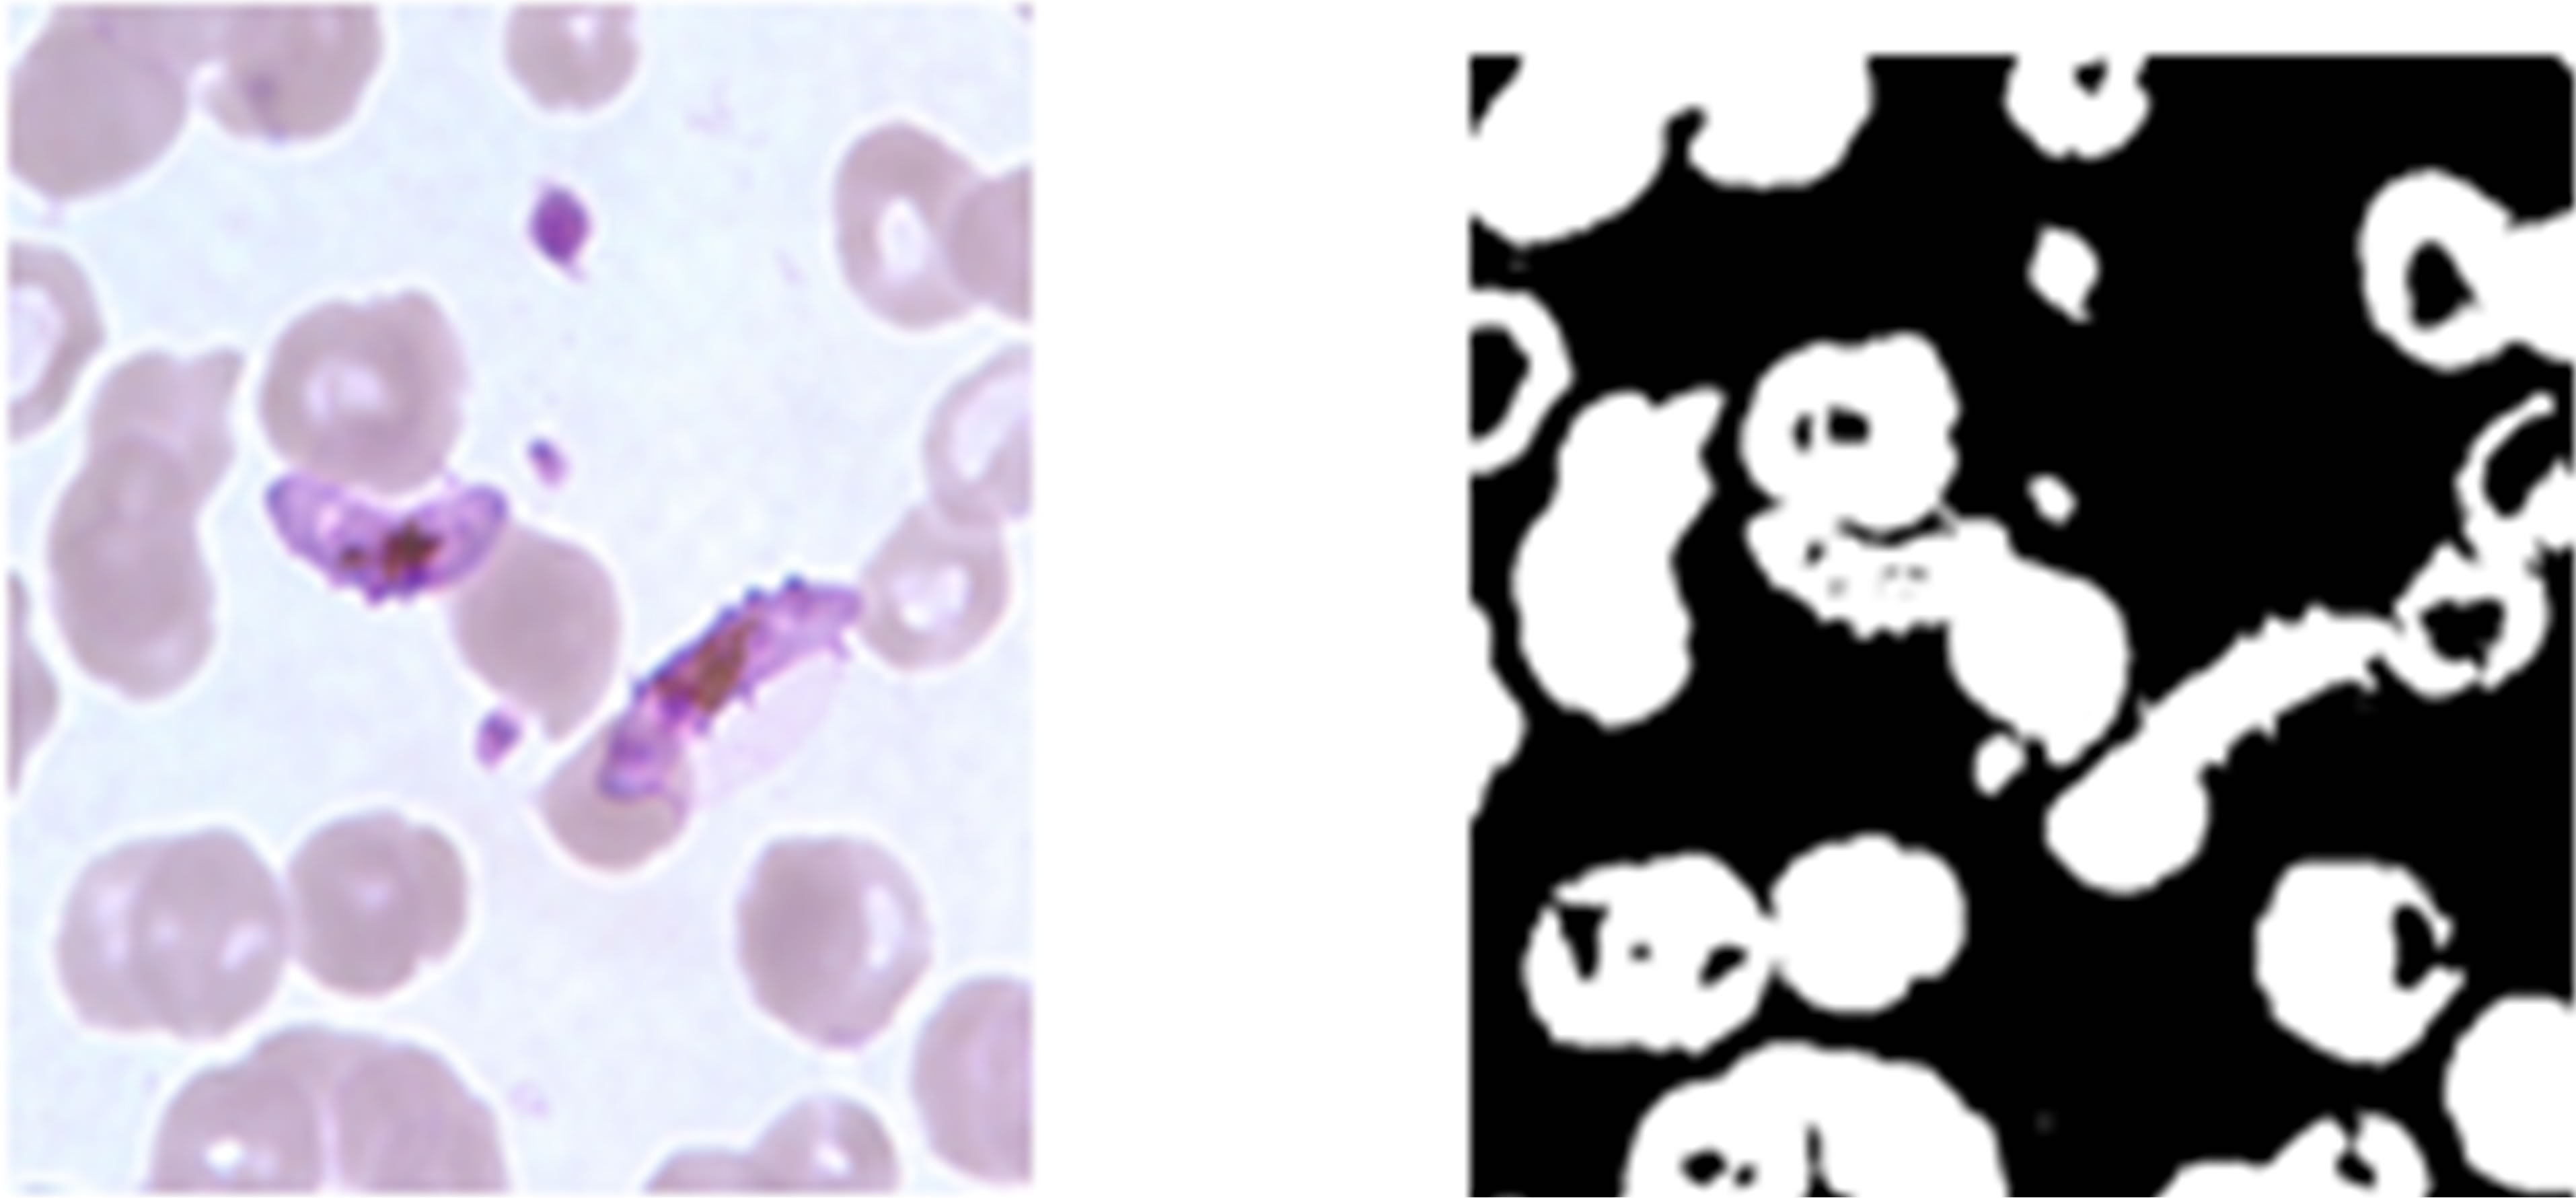 (b)
(b)
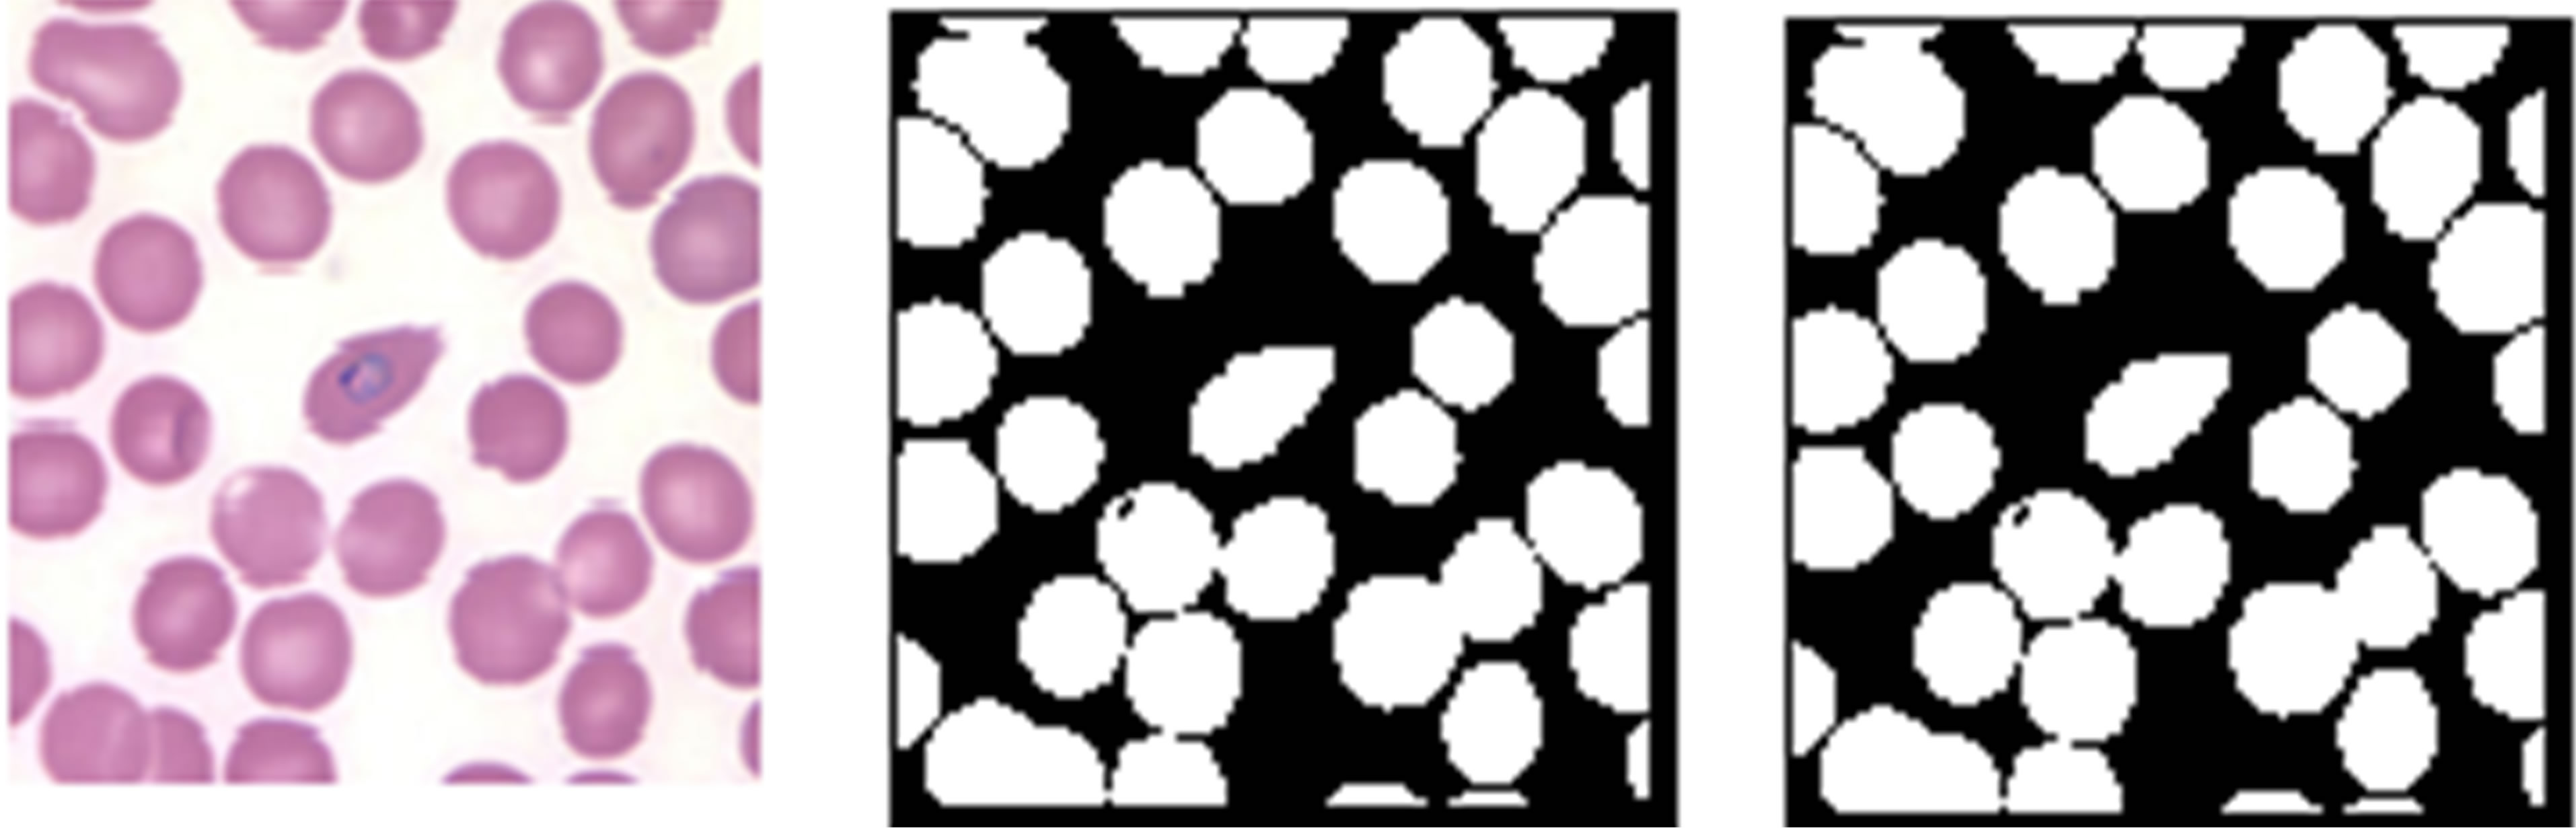
Figure 8. Erythrocyte segmentation results of Artificial neural network, (a) is the pre-processed image from KEMRI, (c) is the pre-processed image from CDC, (b) and (d) are the resultant binary images obtained as the outputs of ANN trained to segment erythrocytes.
obtained. From these images it can be observed that the ANN managed to capture the erythrocyte regions well in both CDC and KEMRI images.
Figure 8 indicates that ANN managed to produce fairly good segmentation results for the erythrocytes for both CDC and KEMRI images. The quality of the segmented images is comparable with that obtained by histogram segmentation using the green colour component of the images.
11. DETECTION OF PLASMODIUM PARASITE
Just as in the case of erythrocytes segmentation, there were two options explored in the detection of plasmodium parasites in thin blood smear images; the conventional image processing segmentation techniques and the adaptive machine learning technique of training a classifier to isolate parasites regions from the rest of the image constituents.
In the first option, histogram segmentation was the method of choice as it partitions an image into different regions based on the objects present rather than boundaries of objects. This is desirable because the staining process of blood smears on glass slides highlights surface features of plasmodium parasites and makes them easier to identify. Other region based segmentation techniques such as split and merge and region growing are computationally expensive and call for prior knowledge of the image to be segmented such as average intensity, variance of intensity in a given neighbourhood etc. Such information would be difficult to specify given the fact that images used especially from CDC were of varied quality.
Detection of Plasmodium Parasites Using Image Histogram Segmentation
Histograms of the green component of the RGB images were used to segment the parasites. The green component was chosen since it was found to produce best regional segmentation results in comparison to other colour components belonging to RGB and HSI components (refer to the erythrocyte segmentation above). The threshold value used to segment the gray scale image was determined by a modified Zack’s algorithm.
Modified Zack’s Algorithm
Zack’s algorithm just as Otsu’s algorithm is designed to locate the global minimum points in an image histogram. This point becomes the threshold value for separating foreground objects from the image background. Often the global minimum of a blood smear image is the point separating the image background and the erythrocytes. This is due to the fact that the two dominant modes in these image histograms correspond to background and erythrocyte pixel values. The mode due to plasmodium parasites pixels is negligible compared to the above two modes since they occupy a small area in an image in comparison to the background and erythrocytes. Therefore, a global minimum would separate erythrocytes from the image background and not the parasites. To segment parasite regions, Zack’s algorithm was modified to locate local minimum which corresponds to the boundary between parasite regions and the rest of the blood constituents. First, a histogram, h of a gray scale image (in this case the green component RGB image) was determined. Then a global minimum point, To of the histogram was sought using either the original Zack’s algorithm or Otsu’s method. Then, a matrix of 1 by 256 (the total number of gray levels in the intensity image) elements was formed. The first To values of the matrix elements were set to ones and the rest were set to zeros. This matrix was multiplied element by element with histogram h to form a modified histogram. A global minimum point of the new histogram was used as the threshold value for segmenting plasmodium parasites from rest of the image constituents. Table 5 gives the algorithmic steps for implementing the modified Zack’s algorithm.
Test Results of Segmentation of Plasmodium Parasites Using the Modified Zack’s Algorithm
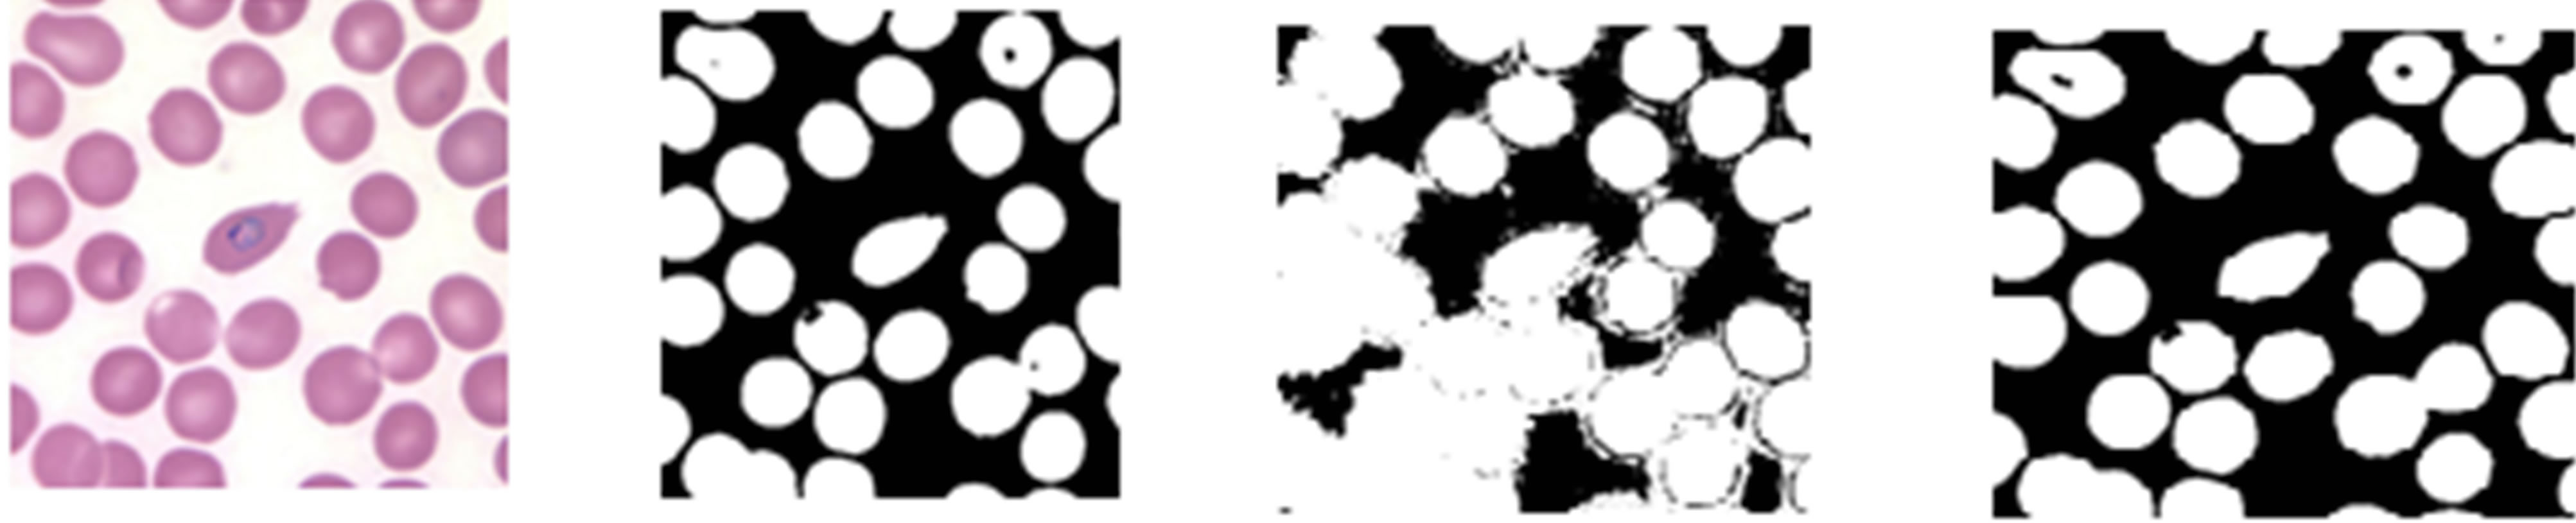
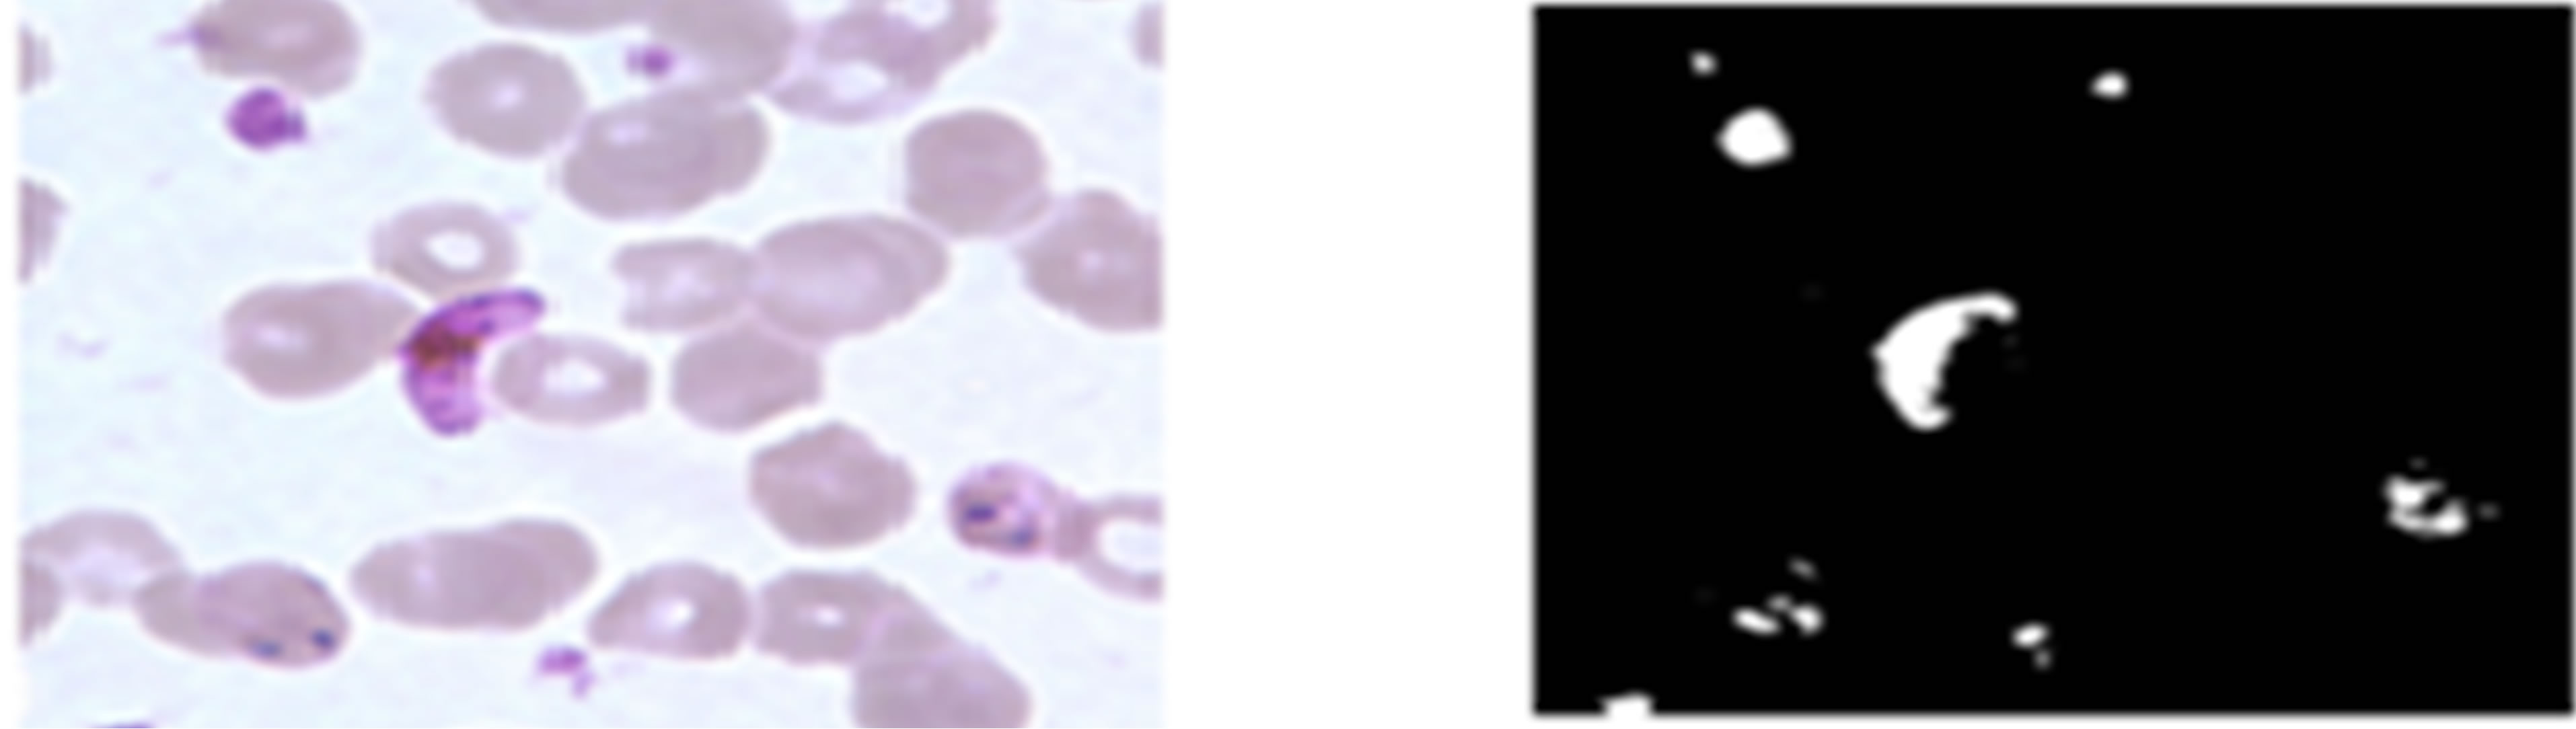
Segmentation of plasmodium parasites in images of thin blood smears using a modified version of Zack’s algorithm was tested. Two images were randomly picked; one from KEMRI and another from CDC and were segmented using the Zack’s algorithm technique modified to detect parasite regions. Figure 9 shows the original images alongside the binary images obtained after segmentation.
As can be seen from images in Figure 9, the algorithm produced a fairly good segmentation result for the plasmodium parasites in KEMRI image but miss-classified
Table 5. Algorithmic steps for implementing modified Zack’s algorithm.
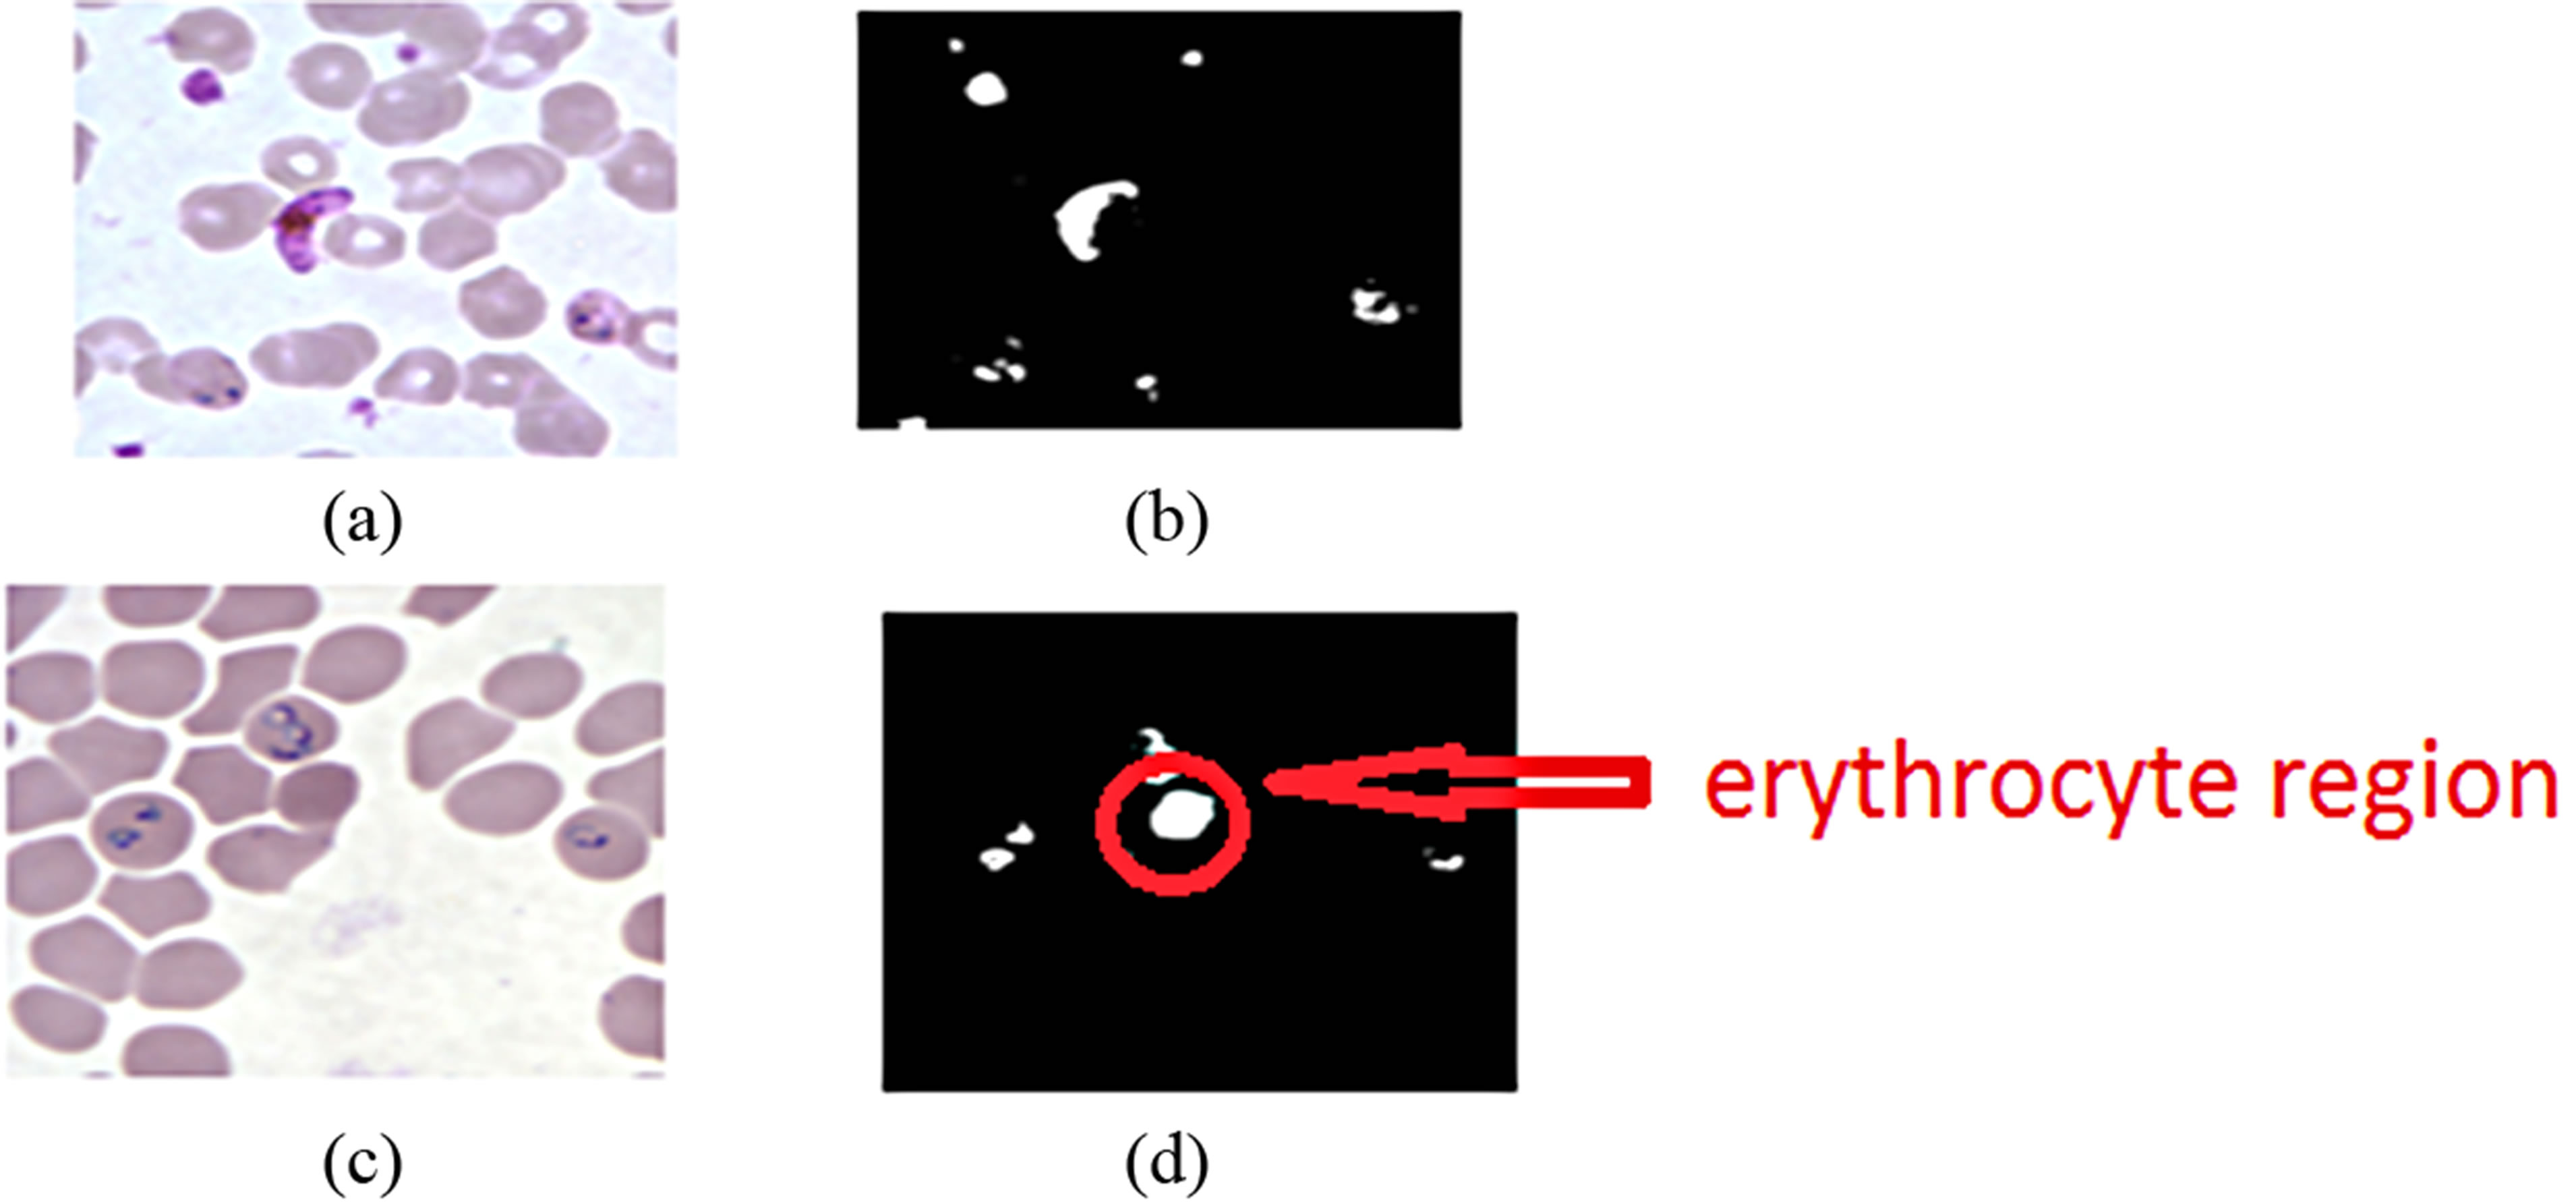
Figure 9. Plasmodium parasite segmentation using a modified Zack’s algorithm, (a) KEMRI image, (c) CDC image, (b) and (d) the corresponding binary images of the parasites.
an erythrocyte as a parasites in the CDC image. The miss-classified region is circled in red. The histogram technique classified an erythrocyte as a parasite due to the fact that the misclassified erythrocytes intensity levels were lower compared to other erythrocytes. One limitation of this technique is that it does not take into account the hue information of the objects to be segmented and therefore segmentation is done on the bases of the magnitude of the gray scale value of the image pixels. This technique also suffers from high rates of false positive cases arising from the algorithm misclassifying artefacts as plasmodium parasites provided that their gray scale values are comparable to those of the parasites. This problem can be solved by using a segmentation technique that takes account of the full colour information besides the intensity values of an image.
Detection of Plasmodium Parasites Using Artificial Neural Network
In this method, two multilayer back propagation neural network classifiers were trained to identify plasmodium parasites from the rest of the image constituents. One network was trained using a feature vector formed from corresponding pixel values of the red, green and blue image colour components of both CDC and KEMRI images. The second network was trained using feature vectors formed from the red, green, blue, hue, saturation, and intensity components of the RGB and its corresponding HSI colour images. The training set was divided into two classes; features from infected erythrocytes and features from non-infected erythrocytes.
Test Results for Artificial Neural Network Segmentation of Plasmodium Parasites
Two sets of feature vectors were used to train two artificial neural network classifiers to segment plasmodium parasites from the rest of the blood constituents. The two sets of features were, a three dimensional feature vector consisting of pixel values for red, green and blue image colour components and a six dimensional feature vector consisting of pixel values of red, green, blue, hue, saturation and intensity colour components. The performance of these two networks is presented in Table 6" target="_self"> Table 6. The regression plots generated by the MATLAB™ neural network toolbox for both networks are given in Figures 10 and 11.
From these results, ANN trained with RGB features performed better than the one trained with both RGB and HSI features. The overall performance of the networks trained with RGB features was 99.9% while the performance for the network trained with both RGB and HSI features was 82.4%. Besides, the second classifier performed poorly in generalizing as can be seen from the test plot which attained mere 36.2% accuracy. The reason for lower classification accuracy by the ANN trained with both RGB and HSI feature as compared to the one trained with RGB features only is the fact that when the feature size was increased keeping the sample size constant, the classification accuracy decreased. A similar observation was noted previously in segmentation of erythrocytes using ANN. This can be attributed to the fact that ANN performance depends on the number of training examples and the size of the feature vectors. If the di-
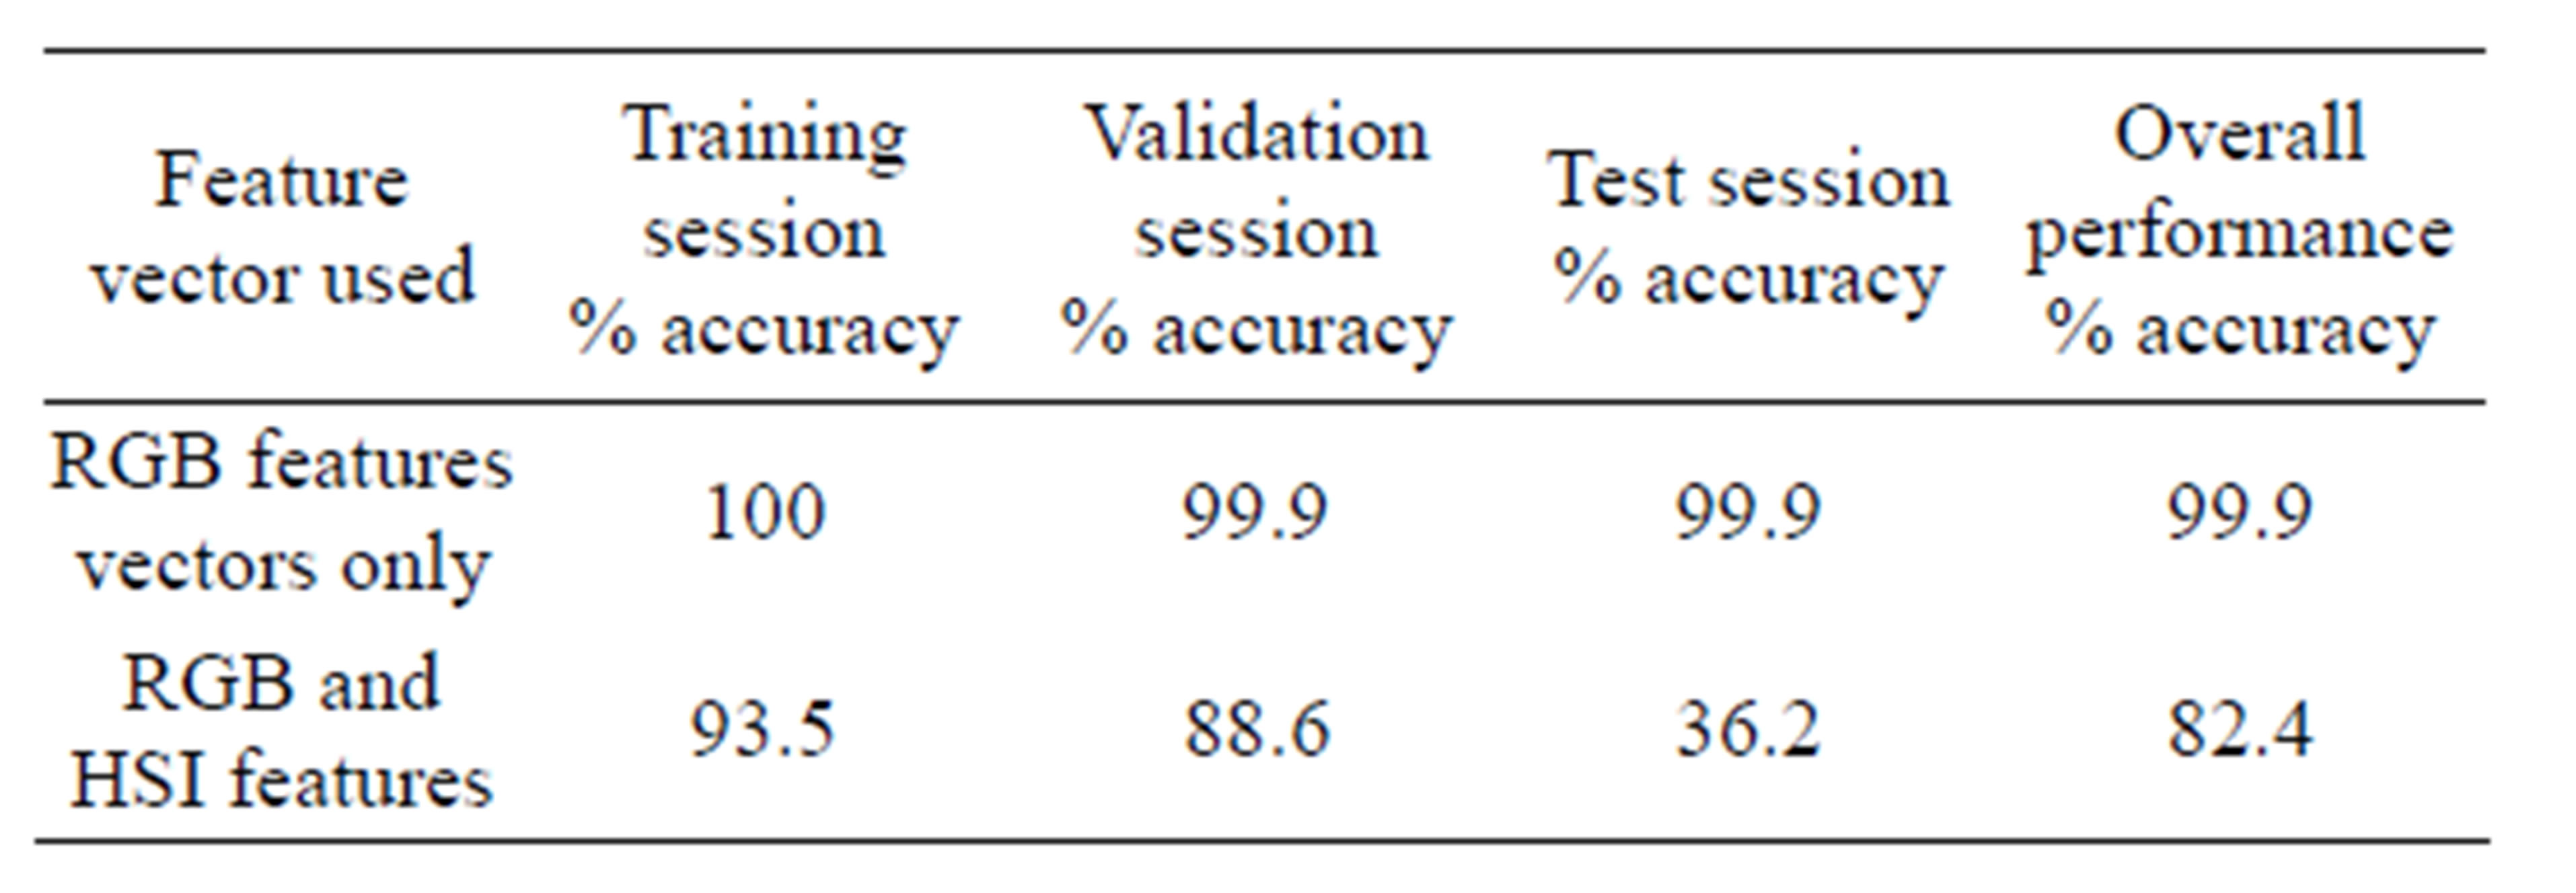
Table 6. ANN Performance of Plasmodium parasite detection.
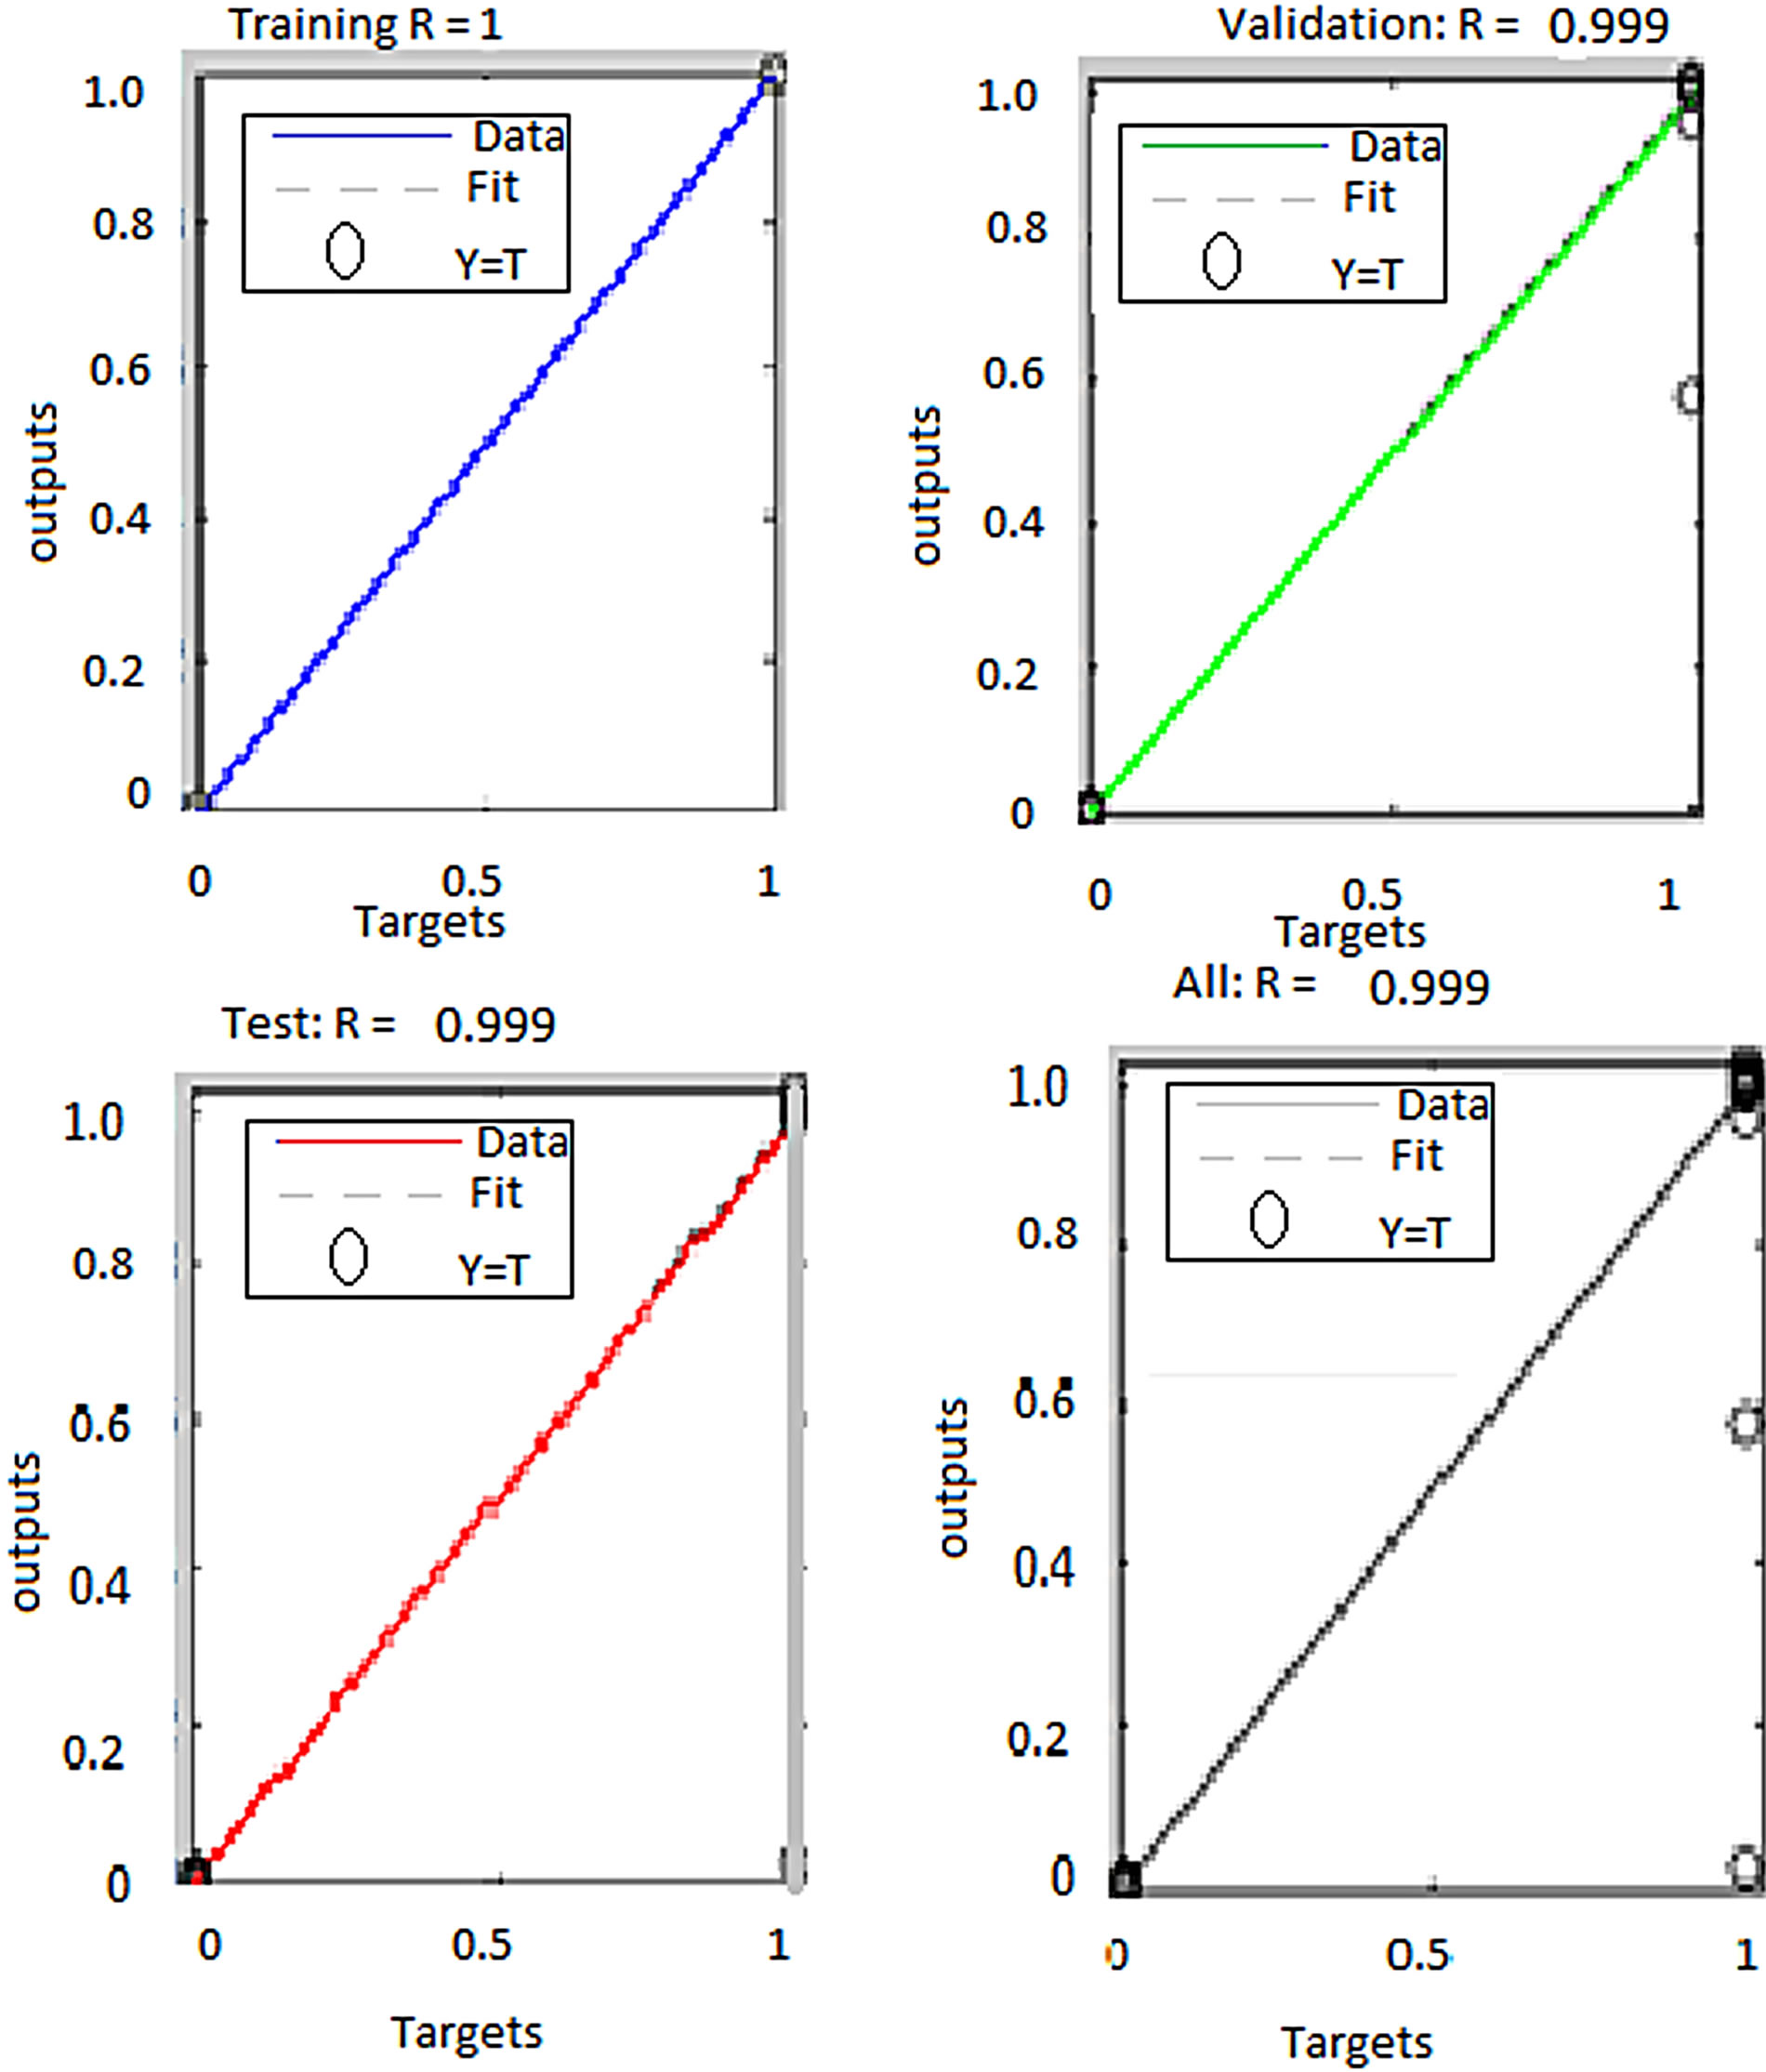
Figure 10. Performance of ANN trained with RGB features to segment plasmodium parasites.
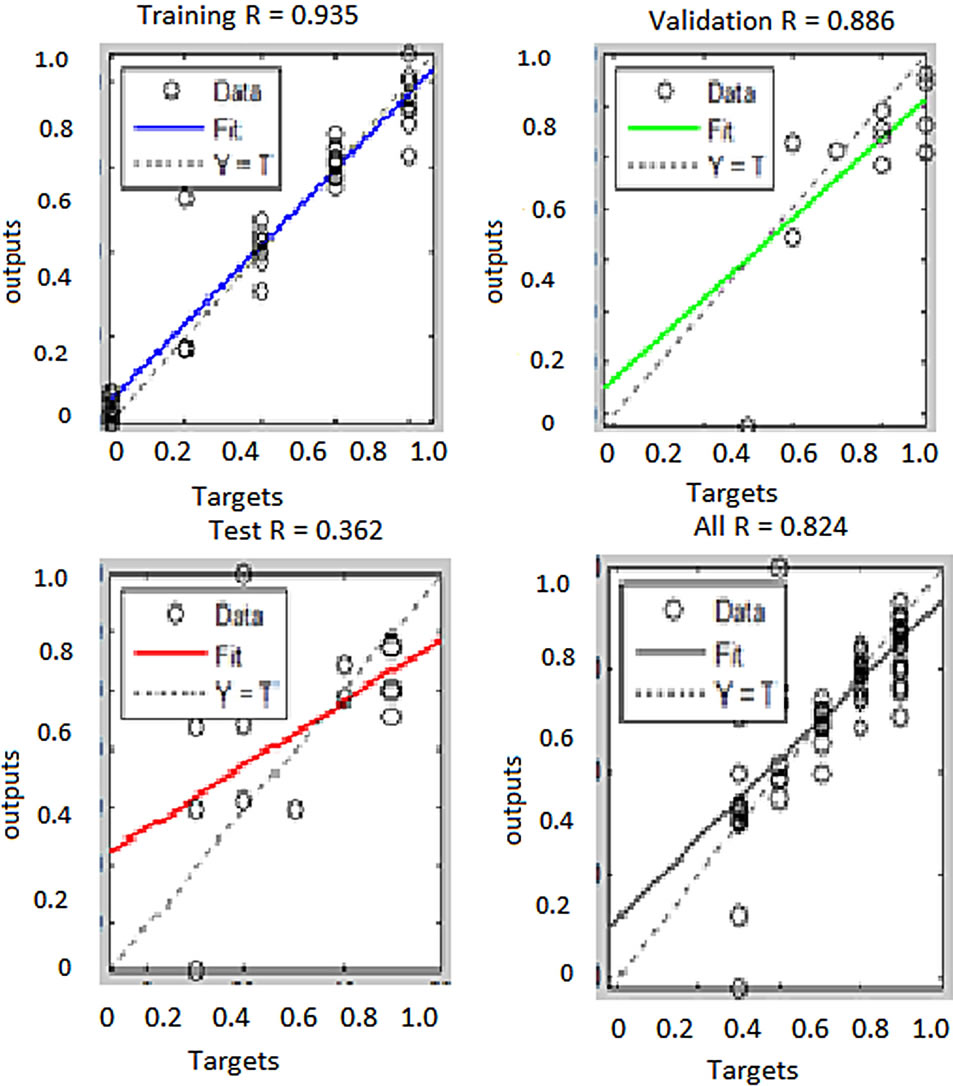
Figure 11. Performance of ANN trained with RGB and HSI features to segment to segment plasmodium parasites.
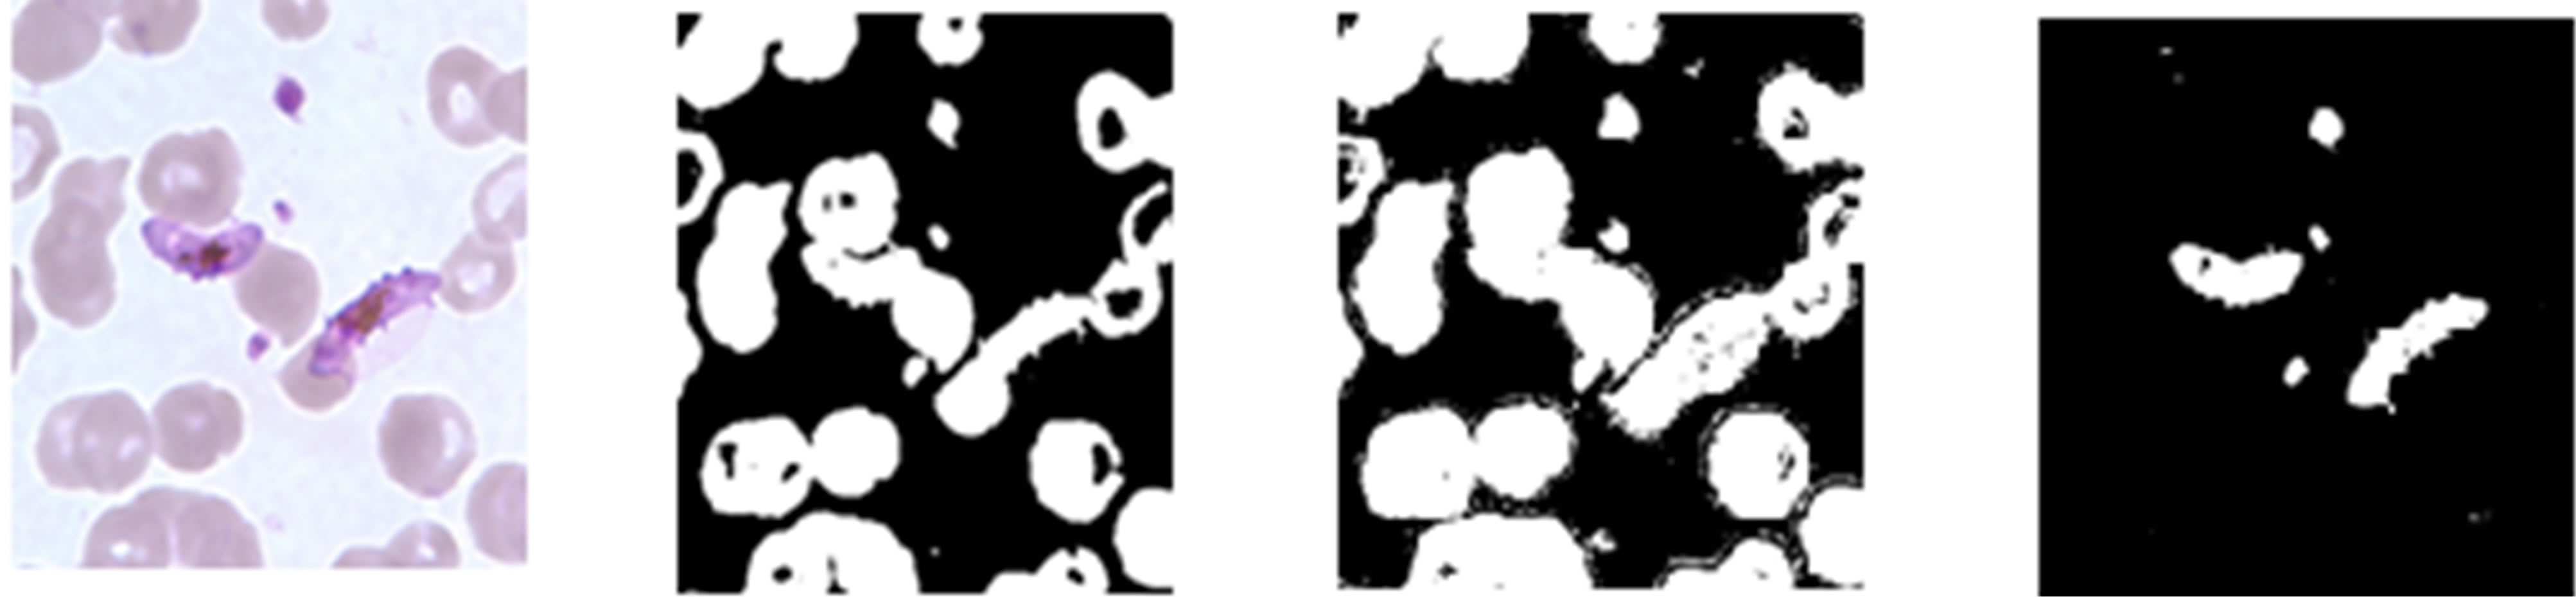
mension of the feature vector is increase, the number of training examples should also be increased for the network performance to improve [16,17]. Therefore since the number of training examples was the same for both networks the performance of the network trained with more features did not translate to improved classification accuracy. Using ANN trained with RGB features, plasmodium parasites were segmented from the two images used previously in histogram segmentation technique. The results are presented in Figure 12.
As can be seen from Figures 12(b) and (d), the neural network classifier managed to segment plasmodium parasites correctly for both KEMRI and CDC images. Figure 12(d) shows that the network correctly detected regions infected with plasmodium parasites and didn’t miss-classify erythrocytes as parasites as was the case in histogram segmentation. This indicates that ANN trained with RGB features can segment erythrocytes and plasmodium parasites more accurately than histogram thresholding.
12. ALGORITHM FOR PLASMODIUM PARASITE DETECTION
Using the decisions made in the system design methodology, a system for detection of plasmodium parasites was developed. A block diagram of the system is shown in Figure 13.
This system was then tested using a total of 205 images. 120 images were captured from KEMRI samples
 (a)
(a)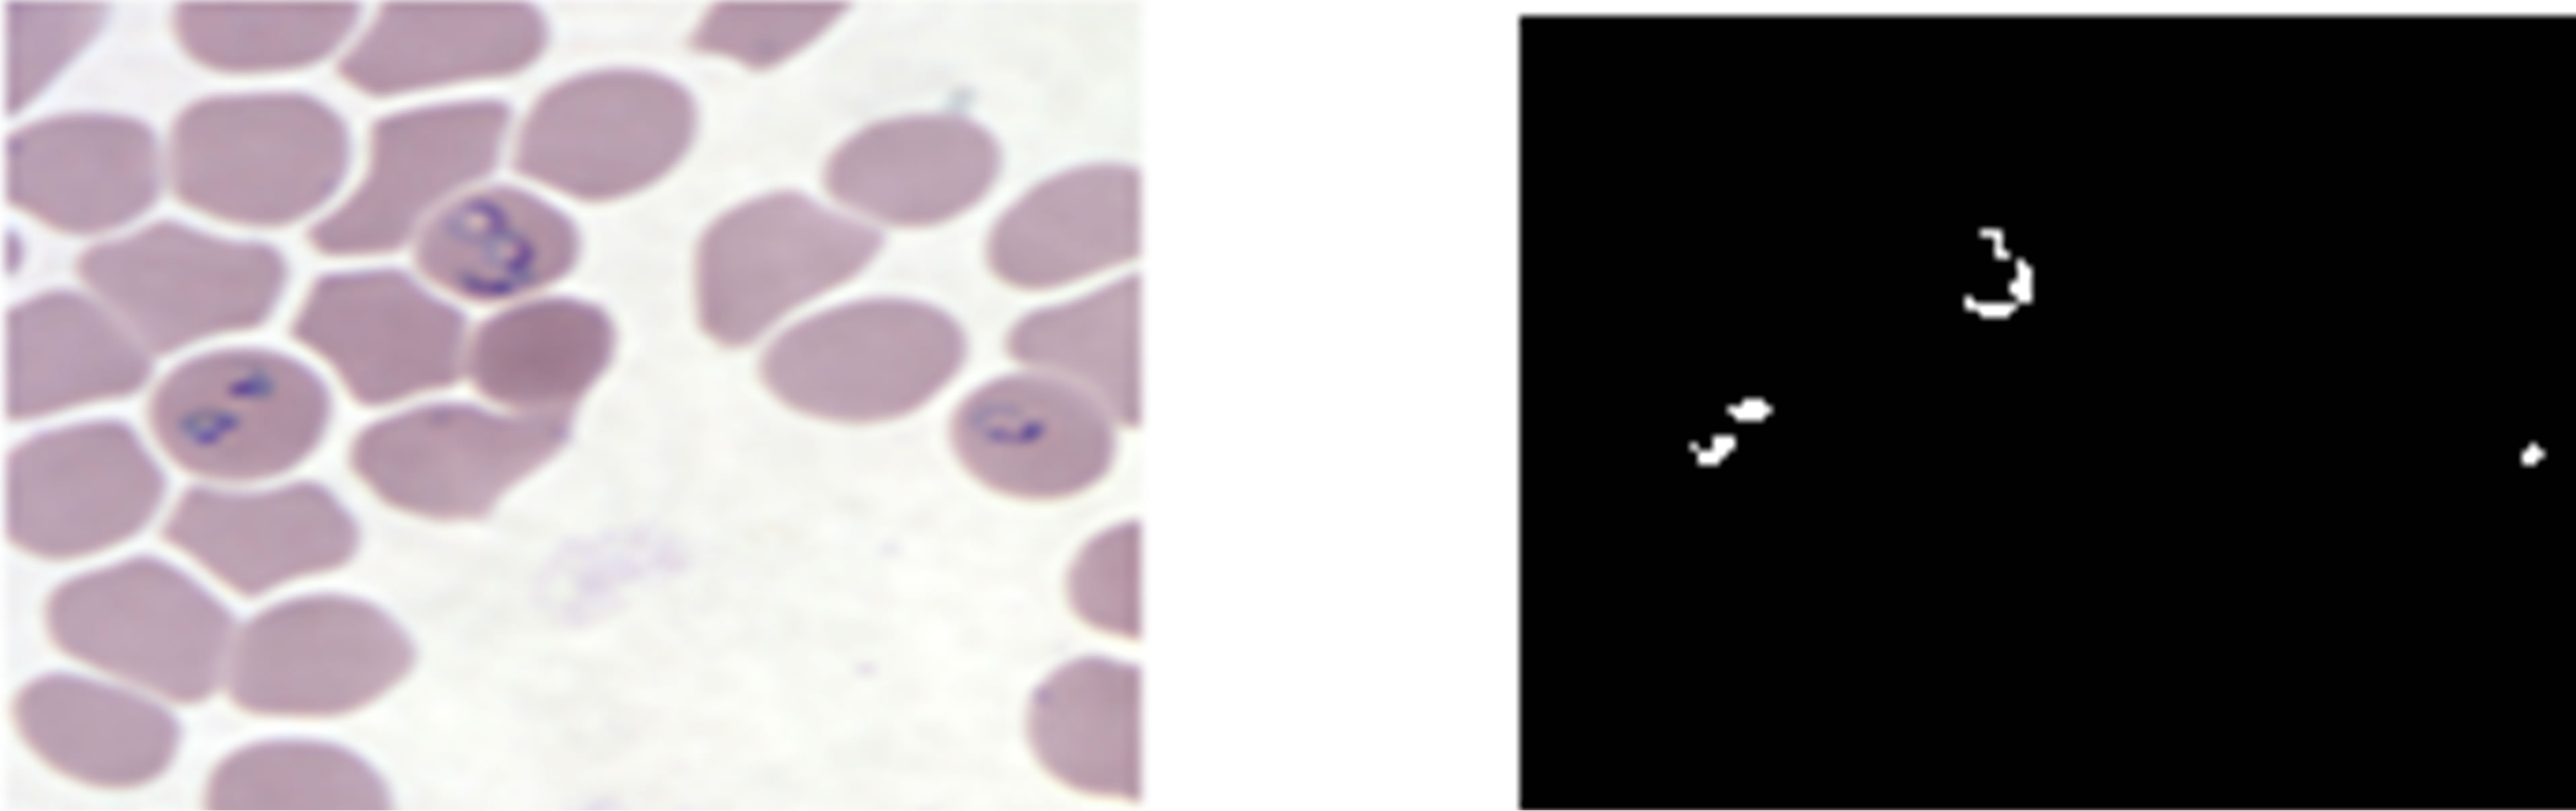 (b)
(b)
Figure 12. ANN plasmodium parasites segmentation; (a) and (c) pre-processed KEMRI and CDC images respectively, (b) and (d) their corresponding binary images of plasmodium parasites.
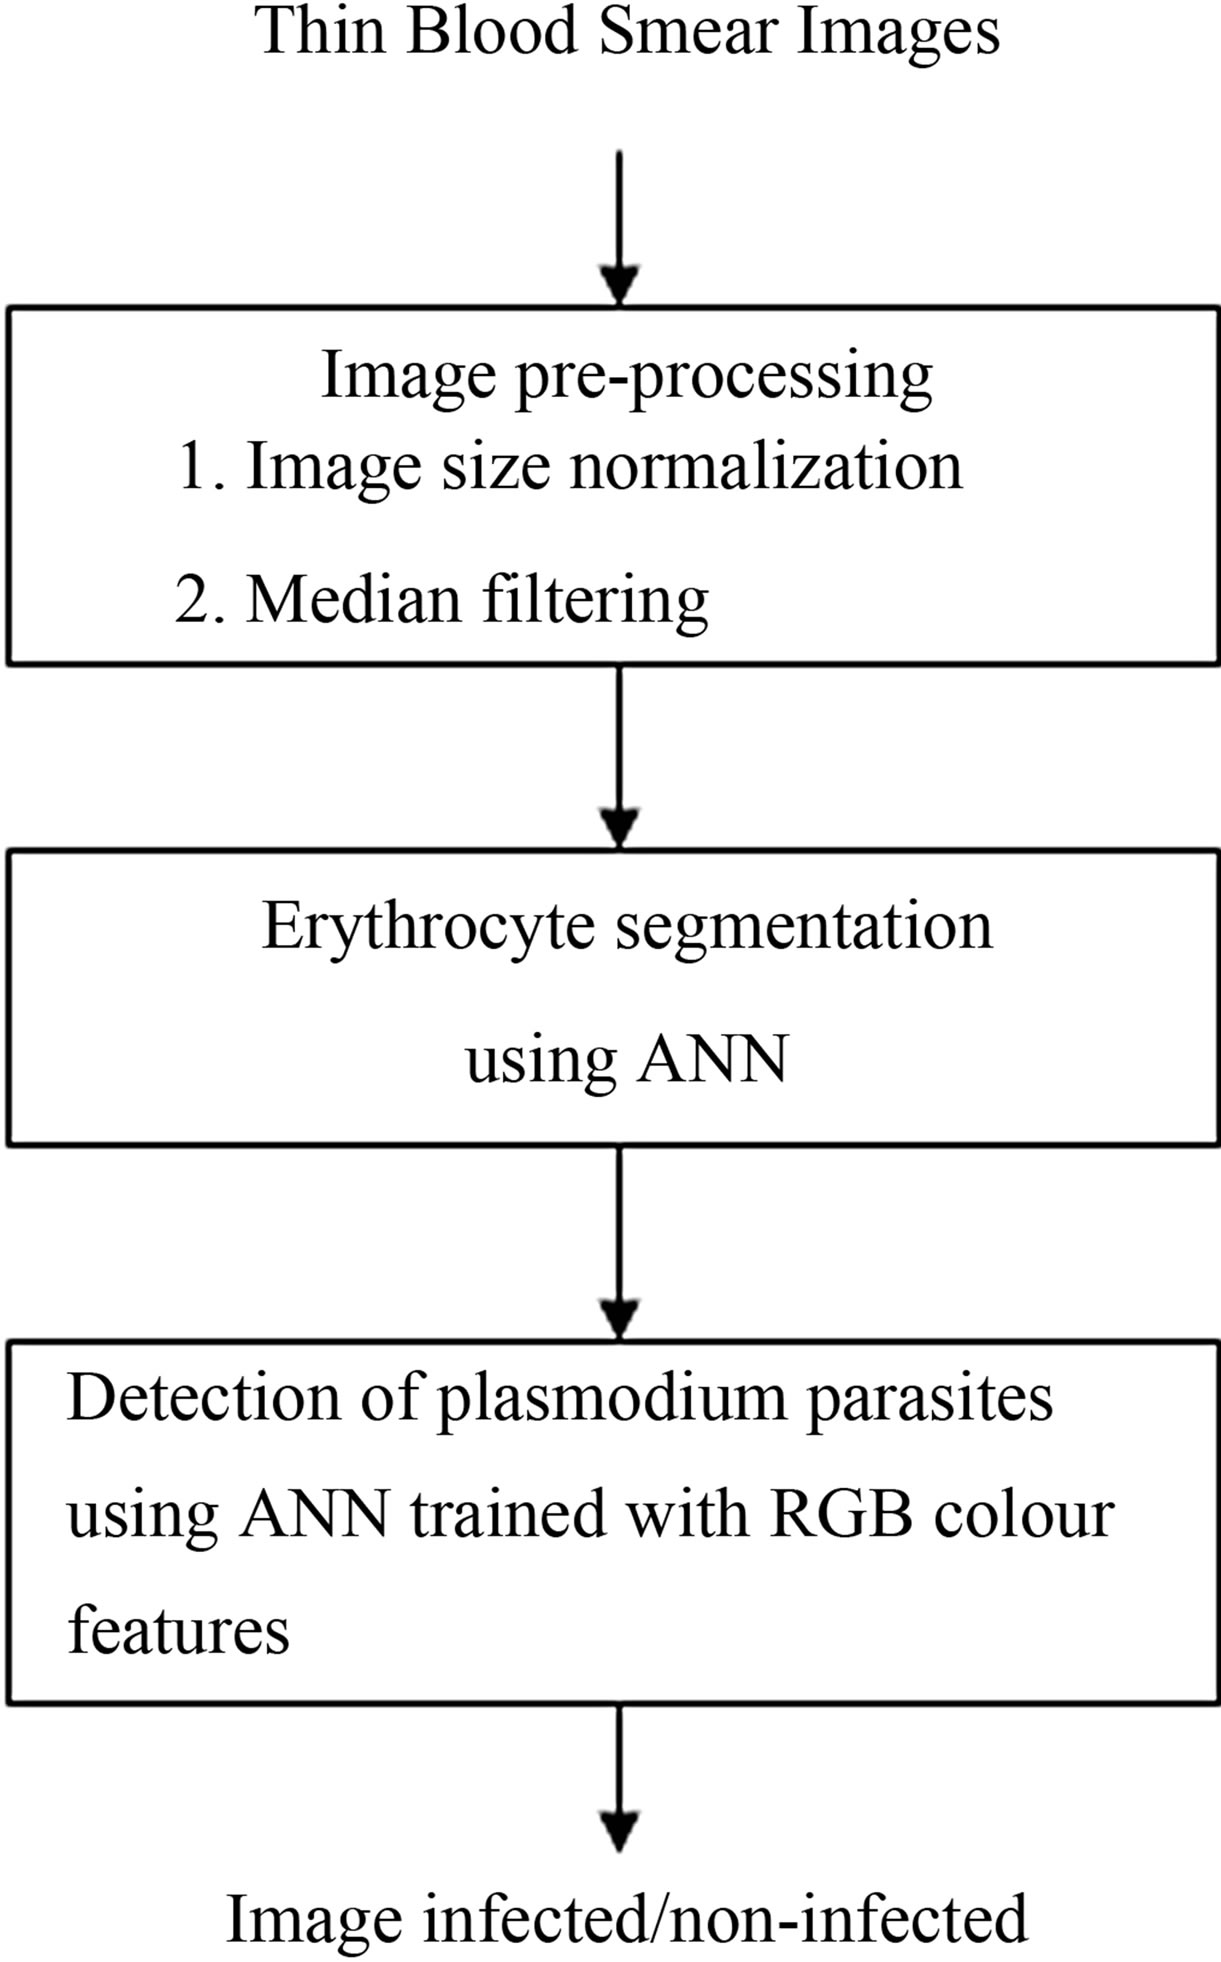
Figure 13. Algorithmic steps for detection of plasmodium parasites.
while 80 were obtained from CDC online image library. From these images, a total of 305 erythrocyte sub-images were cropped. 205 sub-images comprised of infected erythrocytes while 100 images were non-infected.
13. RESULTS AND DISCUSSION
Detection of plasmodium parasites was done by a trained multilayer back propagation neural network. The network was trained with RGB colour features as this was found to be the most accurate method of detecting plasmodium parasites. The network searched through the images and identified regions infected by plasmodium parasites.
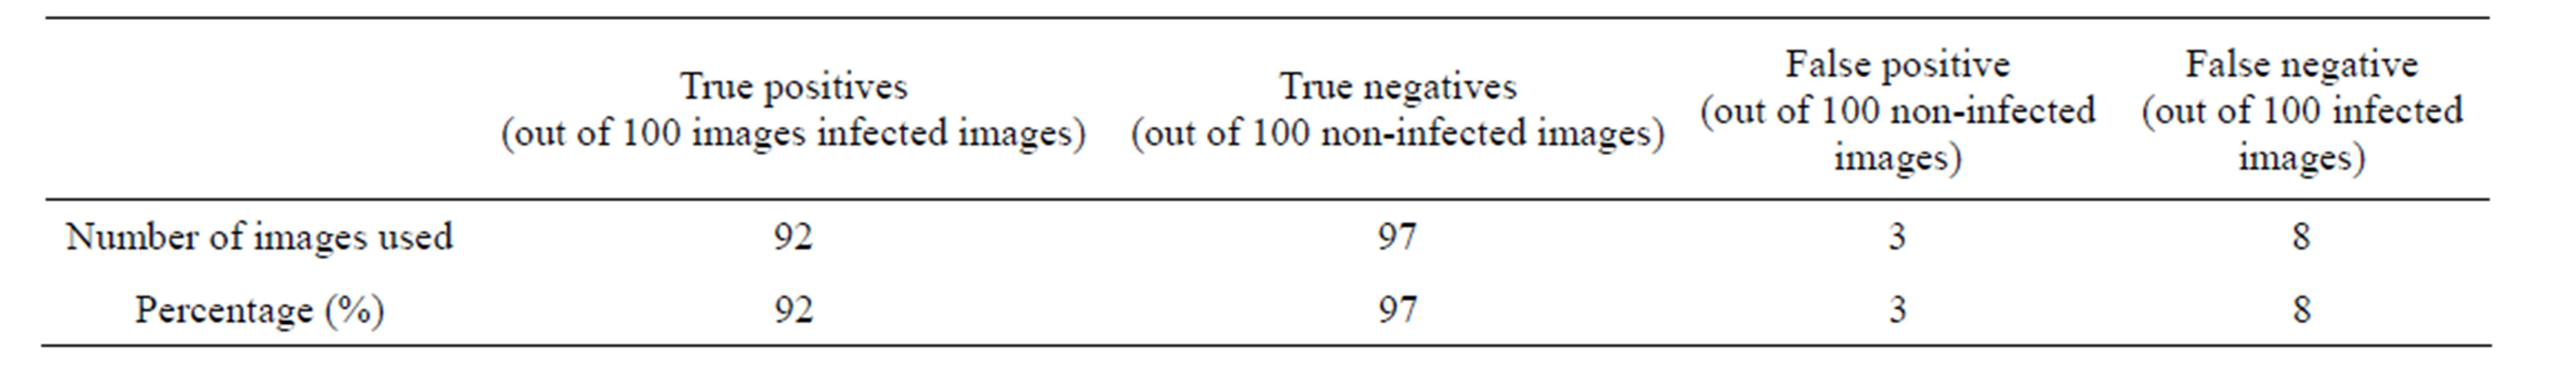
Table 7. Plasmodium parasite detection accuracy.
In order to evaluate the effectiveness of this stage, four metrics were used. These are: True Positives (TP), True Negatives (TN), False Positives (FP), and False Negatives (FN). The TP and TN represented the number of erythrocytes diagnosed by the diagnosis system correctly either as infected or not infected. The FP represented the number of erythrocytes diagnosed by the system as infected while as they were actually not infected. Finally, FN represented the number of erythrocytes classified as not infected while they were actually infected.
A total of 200 images were used to test the accuracy of the ANN in detection of plasmodium parasites. 100 images had infected erythrocytes while the other 100 images were not infected. The results obtained were tabulated in Table 7.
From the results, the overall detection accuracy was 95%. Out of the total 200 erythrocytes images used, only 11 were falsely classified. This therefore indicates that artificial neural network trained with RGB colour features can be an effective tool for detection of plasmodium parasites. The performance of algorithm developed in this work out performed that of Ross et al. [8] that recorded 85% parasite detection accuracy. In that work, a total of 37 features were used to train ANN classifier to detect plasmodium parasite. There were a total of 305 samples used to train the network. These were colour features, geometric features and shape features. The current study shows that the performance of ANN classifier can be improved by reducing the dimensionality of the feature vector used as the training set. Specifically, from the results, it can be observed that RGB colour features are sufficient to distinguish plasmodium parasites.
14. CONCLUSIONS
A system for detecting plasmodium parasites using images of thin blood smears stained with Giemsa was developed. The outputs of the system were compared to the results of expert microscopists. A total of 205 images were used to train and test the performance of the system. The system recorded 95% accuracy in detecting the presence of plasmodium parasites.
In this work, a novel technique of image segmentation using artificial neural networks trained with pixel values of RGB colour space was developed. The technique was used in segmentation of erythrocytes and plasmodium parasite regions. The results of plasmodium parasites detection showed that ANN classifier trained only with RGB colour features performed better than when the same classifier is trained with both RGB and HSI feature. It was therefore concluded that detection of plasmodium parasites can be adequately performed by a neural network classifier trained with RGB colour features of the parasite images.
Another notable contribution made in this study was the development of a technique for determining the threshold value for segmenting plasmodium parasites from the rest of the blood smear images. The algorithm is a modification of Zack’s algorithm for determining global minimum in an image histogram.
REFERENCES
- World Health Organization (2010) World Malaria Report.
- Snow, R.W., Guerra, C.A., Noor, A.M., Myint, H.Y. and Hay, S.I. (2005) The global distribution of clinical episodes of plasmodium falciparum malaria. Nature, 434, 214-217. http://dx.doi.org/10.1038/nature03342
- Warhurst, D.C. and Williams, J.E. (1996) Laboratory diagnosis of malaria: ACO broadsheet no. 148. Journal of Clinical Pathology, 49, 533-538. http://dx.doi.org/10.1136/jcp.49.7.533
- Balisle, J.M., Costantino, S., Leimanis, M.L., Bellemare, M.J., Bohle, D.S., Georges, E. and Wiseman, P.W. (2007) Sensitive detection of malaria infection by third harmonic generation imaging. Biophysical Journal’s BioFAST, 94, L26-L28.
- Beadle, C., Long, G.W., Weiss, W.R., P.D. McElroy, Maret, S.M., Oloo, A.J. and Hoffman, S.L. (1994) Diagnosis of malaria by detection of p. falciparum HRP-2 antigen with a rapid dipstick antigen—Capture assay. Lancet, 343, 564-568. http://dx.doi.org/10.1016/S0140-6736(94)91520-2
- Report of Joint WHO/USAID (2005) New perspectives of malaria diagnostics, informal consultations. 25-27 October 1999.
- WHO (2004) The role of laboratory diagnosis to support malaria disease management: Focus on the use of rapid diagnostic tests in the areas of high transmission.
- Ross, N.E., Pritchard, C.J., Rubin, D.M. and Duse, A.G. (2006) Automated image processing method for the diagnosis and classification of malaria on thin blood smears. Medical & Biological Engineering & Computing, 44, 427-436. http://dx.doi.org/10.1007/s11517-006-0044-2
- Tek, F.B., Dempster, A.G. and Kale, I. (2009) Computer vision for microscopy diagnosis of malaria. Malaria Journal, 8, 153. http://dx.doi.org/10.1186/1475-2875-8-153
- Diaz, G., Gonzalez, F.A. and Eduardo, R. (2009) A semiautomatic method for quantification and classification of erythrocytes infected with malaria parasites in microscopic images. Journal of Biomedical Informatics, 42, 296-307. http://dx.doi.org/10.1016/j.jbi.2008.11.005
- Di Ruberto, R.C., Dempster, A., Khan, S. and Jarra, B. (2002) Analysis of infectedblood cell images using morphological operators. Image and Vision Computing, 20, 133-146.
- (2011) http://www.kemri.org
- (2011) http://www.dpd.cdc.gov/dpdx/HTML/ImageLibrary/Malaria_il.htm
- Zack, G.W., Rogers, W.E. and Latt, S.A. (1977) Automatic measurement of sister chromatid exchange frequency. Journal of Histochemistry and Cytochemistry, 25, 741. http://dx.doi.org/10.1177/25.7.70454
- Otsu, N. (1979) A threshold selection method from gray level histograms. IEEE Transactions on Systems, Man, and Cybernetics, 9, 62-66.
- Foley, D.H. (1972) Consideration of sample and feature size. IEEE Transactions on Information Theory, 18, 618- 626. http://dx.doi.org/10.1109/TIT.1972.1054863
- Hughes, G.F. (1968) On the mean accuracy of statistical pattern recognition. IEEE Transactions on Information Theory, 14, 55-63. http://dx.doi.org/10.1109/TIT.1968.1054102