Open Journal of Genetics
Vol.4 No.2(2014), Article ID:45335,7 pages DOI:10.4236/ojgen.2014.42018
Genetic Diversity and Structure of East African Tall Coconuts in Tanzania Using RAPD Markers
Linus I. Masumbuko*, Salama Sinje, Alois Kullaya
Mikocheni Agricultural Research Institute, Dar es Salaam, Tanzania
Email: *linusmasumbuko@yahoo.ie
Copyright © 2014 by authors and Scientific Research Publishing Inc.
This work is licensed under the Creative Commons Attribution International License (CC BY).
http://creativecommons.org/licenses/by/4.0/


Received 19 February 2014; revised 15 March 2014; accepted 14 April 2014
ABSTRACT
RAPD markers were used to estimate levels of genetic diversity and structure among twelve East African Tall (EAT) coconut (Cocos nucifera L.) accessions that are maintained at Chambezi station. Ten primers were used in the analysis of 120 accessions. Cluster analysis was performed based on Jaccard’s coefficient and Nei genetic distances. Further analyses included principal coordinate analysis (PCA) and finally bootstrap analysis. The cluster analysis revealed two main clusters. One cluster contained provenances from Lindi and Mtwara regions (south) and those from Coast and Dar es Salaam regions (central); the second had provenances from Tanga region, which is the northern part of the coastal belt. A similar distribution of provenances was shown by the results of the principal coordinate analysis, whose first three co-ordinates explained 56% of the total variation. The results were able to discriminate between the different provenances and provide evidence of the different origins for the coconut palms in the northern and southern parts of coastal coconut-growing belt. The two major clusters concur well with the history and distribution of coconuts in the coastal belt of Tanzania.
Keywords:Cocos nucifera L., RAPD, Genetic Diversity, Nei Genetic Distance

1. Introduction
The coconut palm (Cocos nucifera L.), a smallholder crop in Tanzania, is an important source of vegetable oil in the coastal belt and the Zanzibar islands. It provides food, drink, income, shelter and job opportunities to millions of people in Africa, as well as raw materials to the industry. It plays an important role in the sustainability of the agricultural systems in the often-fragile ecosystems of the tropical coastal belts [1] .
Tanzania has a coconut improvement programme whose main objective is to breed high yielding varieties that are resistant or tolerant to prevailing biotic and abiotic stresses. Owing to the coconut’s long generation time, coconut-breeding research is an expensive and a time-consuming undertaking. The East African Tall (EAT) ecotypes are the most predominant; they include all the indigenous tall coconut types that are traditionally cultivated along the East African coast i.e. Kenya, Tanzania and Mozambique. The Mikocheni Agricultural Research Institute (MARI) coconut germplasm collection at Chambezi has more than 30 EAT provenances, whose accessions are being screened in disease resistance trials. These were collected from different geographical locations along the Tanzania and Kenyan coasts. The EAT exhibits differences in morphological traits such as colour, size and shape of the fruit, robustness of the trunk and size of the crown. Reaction to biotic and abiotic stresses is evident. This is strongly influenced by the environment. Thus it is extremely important that the different genetic materials are well characterized and evaluated, hence the need for employing a reliable method of characterisation that is not influenced by the environment, i.e. DNA markers.
DNA marker techniques have been employed to estimate genetic diversity of different coconut germplasm [2] [3] . In [4] simple sequence repeats (SSRs) markers were employed on DNA from 24 coconut leaf samples to evaluate genetic diversity of coconuts from Yap state of the Federated States of Micronesia. They were able to confirm the high genetic diversity and the cross-pollinating nature of coconuts. SSRs have also been used in [5] to investigate the level of genetic diversity, distribution of genetic variation and genetic relatedness in coconut genotypes.
This study was aimed at, firstly, molecular characterisation of accessions from twelve provenances present in the coconut germplasm bank and secondly estimating levels of genetic similarity among the local coconut provenances in the coconut germplasm bank.
2. Materials and Methods
Leaf Materials
Samples were taken from spear leaves of ten randomly selected accessions from each of twelve Tanzanian provenances. These provenances form part of the thirty EAT provenances that are being maintained as active collection at the coconut field gene-bank at Chambezi Research Station. The accessions were established using seed nuts collected from the following locations: Livestock Breeding Station (LBS), Boza, Vuo and Mwambani in Tanga Region which is the northern part of the coastal belt; Chambezi Green, Chambezi Brown, R.C. Bagamoyo and Tumaini representing the central coastal belt and Kilwa Singino, Mtoni, Ng’apa and Msanga Mkuu representing the southern coastal belt locations, the respective regions and abbreviations used in the analysis are shown in Table 1 and Figure 1 shows the five regions form where the coconut seeds originated.

Table 1. Names of coconut provenances and their regions of origin.
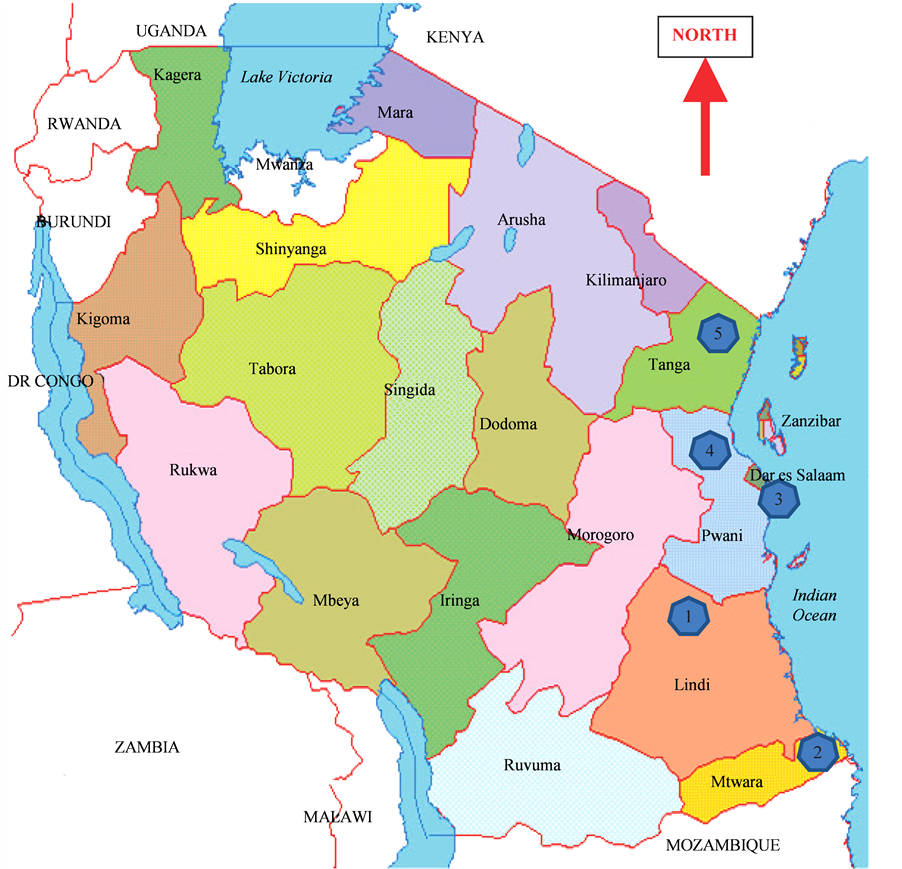
Figure 1. Map of Tanzania showing the five coastal regions where coconut materials for the analysis originated (Lindi, Mtwara, Dar es Salaam, Pwani and Tanga).
3. DNA Extraction and Amplification
Genomic DNA was extracted from 5 gm of leaf material according to modified [6] procedure. The DNA quantity was determined by a spectrophotometer and its integrity was examined electrophoretically on a 1.2% agarose gel.
4. DNA Amplification
Amplification of the genomic DNA was performed according to standard PCR protocols in a final volume of 20 µl containing: 25 ng of genomic DNA; 1× PCR buffer; 2.5 mM MgCl2; 0.2 mM dNTPs; 0.25 pM of primer and 1 unit of Taq DNA polymerase. For the 12 sub-populations the following Operon primers were used for DNA amplification: OPA 01, OPA 07, OPA 09, OPAW15, OPB 01, OPB 06, OPB 07, OPC 16, OPE 05 and OPE 12. DNA amplification was done using a Genius, (C) Techne 1997 Ver. 2.06 Block C thermocycler. The following five step programme was used: 94˚C for 3 minutes; 94˚C for 1 minute; 35˚C for 1 minute; 72˚C for 2 minutes; 72˚C for 10 minutes, with 40 cycles between steps 4 and 2. PCR products were visualised by UV light after electrophoresis in a 1.5% gel stained with ethidium bromide at a concentration of 0.5 µg/ml.
5. Data Analysis
A matrix was created by scoring polymorphic bands as“1” for present or “0” when absent. The matrix was subjected to analysis using EXCEL, NTSYS and the MAPRF6-DDAT program developed by E. Ritter, Neiker, Apartado 46, 01080 Vitoria, Spain. A coefficient [7] was employed to generate a dissimilarity matrix of the 120 accessions. Dissimilarity values were calculated from the resulting dissimilarity matrix and a dendrogram generated after analysing the matrix by unweighted pair-group method arithmetic averages (UPGMA) method [8] , of the NTSYS_PC version 2.1 ©Applied Biostatistics, Inc. USA. A cophenetic matrix was computed, in order to measure the goodness of fit, by comparing the obtained tree matrix with the dissimilarity matrix. Further analysis involved performing a principal coordinate analysis (PCA) and a cluster analysis based on a genetic distance [9] . Population frequencies were finally used to generate a matrix for bootstrap analysis with 5000 replications. Standard genetic distances [10] and a dendrogram showing bootstrap values were obtained from this analysis.
6. Results
The analysis produced 82 fragments. Data deriving from the dissimilarity matrix showed genotypes Ng’apa 5/Ng’apa 9, and Tumaini 1/Vuo 8 having dissimilarity values of 0.05 and 1.0 respectively. The average dissimilarity value for the 120 genotypes was 0.42. The cophenetic matrix and the original dissimilarity matrix showed a significant correlation of 96%. The average dissimilarity values within and between the twelve sub-populations are presented in Table 2. Bagamoyo provenance had the highest within-provenance dissimilarity value (0.61), while Ng’apa and Chambezi green revealed the lowest, (0.23). Bagamoyo/Msanga Mkuu and Bagamoyo/ Vuo provenances had the highest between-provenances dissimilarity values (0.59), while Chambezi Green/Ng’apa had the lowest value of 0.29.
A dendrogram of all the 120 genotypes (not shown) had many of the accessions grouping according to their geographic origin; however, not every accession from a particular provenance were in one clustered. Some accessions were scattered into other provenances. Despite this, two notable divisions were evident on the dendrogram. Accessions from the Mtwara, Lindi, Coast and Dar es Salaam regions (south and central parts of Tanzanian coast), formed one group and those from Tanga (north) were in another. There was a smaller group that had a mixture of accessions from different provenances. The PCA, whose plot of the first three coordinates explained 56% of the variation, showed a similar trend of the distribution of accessions (Figure 2). The standard genetic distances [10] ranged from 0.03 between Mwambani/Vuo and Boza/LBS provenances, to 0.18 between Bagamoyo/Mtwara and Bagamoyo/Ng’apa provenances (Table 3).
Table 2. Within and between population dissimilarity values.
Table 3. Standard genetic distances of 12 coconut subpopulations.
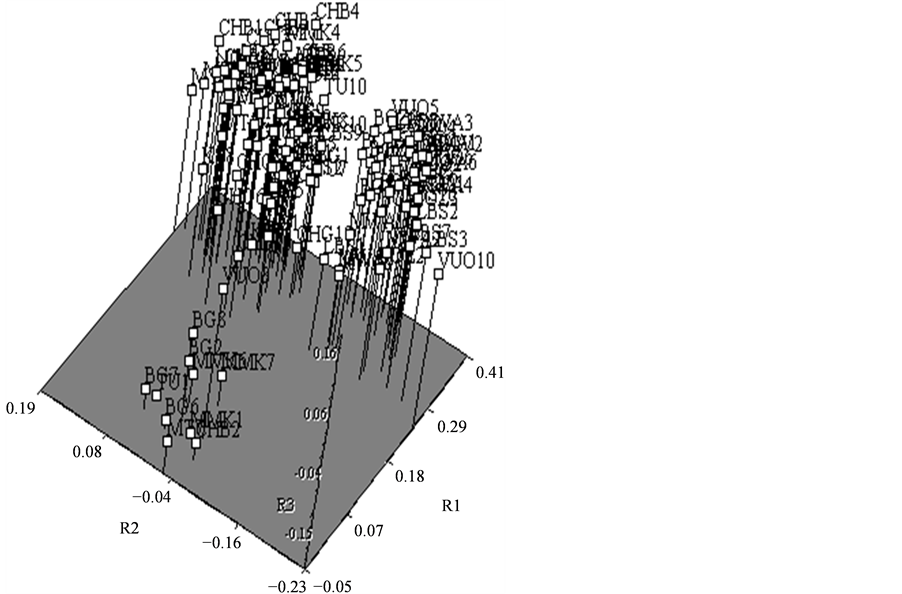
Figure 2. Principal component analysis of accessions from 12 EAT provenances from Tanzania.
Cluster analysis of the provenances using genetic distances [9] , revealed two main clusters with three subclusters in the first and two in the second cluster (Figure 3). One main cluster contained provenances from the southern regions of Lindi and Mtwara (south) and those from Coast and Dar es Salaam regions (central), while the second cluster had provenances from Tanga region, which is the northern part of the coastal belt (Figure 3). A similar pattern was shown with the bootstrap analysis using genetic distances [10] (Figure 4), although, all of the bootstrap values but four, were below fifty.
7. Discussion
The scattering of some accessions into other provenances can be explained by two reasons, first, the out-crossing

Figure 3. UPGMA tree of twelve coconut provenances using Nei (1978) genetic distances.
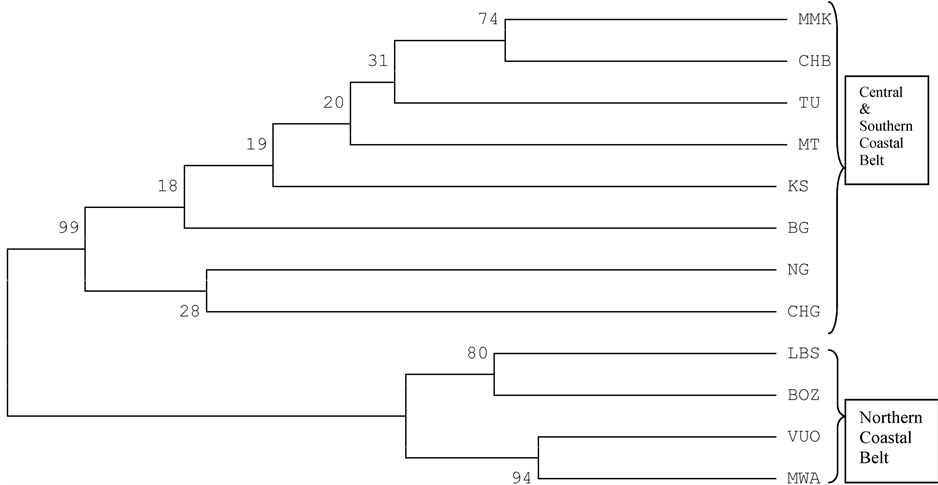
Figure 4. UPGMA dendrogram using NEI et al. (1983) distances.
nature of the EAT coconuts and secondly, the fact that in the course of promoting coconut cultivation in the country, seed nuts were moved from one locality to another through human intervention. The grouping of coconut provenances into south/central and north groups (Figure 3) corresponds well with historical facts on the spread and distribution of coconut palms in Tanzania. At the onset of the German colonial rule in Tanganyika, 75% of the coconut palms grew in the Tanga and Pangani districts, while only 4% grew in the southern Kilwa and Lindi districts [11] . Coconut palms in the southern coconut-growing belt have a more recent history. The German authorities encouraged most of the plantings in the south with imports from or via Mafia and the Comoros; other possible sources were the German Pacific possessions.
Both natural dispersal and intervention by man played an important role in the distribution and dispersal of the coconut palm. Coconut groves in the coastal belt of Muheza and Tanga districts from the Kenya border down to well south of Tanga, are of the oldest origin in the country [11] . Trade by Indian merchants along the East African coast is another possible origin of the Tanga (north), coconut palms. Arabian and Persian migrants who colonised the East Coast later followed and they played an important role in the distribution of the crop in East Africa [12] .
Results of this study show that RAPD markers were able to discriminate between different provenances of EAT coconuts. They also suggest that the coconut palms in the northern and southern part of the coastal belt of Tanzania have different origins. The two major clusters coincide well with the history and distribution of coconut palms in the coastal belt of Tanzania. A repeat of this exercise with a more robust marker technique e.g. microsatellites, would provide useful data to supplement this study.
Acknowledgements
This study was part of an EU-funded project titled: “Improvement of coconut by biotechnology: Application of DNA marker technology to germplasm characterization and breeding”.
References
- Persley, G.J. (1992) Replanting the Tree of Life. Towards an International Agenda for Coconut Palm Research. Redwood Press Ltd., Melksham.
- Ashburner, G.R., Thompson, W.K. and Halloran, G.M. (1997) RAPD Analysis of South Pacific Palm Populations. Crop Science, 37, 992-997. http://dx.doi.org/10.2135/cropsci1997.0011183X003700030048x
- Rohde W., Kullaya, A., Rodriguez, J. and Ritter, E. (1995) Genome Analysis of Cocos nucifera L. by PCR Amplification of Spacer Sequences Separating a Subset of copia-Like EcoRI Repetitive Elements. Journal of Genetics and Breeding, 49, 179-186.
- Katsuyuki, I., Megumi, H., Noriyuki, K., Hiroshi, N., Michio, O., Katsui, T. and Shigeto, T. (2003) Genetic Diversity of Coconuts (Cocos nucifera L.) in Yap State. Kagoshima University Research Centre for the Pacific Islands Occasional Papers No. 39, Kagoshima, 45-49.
- Perera, L., Russel, J. R., Provan, J. and Powell, W. (2000) Use of Micro Satellite DNA Markers to Investigate the Level of Genetic Diversity and Population Genetic Structure of Coconut (Cocos nucifera L.). Genome, 43, 15-21. http://dx.doi.org/10.1139/g99-079
- Doyle, J.J. and Doyle, J.L. (1990) Isolation of Plant DNA from Fresh Tissue. Focus, 12, 13-15.
- Jaccard, P. (1908) Nouvelles recherches sur la distribution floralle. Bulletin de la Société Vaudoise des Sciences Naturelles, 44, 223-270.
- Sneath, P.H.A. and Sokal, R.R. (1973) Numerical Taxonomy. W. H. Freeman & Co, San Francisco.
- Nei, M. (1978) Estimation of Average Heterozygosity and Genetic Distance from a Small Number of Individuals. Genetics, 89, 583-590.
- Nei, M., Tajima, F. and Tateno, Y. (1983) Accuracy of Estimated Phylogenetic Trees from Molecular Data. Journal of Molecular Evolution, 19, 153-170. http://dx.doi.org/10.1007/BF02300753
- Schuiling, M. (1991) The History of Coconut Growing and Lethal Disease in the Coastal Districts of Mainland Tanzania and Its Possible Relevance to Disease Resistance in the Local East African Tall. National Coconut Development Programme, Dar es Salaam.
NOTES

*Corresponding author.