Advances in Biological Chemistry
Vol. 3 No. 1 (2013) , Article ID: 28102 , 6 pages DOI:10.4236/abc.2013.31009
Glucocorticoid-induced alterations in titin, nebulin, myosin heavy chain isoform content and viscoelastic properties of rat skeletal muscle
![]()
1Institute of Exercise Biology and Physiotherapy, University of Tartu, Tartu, Estonia
2Institute of Physics, University of Tartu, Tartu, Estonia
3Institute of Sport Pedagogy and Coaching, University of Tartu, Tartu, Estonia
4Institute of Mathematical Statistics, University of Tartu, Tartu, Estonia
Email: *karin.alev@ut.ee
Received 29 November 2012; revised 30 December 2012; accepted 29 January 2013
Keywords: Viscoelastic Properties; Skeletal Muscle Atrophy; Myotonometry; Cytoskeletal Proteins; Glucocorticoids
ABSTRACT
Viscoelastic properties of skeletal muscle are associated with a complex network of cytoskeletal proteins where titin and nebulin play a substantial role. The need for evaluation of muscle viscoelastic properties is widely accepted in clinical use to evaluate the effect of treatment or progression of muscle pathology (atrophy). We tested the hypothesis that the viscoelastic properties (elasticity, tone and stiffness) change in atrophied muscles with concomitant changes in cytoskeletal proteins (titin, nebulin) and contractile protein (myosin heavy chain) proportion. Sixteen 24- week-old male rats of the Wistar strain were randomly allocated to two groups: dexamethasone group treated each day for 10 consecutive days with dexamethasone in order to induce atrophy and control group. Skeletal muscle viscoelastic properties (elasticity, tone and stiffness) were determined using a myotonometer. Titin, nebulin and myosin heavy chain content were quantified using SDS-PAGE electrophoresis. We found that glucocorticoid-induced muscle atrophy is accompanied by reduced elasticity and increased tone and stiffness, with concomitant changes in titin, nebulin and myosin heavy chain content. The elasticity decreased by 10.9% (P < 0.05), tone increased from 26.69 Hz to 37.73 Hz (P < 0.05), and stiffness was significantly lower in dexamethasone group (627.3 N/m vs 758.6 N/m); (P < 0.05). Compared with the control group, the content of titin, nebulin and myosin heavy chain in atrophied muscle was 76.4%, 70.6% and 82.3%, respectively. Our results may lead to a better understanding of the mechanism of muscle atrophy and provide better guidance for rehabilitation practices and help to find rational therapeutic intervention in the future.
1. INTRODUCTION
The function and properties of skeletal muscle are complex and consist of integrated functions of several structures. The need for evaluation of muscle viscoelastic properties is widely accepted in clinical use to evaluate the effect of treatment or progression of pathology (atrophy).
Elastic properties of skeletal muscle are associated with a complex network of cytoskeletal proteins where titin and nebulin play a substantial role. Nebulin is a part of thin filament. Titin forms a third myofilament system connecting the A-band to the I-bands and Z-line and possess particularly elastic properties. In addition to their structural role, titin and nebulin are involved in the production of active and passive tension in the muscle [1-3].
Glucocorticoids (GCs) are the most potent immunosuppressive and anti-inflammatory drugs widely used for the treatment of patients with a variety of disorders. The application of glucocorticoids has been limited due to the side effects, especially upon long-term and high doses. The catabolic effects of GCs on skeletal muscle are mediated via several cellular mechanisms. GCs inhibit muscle protein synthesis, stimulate protein degradation in skeletal muscle and are an important factor in the development of muscle atrophy. Muscle atrophy is characterised by a reduction in several muscle proteins, contributing to impaired muscle function. Dexamethasone is a synthetic compound that has anti-inflammatory effects similar to those of natural GCs.
The model of dexamethasone-induced atrophy has been used in several previous studies in our laboratory [4-7]. For example, the administration of glucocorticoids decreased the turnover rate of myosin heavy chain (MHC) and reduced the proportion of fast type MHC isoforms [5].
The changes in cytoskeletal proteins such as titin and nebulin have repeatedly been examined using different models of muscle atrophy: the relative amount of titin and/or nebulin decreases after hind-limb unloading [8,9], after denervation [10] and in the condition of alcohol myopathy [11]. Long-term disuse (6 wk immobilization) causes preferential loss of the sarcomeric protein titin content, which is associated with changes in muscle function [12]. The ratios of titin/MHC and nebulin/MHC decreased after unloading and denervation [10,13].
To our knowledge, only Hayashi et al. [14] has analysed titin content after administration of glucocorticoids and demonstrated a decrease in titin content after 4 days of corticosterone treatment in rat skeletal muscle.
Therefore, we tested the hypothesis whether the viscoelastic properties of atrophied muscle change with concomitant changes in titin and nebulin.
2. MATERIALS AND METHODS
2.1. Animals and Dexamethasone Treatment
The animals used in the study were male rats of the Wistar strain (Scanbur BK AS Sollentuna, Sweden) that were 24 weeks old at the beginning of the experiment.
The rats were assigned to control (Contr) (n = 8) and dexamethasone (Dex) (n = 8) groups. Dexamethasone (Dexafort 3 mg/ml; International B.V. Boxmeer, The Netherlands) was diluted to 200 µg/ml with 0.15 M NaCl and administered intraperitoneally at 100 µg/100 g body weight (bw) daily for 10 days. The control animals received appropriate amounts of 0.15 M NaCl. The animals were anaesthetised by intraperitoneal injection of ketamine (2.5 mg/100 g bw) (Calysol, Gedeon Richter A.O. Budapest, Hungary) and diazepam (2.5 mg/100 g bw) (Lab Renaudin, France). The experimental protocol was approved by the Animal Experimentation Committee at the Estonian Ministry of Agriculture.
2.2. Myometric Method
The central part of the muscle belly of the gastrocnemius muscle (Gas) of the anaesthetised rats was tested five times with a pause of 1 s. The testing end of the device was placed on the surface of the skin above the peripheral muscle under investigation. The electromagnet contained in the device produces a short constant force impulse, which is transmitted via the testing end to the contact area. The impulse terminates in a quick release, and this mechanical influence induces damped natural oscillation in the muscle under investigation [15]. This oscillation is picked up by the acceleration transducer situated on the testing end of the device. The acceleration of the first period of the oscillation, which is calculated from the oscillation graph, characterises the deformation of the muscle caused by the testing end. The acceleration is used to calculate the stiffness of the muscle (C), according to the following formulae: C = m·amax/Dl, where m is the mass of the testing end of myometer; amax is the maximal amplitude of oscillation, and Δl is the depth of the displacement of the testing end. The period of the natural oscillation (T [seconds]) that is performed by the oscillating muscle mass together with the mass of the testing end can be determined, and the frequency of oscillation of the muscle (f [Hz]) is calculated: f = 1/T [Hz]. The quantity of mechanical energy of elasticity dissipated during the first period of oscillation is characterised by the logarithmic decrement of damping (Q).The logarithmic decrement of damping was calculated according to the following formulae: Q = ln(a3/a5), where Q is the oscillation logarithmic decrement of the tissue; a3 and a5-the oscillation amplitudes. The natural frequency of oscillation of the muscle at relaxation characterises the tone of the muscle and describes the development of force by the muscle at contraction. The decrement characterises muscle elasticity, i.e. the ability of the muscle to restore its initial shape after contraction. The stiffness describes the ability of the muscle to resist the changes in its shape that are caused by external forces. Previous studies have demonstrated that myometrical measurements in human skeletal muscle show good reliability, validity, and repeatability [16-18].
2.3. Hind-Limb Grip Strength
Hind-limb grip strength was measured before and after 10 days of dexamethasone treatment using a Grip Strength Meter 0167-004L (Columbus Instruments, USA).
2.4. Tissue Collection
The extensor digitorum longus (EDL) and Gas muscles were dissected, trimmed of visible fat and connective tissue, weighed, frozen in liquid nitrogen, and stored at −80˚C until further processing.
2.5. Analysis of Titin, Nebulin and Total MHC
The titin, nebulin and MHC content of muscle samples was determined by gradient 2.8% - 12% SDS-PAGE according to the previously described method [10] with slight modifications. We reduced acrylamide content of the separating gel to 2.8% and used the buffer solution that was used to saturate the gel at pH 9.0 instead of the standard pH 8.6 - 8.8 [19]. The muscle samples were prepared as described previously [10]. Frozen muscles were pulverized to a fine powder in liquid nitrogen and tissue powders were homogenized in ice-cold lysis buffer (5 mM ethylenediaminetetraacetic acid, EDTA; 30 µg/ml leupeptin; 100 µg/ml phenylethylsulfonyl fluoride, PMSF; and 20 mM Tris; pH 7.5) on ice. We used the same weight to volume dilution (1 mg muscle tissue/15 µl of lysis buffer). Also, the total content of protein in the myofibrils was measured with a protein assay kit (BioRad, Hercules, California). Subsequently, myofibrils were solubilized with an equal volume of 2X SDS sample buffer (2 mM EDTA, 2% SDS, 1.2 M β-mercaptoethanol, 20% glycerol, 0.02% bromophenol blue, and 20 mM Tris; pH 8.0) and heated to 50˚C for 20 min [10].
The gel slab was stained with PageBlueTM Protein Staining Solution (Fermentas, Canada), and the protein bands were analysed densitometrically using the Image Master® 1D Program, Version 3.0 (Amersham Pharmacia Biotech, UK).
The optical density integrals (ODI) of total titin (T1 + T2), nebulin and total MHC, were measured for each loading volume, and the slope of the relationship between the ODI and loading volume was determined by linear regression analysis. The ratios of titin/MHC, nebulin/MHC, and nebulin/titin were calculated.
2.6. Analysis of MHC Isoforms
MHC isoforms proportion was determined by 8% SDSPAGE [20]. According to Kohn and Myburgh [21], the reducing agent (b-mercaptoethanol) was added to the running buffer in the upper chamber.
Muscle samples were prepared for MHC isoforms electrophoresis as described previously. Frozen muscles were thawed on ice, cut into small pieces, and washed with five volumes 20 mM NaCl, 5 mM sodium phosphate, 1 mM EGTA (pH 6.5). Myofibrillar protein was extracted with three volumes 100 mM sodium pyrophosphate, 5 mM EGTA, 1 mM dithiothreitol (pH 8.5) diluted with glycerol 1:1 (vol/vol) and were stored at –80˚C until analysis. Myofibrils containing 0.5 µg of protein were loaded on the gel after being incubated for 10 min at 65˚C in sample buffer containing 62.5 mM Tris-HCl, pH 6.8, 20% (vol/vol) glycerol, 5% (vol/vol) β-mercaptoethanol, 2.0% SDS, 0.05% bromphenol blue [22].
All gels were stained with silver [23], scanned, and percentage distribution of MHC isoforms was determined using a computer-based image analysis system and software (Image Master® 1D Program, Version 3.0, Amersham Pharmacia Biotech, UK).
2.7. Statistical Analysis
Descriptive values are presented as means (standard error (SE). The Pearson correlation coefficient was used to quantify association. The two-sample t-test was conducted to determine differences in the proportion of titin between muscles from the Dex and Contr groups. Linear regression models of ODI and loading volume were estimated to compare the Dex and Contr groups with respect to the ratio of the slopes. In addition, the ratios of the ODI values (titin/MHC, nebulin/MHC) were determined to analyse the differences between the two groups. The significance level used in the analyses was 0.05.
3. RESULTS
3.1. Muscle Mass and Function
After 10 days of dexamethasone treatment, the wet weight and hind-limb grip strength of Dex group was significantly lower than that in the age-matched Contr group (Table 1). The wet weight of EDL muscle was 30.2% lower and in Gas muscle 40.6% lower in Dex group than in Contr group. The hind-limb grip strength was 51% lower in Dex group as compared to Contr group.
3.2. Viscoelastic Properties
After 10 days of dexamethasone infusion, muscle viscoelastic properties of Dex group were significantly different from Contr group (Table 2).
Elasticity is the ability of the muscle to recover its shape, characterised by the logarithmic decrement of the damped oscillations. The smaller the value of decrement, the more elastic is the tissue. The decrement was significantly higher in the atrophied Gas muscle in Dex group than in Contr group. In addition, the value of decrement correlated positively with the degree of atrophy (r = 0.79
Table 1. Body weight, muscle wet weight and hind-limb grip strength of Dex and Contr group. Values are means (SE).

**Significant difference (P < 0.001) between groups.
Table 2. Viscoelastic properties of Dex and Contr group. Values are means (SE).

*Significant difference (P < 0.05) between groups.
P < 0.05) (Figure 1).
Stiffness reflects the resistance of the tissue to the force that changes its shape. In Dex group, stiffness was significantly lower than in Contr group.
Tissue tone is a biomechanical property of the tissue, which can be characterised by two main parameters: stiffness and elasticity. A higher oscillation frequency indicated higher tone. The tone was significantly higher in Dex group than in Contr group.
3.3. Titin, Nebulin and Total MHC
Titin, nebulin and total MHC were separated using the 2.8% - 12% SDS-PAGE minigel system. No significant changes were seen in the titin isoforms (T1 and T2) composition after dexamethasone treatment compared to Contr group.
The relationship between loading volume and ODI for titin, nebulin, and MHC was determined by linear regression analysis. The slopes ratio of the ODI/loading volume curve (Dex/Cont) for MHC decreased by 17.7%, while the magnitude was more pronounced for titin and nebulin (23.6% and 29.4% respectively).
The densitometric gel analysis revealed differences in the titin to MHC ratio (titin/MHC), nebulin to MHC ratio (nebulin/MHC) and nebulin to titin ratio (nebulin/titin) between the groups (Figure 2). The ratio of titin/MHC decreased by 8.61%, the ratios of nebulin/MHC and nebulin/titin also decreased significantly by 30.3% (P < 0.05) and 28.9% (P < 0.01), respectively.
MHC isoforms composition of the EDL muscle was determined by 8% SDS-PAGE. We observed significant differences in all MHC isoforms between groups (Table 3). The mean proportion of MHC I (slow) was higher in Dex group and the proportion of fast type MHC isoforms was lower in Dex group than in Contr group. These changes in MHC isoforms proportion showed fast to slow MHC isoforms transition. There was also a relationship between atrophy of the muscle and the relative

Figure 1. Relationship between atrophy and elasticity (shown as decrement) in Gas muscle. The relationship between atrophy of the Gas muscle and the decrease in elasticity was established by regression analysis: r = 0.99 (P < 0.01); Gas: gastrocnemius muscle.

Figure 2. The effect of dexamethasone on the ratios of titin/ MHC, nebulin/MHC, and nebulin/titin in EDL muscle. Ratios are presented as means ± SE. Contr: control group (n = 8); Dex: dexamethasone-treated group (n = 8); *P < 0.05 compared with the control group; **P < 0.01 compared with the control group. EDL: extensor digitorum longus muscle.
content of MHC IIb isoform in this muscle (Figure 3).
4. DISCUSSION
Muscle viscoelastic properties illustrate muscle state and function in normal and pathological conditions. The present study examined muscle viscoelastic properties in atrophied muscle using a non-invasive electro-mechanical device—myotonometer. Our results showed that the elasticity was lower and the tone higher in atrophied muscle than in normal muscle of Contr group. Lower elasticity was accompanied by the lower content of titin and nebulin in atrophied muscle. It has been shown previously that titin has two isoforms: an isoform of higher molecular weight (T1) and one of lower molecular weight (T2). The latter isoform is considered to be a degradation product of intact titin [24]. In our study, the proportions of T1 and T2 did not change significantly in atrophied muscle; however, stiffness increased significantly.
The results showed that the higher the degree of muscle atrophy, the lower the muscle elasticity and the relative content of the MHC IIb isoform in atrophied muscle. The increased muscle tone that was observed in atrophied muscle might be related to changes in the innervation of the muscle, particularly in fast-twitch muscle fibres. Ultrastructural studies have shown that in atrophied muscle, neuromuscular synapses are destroyed in fasttwitch fibres [25]. It is somewhat surprising that the content of titin and nebulin in atrophied muscle decreased more than the content of MHC. However, this may explain the decrease in elasticity and the increased tone in atrophied muscle.
Our results showed that the relative content of both titin and MHC decreased to the same degree in atrophied muscle. Therefore, the ratio between titin and MHC remained similar in atrophied muscle to that observed in the control group. It has been shown previously that the content of both titin and myosin is reduced in muscles
Table 3. MHC isoforms distribution (%) of EDL muscle in Dex and Contr group. Values are means (SE).
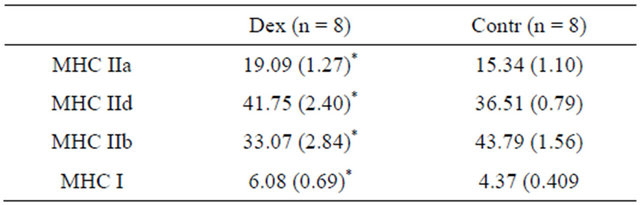
*Significant difference (P < 0.05) between groups.

Figure 3. Relationship between atrophy of the EDL muscle and the relative content of MHC IIb isoform established by regression analysis: r = 0.79 (P < 0.05); EDL: extensor digitorum longus muscle.
treated with dexamethasone [4,5,14]. The decreased ratio between nebulin and MHC in atrophied muscle indicated that nebulin declined to a greater extent than titin. Taking into account the decreased hind-limb grip strength in the Dex group, there is evidence to suggest that a reduction in the contractile protein myosin and in the elastic proteins of the muscle, including nebulin, might reduce muscle elasticity and the generation of tension. This will impair the ability of the atrophied muscle to store and recover elastic energy.
5. CONCLUSIONS
These findings suggest that glucocorticoid-induced muscle atrophy is accompanied by reduced elasticity and increased tone and stiffness, with concomitant changes in cytoskeletal proteins (titin, nebulin) and contractile protein (myosin) content.
Our results should provide important information for evaluation of musculoskeletal status in case of musculoskeletal disorders.
6. ACKNOWLEDGEMENTS
This study was supported by funding from the Ministry of Education and Research of Estonia, research project number TKKSB1787.
REFERENCES
- Horowits, R., Kempner, E.S., Bisher, M.E. and Podolsky, R.J. (1986) A physiological role for titin and nebulin in skeletal muscle. Nature, 323, 160-164. doi:10.1038/323160a0
- Wang, K. and Wright, J. (1988) Architecture of the sarcomere matrix of skeletal muscle: Immunoelectron microscopic evidence that suggests a set of parallel inextensible nebulin filaments anchored at the Z line. Journal of Cell Biology, 107, 2199-2212. doi:10.1083/jcb.107.6.2199
- Wang, K., McCarter, R., Wright, J., Beverly, J. and Ramirez-Mitchell, R. (1991) Regulation of skeletal muscle stiffness and elasticity by titin isoforms: A test of the segmental extension model of resting tension. Proceedings of the National Academy of Sciences of the United States of America, 88, 7101-7105. doi:10.1073/pnas.88.16.7101
- Kaasik, P., Seene, T., Umnova, M. and Alev, K. (2000) The mechanism of action of glucocorticoids in the rat skeletal muscle. Baltic Journal of Laboratory Animal Science, 10, 185-193.
- Seene, T., Kaasik, P., Pehme, A., Alev, K. and Riso, E.-M. (2003) The effect of glucocorticoids on the myosin heavy chain isoforms’ turnover in skeletal muscle. The Journal of Steroid Biochemistry and Molecular Biology, 86, 201-206. doi:10.1016/j.jsbmb.2003.08.002
- Kaasik, P. (2004) Composition and turnover of myofibrillar proteins in volume—Overtrained and glucocorticoid caused myopathic skeletal muscle. Dissertationes, Tartu University Press, Tartu.
- Kaasik, P., Umnova, M., Pehme, A., Alev, K., Aru, M., Selart, A. and Seene T. (2007) Ageing and dexamethasone associated sarcopenia: Peculiarities of regeneration. The Journal of Steroid Biochemistry and Molecular Biology, 105, 85-90. doi:10.1016/j.jsbmb.2006.11.024
- Kasper, C.E. and Xun, L. (2000) Expression of titin in skeletal muscle varies with hind-limb unloading. Biological Research for Nursing, 2, 107-115. doi:10.1177/109980040000200204
- Toursel, T., Stevens, L., Granzier, H. and Mounier, Y. (2002) Passive tension of rat skeletal soleus muscle fibers: Effects of unloading conditions. Journal of Applied Physiology, 92, 1465-1472.
- Chen, S.P., Sheu, J.R., Lin, A.C., Hsiao, G. and Fong, T.H. (2005) Decline in titin content in rat skeletal muscle after denervation. Muscle and Nerve, 32, 798-807. doi:10.1002/mus.20432
- Hunter, R.J., Neagoe, C., Järveläinen, H.A., Martin, C.R., Lindros, K.O., Linke, W.A. and Preedy V.R. (2003) Alcohol affects the skeletal muscle proteins, titin and nebulin in male and female rats. The Journal of Nutrition, 133, 1154-1157.
- Udaka, J., Ohmori, S., Terui, T., Ohtsuki, I., Ishiwata, S., Kurihara, S. and Fukuda N. (2008) Disuse-induced preferential loss of the giant protein titin depresses muscle performance via abnormal sarcomeric organization. Journal of General Physiology, 131, 33-41. doi:10.1085/jgp.200709888
- Podlubnaia, Z.A., Vikhliantsev, I.M., Mukhina, A.M., Nemirovskaya, T.L. and Shenkman, B.S. (2004) Sarcomeric cytoskeletal proteins and myosin phenotype in stretched soleus of hindlimb-suspended rats. Biofizika, 49, 424-429.
- Hayashi, K., Tada, O., Higuchi, K. and Ohtsuka, A. (2000) Effects of corticosterone on connectin content and protein breakdown in rat skeletal muscle. Bioscience, Biotechnology, and Biochemistry, 64, 2686-2688. doi:10.1271/bbb.64.2686
- Vain, A. (1995) Estimation of the functional state of skeletal muscle. In: Veltnik, P.H. and Boom, H.B.K., Eds., Control of Ambulation Using Functional Neuromuscular Stimulation, University of Twente Press, Enschede, 51-55.
- Bizzini, M. and Mannion, A.F. (2003) Reliability of a new, hand-held device for assessing skeletal muscle stiffness. Clinical Biomechanics, 18, 459-461. doi:10.1016/S0268-0033(03)00042-1
- Korhonen, R.K., Vain, A., Vanninen, E., Viir, R. and Jurvelin, J.S. (2005) Can mechanical myotonometry or electromyography be used for the prediction of intramuscular pressure? Physiological Measurement, 26, 951- 963. doi:10.1088/0967-3334/26/6/006
- Viir, R., Laiho, K., Kramarenko, J. and Mikkelson, M. (2006) Repeatability of trapezius muscle tone assessment by a myometric method. Journal of Mechanics in Medicine and Biology, 6, 215-228. doi:10.1142/S0219519406001856
- Vikhlyantsev, I.M., Podlubnaya, Z.A. and Kozlovskaya, I.B. (2004) New titin isoforms in skeletal muscles of mammals. Doklady Biochemistry and Biophysics, 395, 111-113. doi:10.1023/B:DOBI.0000025559.14249.43
- Talmadge, R.J. and Roy, R.R. (1993) Electrophoretic separation of rat skeletal muscle myosin heavy-chain isoforms. Journal of Applied Physiology, 75, 2337-2340.
- Kohn, T.A. and Myburgh, K.H. (2006) Electrophoretic separation of human skeletal muscle myosin heavy chain isoforms: The importance of reducing agents. Journal of Physiological Sciences, 56, 355-360. doi:10.2170/physiolsci.RP007706
- Hämäläinen, N. and Pette, D. (1996). Slow-to-fast transitions in myosin expression of rat soleus muscle by phasic high-frequency stimulation. FEBS Letters, 399, 220- 222. doi:10.1016/S0014-5793(96)01325-7
- Oakley, B.R., Kirsch, D.R. and Morris, N.R. (1980) A simplified ultrasensitive silver stain for detecting proteins in polyacrylamide gels. Analytical Biochemistry, 105, 361-363. doi:10.1016/0003-2697(80)90470-4
- Maruyama, K. (2002) Beta-actinin, cap Z, connectin and titin: What’s in a name? Trends in Biochemical Sciences, 2, 264-266. doi:10.1016/S0968-0004(02)02068-6
- Seene, T., Umnova, M. and Kaasik, P. (1999) The exercise myopathy. In: Lehmann, M., et al., Eds., Overload, Performance Incompetence, and Regeneration in Sport, Kluwer Academic/Plenum Publishers, New York, 119- 130. doi:10.1007/978-0-585-34048-7_9
NOTES
*Corresponding author.