Advances in Biological Chemistry
Vol. 2 No. 3 (2012) , Article ID: 21811 , 6 pages DOI:10.4236/abc.2012.23033
Analysis of the interaction between [Ru(phenanthroline)3]2+ and bovine serum albumin
![]()
Laboratorio de Biomateriales, Facultad de Ciencias, Montevideo, Uruguay
Email: *fcerda@fcien.edu.uy
Received 17 April 2012; revised 18 May 2012; accepted 27 May 2012
Keywords: Saturation Graph; Spectrophotometry; Cyclic Voltammetry
ABSTRACT
The interaction of compounds with potential use as pharmaceutical with a carrier protein as serum albumin is of great importance in their biodistribution. Albumin offers different sites for binding metallic compounds. Using a combination of spectrophotometric and electrochemical techniques, the interaction between [Ru(phen)3]Cl2 (phen = phenan-troline) and bovine serum albumin was evaluated. In particular, it was possible to calculate an apparent binding constant (Kb) of 4.4 × 10³ (for concentrations expressed in M) for the main interaction site of the protein. A number of ca. 40 molecules of Ru-phen per molecule of BSA under saturation conditions, and a positive cooperative behavior towards association from the protein were found.
1. INTRODUCTION
Heterocyclic ligands and their metallic chelates are of broad interest in Medicine. They have many different applications, and they can be used for antitumor, antibacterial and antiviral purposes [1]. In particular, polypyridyl ruthenium complexes as dichlorotris (1,10-phenanthroline)ruthenium(II) analyzed here, have been used as model molecular probes to explore the interaction between small molecules and DNA [2,3]. These complexes are able to partially intercalate between DNA bases, and establish electrostatic and/or van der Waals interactions with the DNA.
The development of organometallic compounds for chemotherapeutic purposes has been dominated by platinum complexes, but other metals have also been explored with the aim of creating antitumor agents with high specificity and less toxicity [4].
The interaction of metal complexes of interest in Medicine with proteins should be an important characterization step, because the union with serum proteins like albumin has a great influence in the way the compound is distributed in vivo. Nevertheless, studies of this type are scarce in the literature, and different techniques have been reported with this aim [5-9] . Among them, fluorescence spectroscopy, gel chromatography, dialysis, ultra filtration, NMR and HPLC are among the most used.
The goal of this work was to characterize the union between [Ru(phenanthroline)3]2+ (phenan-throline = phen) and bovine serum albumin (BSA) using cyclic voltammetry and UV-visible measurements. BSA was used because it is structurally very similar to the human serum albumin [10], but with a lower price and a higher purity.
The union between [Ru(phen)3]2+ and DNA has been reported in the literature [9] and evaluated through changes in UV-visible and luminescent spectroscopies. Reported changes are in accordance with a partial intercalation of the phenantroline moiety of the metallic complex within the DNA molecule. In particular, some studies has been conducted using UV-visible spectroscopy to evaluate the union of BSA with [Co(phen)3]2+ [5]. These studies indicate that the interaction with BSA involves electrostatic and hydrophobic forces, in the site I of the protein.
2. MATERIALS AND METHODS
Bovine serum albumin (BSA, fraction V, 98.0%, 66500 Da) and [Ru(phen)3]Cl2 (98.0%, 712.59 g/mol) were purchased from SIGMA and used without further treatment.
Solutions were prepared with MilliQ water. All other chemicals were reagent grade.
2.1. Electrochemical Experiments
A 10 mL conic cell was used. The working electrode was a glassy carbon disk of 0.0707 cm2 geometric area. The electrochemical setup was completed with a Pt sheet as the counter electrode, and Hg/Hg2Cl2 (SCE) (E˚ = 0.248 V vs. SHE) (SHE = standard hydrogen electrode) as the reference. All potentials quoted in the text are referred to this electrode. Before each experiment, the working electrode was polished with fine grade alumina (0.05 - 0.03 mm) to a mirror like finishing, followed by ultrasonic bath in ultrapure water. This cleaning procedure ensures a reproducible surface, an optimal charge transfer process, as well as the minimization of adsorption phenomena [11].
Complex solutions were prepared at concentrations within the range 0.19 - 1.05 mM in 0.1 M NaClO4 in a 2:1 v/v H2O:ethanol mixture as supporting electrolyte in order to ensure the solubilization of the metallic complex, and adjusted to pH 7.4 with NaOH. BSA was previously dissolved in 300 mL phosphate buffer pH 7.4, and then was added to the complex containing solution to reach a molar ratio [Ru-phen]/[BSA] within the range 0.5 - 131. This solution was incubated for 90 min, and then subjected to electrochemical studies. This involved triangular potential sweeps between –1.1 V and +0.3 V, performed at potential scan rates between 0.002 and 0.5 Vs–1, along with suitable blanks. All the electrochemical studies were performed at 25˚C. At least five runs were performed for each [Ru-phen]/[BSA] molar ratio.
2.2. Spectroscopic Experiments
UV-visible spectra were recorded in the 200 - 800 nm range in phosphate aqueous buffer (ionic strength 0.15 M, pH = 7.4), for the free complex and after addition of the protein.
Complex and BSA solutions were prepared to reach a molar ratio [BSA]/[Ru(phen)3]2+ in the range 0.10 to 24.
3. RESULTS AND DISCUSSION
3.1. Spectroscopic Experiments
The UV-visible spectra were recorded in order to evaluate the profile of the metallic complex. Three main absorption bands were detected, located at 262 (ε = 96073 M–1·cm–1), 446 (ε = 13867 M–1·cm–1) and 684 nm (ε = 214 M–1·cm–1). In line with the experimental absortivity values, transition at 262 nm was assigned to electronic transition between π*←π orbitals of the phen ligand, whereas the 446 nm band can be explained by a metal to ligand charge transference transition. Finally, the 684 nm peak was assigned to a d-d transition.
Among these peaks, those located at 446 and 684 nm were selected to follow the union with the protein because at such wavelengths interference by protein absorption was minimized as previously checked in blank experiments using only protein. For the 684 nm band, the absorbance decreased with BSA concentration, whereas the opposite behavior was observed for the band centered at the 446 nm, as showed in Figure 1. Moreover, the position of the absorption band moved to higher wavelengths, indicating a less polar environment for the Ru-phen complex after interaction with the BSA.
To evaluate the extent of the interaction with BSA, the half reciprocal absorption titration method was employed [3,12-14] . According to this method, and considering the absorbance spectra of the Ru-complex in the absence and after the addition of the protein, it is possible to estimate the value of the apparent association constant Kb from the equation:
 (1)
(1)
where εa is the apparent extinction coefficient of the complex measured in the presence of the protein, εf is the extinction coefficient for the free Ru-compound and εb is the extinction coefficient for the complex when it is totally bound to the protein. To apply Eq.1, some conditions have to be taken into account: (a) the amount of BSA is in a great excess in comparison with the amount of the Ru-phen complex, and (b) there is only one occupied site by the complex on the protein.
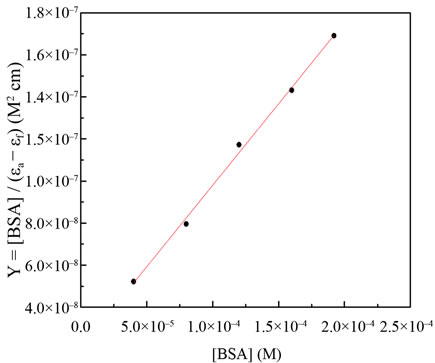
Thus, by plotting Y = [BSA]/(εa – εf) as a function of [BSA], an apparent Kb = 4.4 × 10³ (for concentrations expressed in M) was obtained.
 (a)
(a) (b)
(b)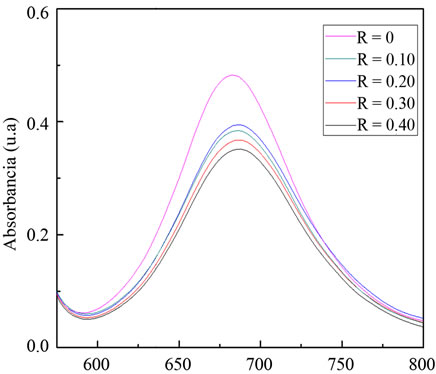 (c)
(c)
Figure 1. Influence of R = [BSA]/[Ru-phen] in the absorption spectra of [Ru(phen)3]2+ in the absence and presence of different amounts of BSA, on the bands centered at (a) 684 nm; and (b) 446 nm; (c) Graphic representation for Y = [BSA]/(εa – εf) vs. [BSA].
The mean values of Kb for different molar ratios [BSA]/[Ru-phen] (Table 1) were obtained from at least five concordant experiments. As can be observed, there is a dependence of Kb with the relative excess of the amount of protein to complex, showing the existence of more than one binding site on the protein. The reported value of 4.4 × 10³ is taken as the valid one, because it was obtained under the conditions needed to apply Eq.1, that is, the amount of protein is at least 10 times higher than the amount of metallic complex.
3.2. Electrochemical Experiments
The voltammetric profile of the complex was evaluated and compared with that of the phenantroline ligand prior to the interaction studies, in order to assess the contributions arising from the electron exchange in the Ru(III)/ Ru(II) couple. From this analysis, the cathodic contribution at ca. –0.9 V was attributed to the Ru-couple and thus chosen to follow the union to BSA.
After incubation with different amounts of protein, two changes were observed: a current decrease of the contribution associated to the Ru-couple, and the shift of the potential peak to more positive values. These changes were more pronounced as the relative amount of BSA increased, as deduced from Figure 2.
Also, the influence of the viscosity on the experimental runs was evaluated, using a fixed ratio Ru-complex to BSA but for increasing concentrations of the protein. No relevant differences were found.
To assess the extent of the interaction, changes in the effective diffusion coefficient (Def) were calculated. The size of the free Ru-complex is smaller than the size of the ensemble BSA-complex, and therefore, Def will change
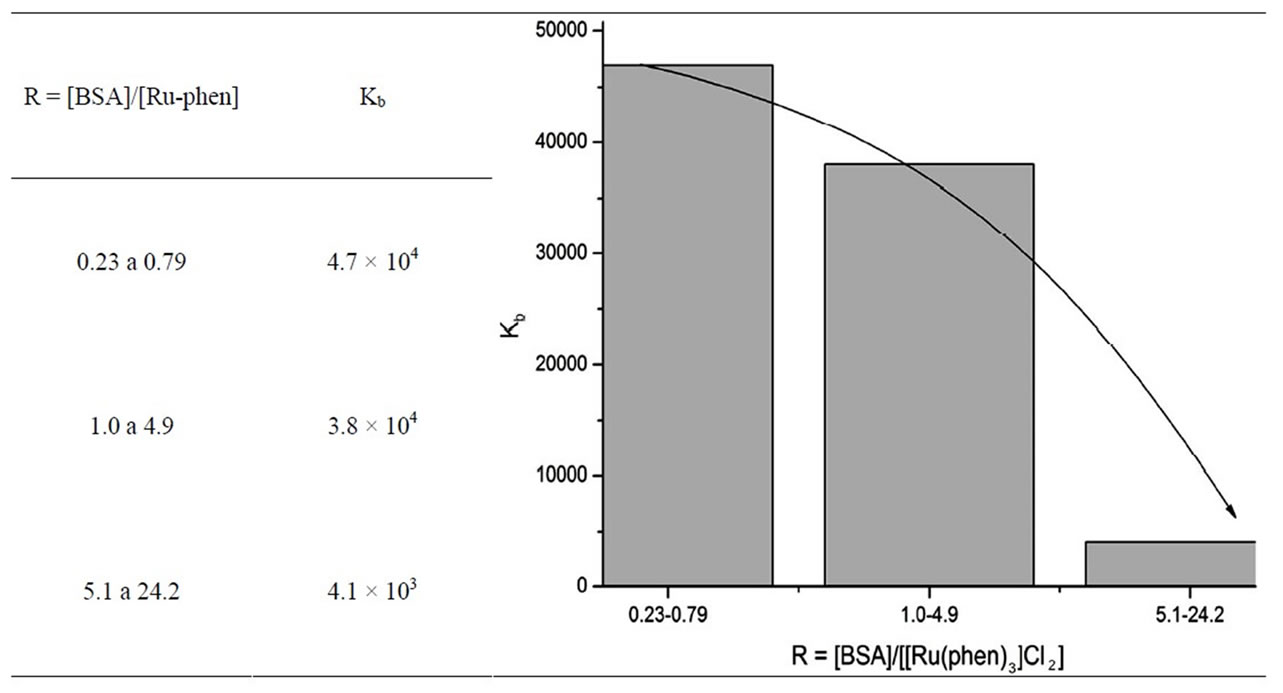
Table 1. Apparent binding constant Kb obtained from spectrophotometric measurements. At the left side, it is shown a graphic representation of the data, with the observed tendency.
 (a)
(a)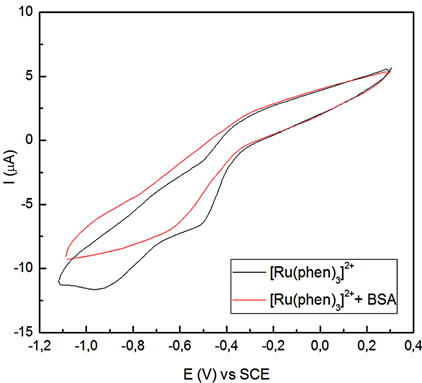 (b)
(b)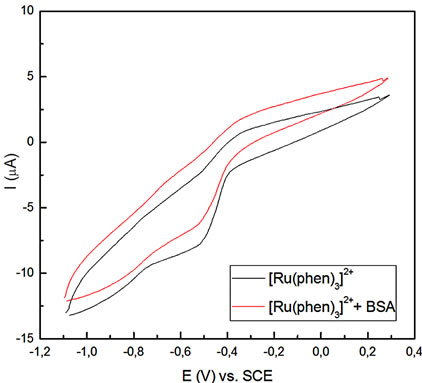 (c)
(c)
Figure 2. Voltammetric profiles for the Ru-phen complex before and after incubation for 90 min with BSA, pH = 7.4 Glassy carbon as working electrode, v = 0.02 Vs–1. (a) R = [Ru-phen]/[BSA] = 131; (b) R = 42; (c) R = 1.8.
after the union between the two compounds takes place. Using the Randles-Sevcik equation [15], it is possible to calculate the Def from the slope of the graph representation of ip and v1/2, as can be deduced from:
 (2)
(2)
where ip is the intensity of the current peak, A is the geometric area of the electrode, n is the number of electrons exchanged, Ct is the bulk concentration of the complex, and v is the potential scan rate.
Once Def is obtained, the molar fraction Xb (defined as Ru bound to BSA divided by the total amount of Ru) can be calculated as:
 (3)
(3)
where Df is the diffusion coefficient for the free Ru-phen complex and Db is 6.28 × 10⁻⁷ cm2·s–1, the reported value for BSA. Because the size of BSA is higher than the size of the Ru complex, the diffusion coefficient of the ensemble Ru compound-BSA can be approximated to that of the BSA.
Eq.3 can be used for a reversible system like the one described here, where the union between the complex and the protein takes place through electrostatic and/or van der Waals forces, without displacement of the phen ligands bound to the Ru compound.
Results showed that the amount of bound complex to the protein changed as the molar ratio between these two compounds varied (see Table 2). For [Ru]total/[BSA] > 100, the excess of complex is very high and mainly remained as free unbounded. In this case, no important changes were observed in the intensity current peak or at the potential peak values for the redox couple.
A second group involved 100 > [Ru]total/[BSA] > 10, where the potential peak shifted to –0.84 V, indicating that an important amount of the compound is bound to the protein, and a few amount remained as free unbounded. And finally, for the third group, the cathodic peak was observed at –0.75 V because mostly the entire complex is present in the bounded form.
To explain these observations, some considerations must be made. At pH = 7.4, the protein is mostly negatively charged (–17) because the isoelectric point is 4.7 [10]. A cationic compound as Ru-phen would approximate to the protein surface very easily. Once there, the metallic compound could establish interactions through van der Waals forces and even electrostatic ones with functional groups of the protein residues. But in particular, and considering the hydrophobic character of phenantroline, the compound would choose a hydrophobic cavity located in sub domain IIA for the protein [1,5-7, 10] , as reported for many compounds with pharmacological action. Then, for [Ru]total/[BSA] ratios lower than 5, a major union site with the BSA is observed. But when the amount of complex increased, the metallic molecules will reach other negative charged sites of the protein, trying to establish interactions there. Moreover, when the excess of complex to BSA is very high, saturation conditions were reached, and the maximum quantity of complexes bound to the protein was found.
To calculate such amount, a saturation graph was performed. When a macromolecule P binds a compound L, the association reaction can be represented as:
P + nL ↔ PLn
Defining the saturation fraction Y as the number of occupied sites by L divided by the total available sites at P, and for proteins with n binding sites, there is a relationship between Y and the concentration of L, given by the Hill equation:
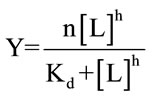 (4)
(4)
where h is the Hill coefficient, describing the cooperativity and Kd is the apparent dissociation constant [16].
After plotting (see Figure 3), the behavior of the system shows a positive cooperativity (h = 2.0 ± 0.6), and the highest number of binding sites available for the complex is 39. This number was taken as the maximum value of binding sites present at the protein, because for increasing amounts of Ru-phen that was the highest calculated quantity of molecules of the complex able to be trapped by the protein.
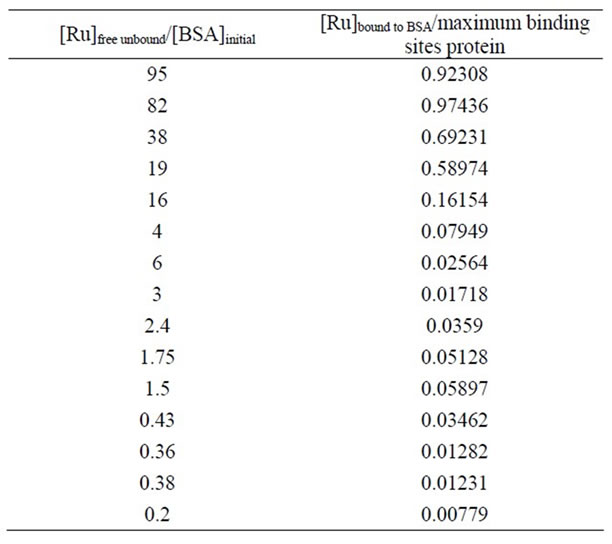
Table 2. Experimental data calculated from voltammetric measurements. In each case, after applying Eq.2 and Eq.3, Xb values were obtained. Thus, [Ru]free and [Ru]bound to BSA were deduced and after that corrected with respect to the initial [BSA]. After exploration, 39 was taken as the maximum value of binding sites present at the protein, because when increasing amounts of Ru-phen that was the highest amount of molecules of the complex able to be trapped by the protein.
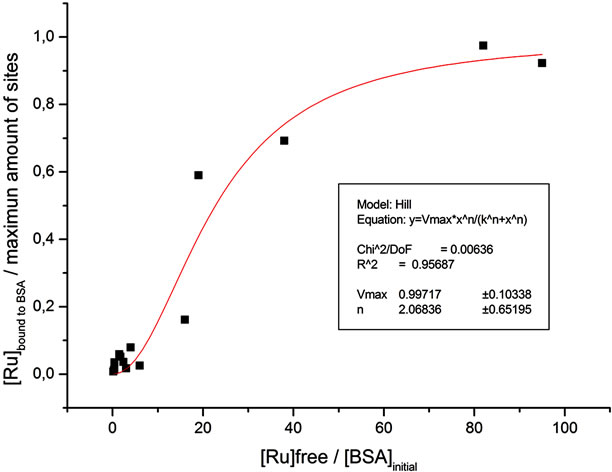
Figure 3. Hill graph for saturation fraction Y = [Ru]bound to BSA divided by the maximum amount of binding sites at the protein vs. [Ru]free normalized with respect to the initial protein concentration. Constructed from electrochemical experiments.
It is important to remark that in the way in which measurements were carried out, that is, molar ratio Ru to BSA was varied, but also [Ru-phen] and [BSA] changed, it is not possible to obtain the value of Kd from the conducted Hill graph. To obtain such value, a fixed amount of BSA should be used in the presence of increasing concentrations of the Ru-phen compound, something unpractical when performing electrochemical measurements as those carried out in the present work.
To calculate an apparent association constant, runs performed in the presence of an excess of the protein were selected. One binding site was considered for calculations. In such conditions (last values shown in Table 2), the calculated Kb was 2.9 × 10³ (for concentrations in M).
4. CONCLUSIONS
The interaction between the Ru-complex with a carrier protein as BSA is an interesting model to evaluate an important path for distribution and/or elimination of a compound with potential use as pharmaceutical. Structurally similar compounds are used as antitumorals, and are expected to show a similar interaction behavior with BSA as the one evaluated here.
It is well known that a protein as the albumin offers many different sites to capture a great variety of compounds, depending on their structural characteristics as hydrophobicity, charge or polarity. The Ru-phen complex is positively charged, and probably reaches the negatively charged surface of the protein at pH = 7.4 in a first approach. Then, at subdomain IIA the phenantroline ligand would also establish hydrophobic interactions with protein residues.
As a consequence, many sites are offered for the macromolecule to bind the metallic compound with different affinity. In particular, from the saturation graph conducted from electrochemical evaluation a number of ca. 40 was found.
Using spectrophotometric and voltammetric techniques an apparent Kb between 2.9 × 10³ and 4.4 × 10³ was obtained. Even for so many binding sites, interaction between Ru-phen and the protein is very weak, and for this reason the apparent binding constant is low. This is desirable for a compound that will be transported in vivo by a carrier protein as albumin, and dissociates once the complex reaches the target organ.
Finally, it is interesting to remark that thermodynamics properties can be calculated by combining complementary methodologies as those employed in this work.
5. ACKNOWLEDGEMENTS
Authors would like to CSIC—Uruguay for its financial support. MFC is a PEDECIBA and ANII researcher (Uruguay).
![]()
![]()
REFERENCES
- Arjmand, F., Tewatia, P., Aziz, M. and Khan, R.H. (2009) Interaction studies of a novel Co(II)-based potential chemotherapeutic agent with human serum albumin (HSA) employing biophysical techniques. Medicinal Chemistry Research, 19, 794-807. doi:10.1007/s00044-009-9231-7
- Timerbaev, A.R., Hartinger, C.G., Aleksenko, S.S. and Keppler, B.K. (2006) Interactions of antitumor metallodrugs with serum proteins: Advances in characterization using modern analytical methodology. Chemical Reviews, 106, 2224-2248. doi:10.1021/cr040704h
- Pyle, A.M., Rehmann, J.P., Meshoyrer, R., Kumar, C.V., Turro, N.J. and Barton, J.K. (1989) Mixed-ligand complexes of ruthenium(II): Factors governing binding to DNA. Journal of the American Chemical Society, 111, 3051-3058. doi:10.1021/ja00190a046
- Ravera, M., Gabano, E., Baracco, S., Sardi, M. and Osella, D. (2008) Electrochemical studies of a series of antimetastatic monoand di-ruthenium complexes [Na] [trans-RuIIICl4(DMSO)(L)] and [Na]2[{trans-RuIIICl4 (DMSO)}2(μ-L)] (L=N-donor heterocyclic bridging ligand). Inorganica Chimica Acta, 361, 2879-2886. doi:10.1016/j.ica.2008.02.031
- Zhang, Y.-Z., Li, H.-R., Dai, J., Chen, W.-J., Zhang, J. and Liu, Y. (2010) Spectroscopic studies on the binding of cobalt(II) 1,10-phenanthtoline complex to bovine serum albumin. Biological Trace Element Research, 135, 136-152. doi:10.1007/s12011-009-8502-y
- Kandagal, P.B., Ashoka, S., Seetharamappa, J., Shaikh, S.M.T., Jadegoud, Y. and Ijare, O.B. (2006) Study of the interaction of an anticancer drug with human and bovine serum albumin: Spectroscopic approach. Journal of Pharmaceutical and Biomedical Analysis, 41, 393-399. doi:10.1016/j.jpba.2005.11.037
- Ni, Y., Zhang, X. and Kokot, S. (2009) Spectrometric and voltammetric studies of the interaction between quercetin and bovine serum albumin using warfarin as site marker with the aid of chemometrics. Spectrochimica Acta. Part A, Molecular and Biomolecular Spectroscopy, 71, 1865- 1872. doi:10.1016/j.saa.2008.07.004
- Rahman, A.A. and Sharker, S.M. (2009) Determination of the binding sites of propranolol HCl on bovine serum albumin by direct and reverse procedures. Saudi Pharmaceutical Journal, 17, 249-253. doi:10.1016/j.jsps.2009.08.002
- Barton, J.K., Danishefsky, A.T. and Goldberg, J.M. (1984) Tris(phenanthroline)ruthenium(II): Stereoselectivity in binding to DNA. Journal of the American Chemical Society, 106, 2172-2176. doi:10.1021/ja00319a043
- Peters, T. (1996) All about albumin. Academic Press, New York.
- Creery, R.L.M. and Wieckowski, A. (1999) Interfacial electrochemistry. Marcel Dekker, New York.
- Efthimiadou, E.K., Karaliota, A. and Psomas, G. (2010) Metal complexes of the third-generation quinolone antimicrobial drug sparfloxacin: Structure and biological evaluation. Journal of Inorganic Biochemistry, 104, 455- 466. doi:10.1016/j.jinorgbio.2009.12.019
- Wolfe, A. and T. Meehan, (1987) Polycyclic aromatic hydrocarbons physically intercalate into duplex regions of denatured DNA. Biochemistry, 26, 6392-6396. doi:10.1021/bi00394a013
- Zeman, S.M., Depew, K.M., Danishefsky, S.J. and Crothers, D.M. (1998) Simultaneous determination of helical unwinding angles and intrinsic association constants in ligand-DNA complexes: The interaction between DNA and calichearubicin B. Proceedings of the National Academy of Sciences of the United States of America, 95, 4327-4332. doi:10.1073/pnas.95.8.4327
- Cerdá, M.F., Méndez, E., Obal, G., Kremer, C., Gancheff, J.S. and Luna, A.M.C. (2004) Voltammetric studies of the interaction between Re(V) complexes and proteins. Journal of Inorganic Biochemistry, 98, 238-244. doi:10.1016/j.jinorgbio.2003.08.013
- Leskovac, V. (2004) Comprehensive enzyme kinetics. Kluwer Academic, Plenum Publishers, New York.
NOTES
*Corresponding author.