Advances in Biological Chemistry
Vol. 2 No. 1 (2012) , Article ID: 17279 , 6 pages DOI:10.4236/abc.2012.21009
Ratio quantification of gene dosage by Agilent 2100 Bioanalyzer for detection of somatic gene deletions
![]()
1Department of Molecular Pharmacology, City of Hope Comprehensive Cancer Center, Duarte, USA
2Translational Research Core Laboratory, City of Hope Comprehensive Cancer Center and Beckman Research Institute, Duarte, USA
3Institute of Medicine, Chung Shan Medical University, Taichung, Chinese Taipei
Email: *yyen@coh.org
Received 17 December 2011; revised 21 January 2012; accepted 30 January 2012
Keywords: Electrophoresis; Gene Deletion Detection; Agilent 2100 Bioanalyzer; RD-PCR; NSCLC
ABSTRACT
We applied the Agilent 2100 Bioanalyzer, a microfluidics-based electrophoresis instrument, and introduced an accurate and consistent parameter, the relative product yield ratio (ROY), to detect somatic gene deletions in tumor cells. Briefly for such purpose, the Agilent 2100 Bioanalyzer quantified the ROY of a target gene to an endogenous internal control, both of which were initially co-amplified by Robust-Dosage PCR (RDPCR). Herein, we extensively validated this approach. We first tested the effect of well positions on the Agilent DNA chip. We found that no matter which wells the samples were loaded in, the ROY was consistent with coefficient of variation (CV) < 2%. Then we tested the effect of product concentrations that varied 8-fold, and the ROY was also consistent with CV < 3.5%. Furthermore, we applied this approach to identify six somatic KRAS deletions in non-small cell lung cancer patients, confirming our previous findings. Thus, the Agilent 2100 Bioanalyzer is simple, accurate, quick, and ultimately able to replace conventional gel electrophoresis for the detection of somatic gene deletions.
1. INTRODUCTION
Chromosomal deletions and amplifications often occur in malignancies such as lung cancer [1] (http://cgap.nci.nih. gov/Chromosomes/Mitelman Database of Aberrations in cancer). However, early detection of deletions and amplifications is difficult largely because of the low frequency of aberrations, multiploidy in many cancer genome regions, and the low portion of tumor cells in tissue specimens.
We applied the Agilent 2100 Bioanalyzer, a microfluidics-based electrophoresis instrument which takes nearly 40 minutes to analyze a set of DNA samples. In brief, the Agilent 2100 Bioanalyzer quantified the relative product yield ratio (ROY) of a target gene to an endogenous internal control, both which were initially co-amplified by Robust-Dosage PCR (RD-PCR), so that somatic gene deletions could be detected accurately.
RD-PCR is a highly quantitative duplex PCR which coamplifies a target locus on an autosome and an endogenous internal control on a X-chromosome [2,3]. Through measuring the ROY of the two products, the template copy number (ROT) can be accurately deduced. Previously, we developed and validated 110 RD-PCR assays for detection of heterozygous deletions and duplications with high linearity and consistency [4,5]. However, the PCR products needed to be electrophoresed on agarose gel and measured by Typhoon imager, a labor intensive, expensive, and time consuming procedure.
The Agilent 2100 Bioanalyzer can quantify the absolute product yields of DNA products [6,7]. However, the ROY, exemplified by a target of the KRAS gene on CH.12 and an endogenous internal control of the F9 gene on CH.X, had not been extensively explored, particularly for detection of somatic gene deletions. Thus, we extensively validated the consistency and accuracy of the Agilent bioanalyzer in obtaining the ROY. We first tested the effect of well positions on the chip and found the ROY consistent in all individual wells. Then we tested the effect of product concentrations and found that the ROY was consistent throughout 8-fold product concentrations. Finally, we applied this approach to identify six somatic KRAS deletions in non-small cell lung cancer (NSCLC) patients, which confirmed our previous experiments. Thus, the Agilent 2100 Bioanalyzer is easy to use, accurate, quick, relatively cheap, and able to replace conventional gel electrophoresis for the detection of somatic gene deletions.
2. MATERIALS AND METHODS
2.1. NSCLC Patients and Tissue Specimens
NSCLC patients from Taiwan were diagnosed at an early stage (IA, IB, IIA, or IIB) and treated with standard adjuvant therapy. Cancer tissue and their paired marginal normal tissues were sectioned in surgery and immediately frozen at –70˚C. Tumor tissues contained sufficient portion of tumor cells, typically ≥40%, and normal tissues had no tumor cells, as judged by a pathologist.
2.2. Extraction of Genomic DNA from Frozen Tissues
The genomic DNA was extracted from frozen tissue using DNeasy Mini Kit according to the manufacturer’s protocol (Qiagen). Concentration was measured by NanoDrop-1000 spectropho-tometer at 260 nm (Nano-Drop).
2.3. RD-PCR for Chromosomal Deletions
Each assay co-amplified a target of the KRAS gene on CH.12 and an endogenous internal control of the F9 gene on CH.X. Primers were designed according to Liu et al. 2003 [3] (Table 1).
Before RD-PCR, genomic DNA samples were incubated at 95˚C in 1× Expand High Fidelity buffer #3 without MgCl2 (Roche) for 10 minutes in order to completely denature the genomic DNA and minimize RDPCR bias.
A RD-PCR reaction contained a total volume of 25 μl: 1× Expand High Fidelity buffer #3 (Roche), 4.5 mM MgCl2, 200 μM each dNTP, 0.1 μM each primer of the F9 gene (internal control), 0.2 μM each primer for exon 2 (target), 1U of Platinum Taq DNA polymerase and 1U of Platinum Taq DNA polymerase High Fidelity (Invitrogen), and 60 ng of genomic DNA. Samples were heated to 94˚C for 2 minutes before cycling. Each of 23 cycles consisted of denaturation at 94˚C for 15 seconds, annealing at 55˚C for 30 seconds, and elongation at 72˚C for 90 seconds.
2.4. Agilent 2100 Bioanalyzer and DNA 1000 Chip
We prepared the DNA 1000 Chip, suitable for separation and detection of DNA segments from 15 bp to 15,000 bp, according to the manufacturer’s instruction. DNA gel matrix containing DNA dye and buffer was spread through microchannels on the DNA chip. 5 µl of marker and 1 µl of RD-PCR product were added into each well, followed by electrophoresis and measurement.
The absolute peak areas of the KRAS and F9 products, which were used to represent the amount of RD-PCR product yield, were obtained by subtracting local background signal from total signal in arbitrary fluorescence units (FU) using Expert software version B.02.08.SI648.
The relative product yield ratio (ROY) of the KRAS gene to the F9 gene of a sample is the net signal of the target segment divided by the net signal of the control segment.
For normal product, a linear equation of ROY = m∙ROT + b was regressed when ROY was correlated with the template copy number ratio (ROT) per cell (normal male ROT = 2 and female ROT = 1). Then for an unknown sample, the linear equation was used to convert the ROY to its ROT. 85% ROT ratio of tumor tissues to their paired normal tissues was set as detection limit for deletions, an equivalent when 30% of diploid cells delete one copy of the KRAS gene.
3. RESULTS AND DISCUSSION
3.1. The Effect of Well Positions on Measured Peak Areas
In order to test the effect of well positions, we added two RD-PCR products, one amplified from a female and the other from a male, in the same amount into 6 wells each, placed in alternating order across the DNA chip.
With well positions noted, we found that the absolute peak areas of the KRAS and F9 products, representatives of the KRAS and F9 product yields, were heavily affected by well positions on the chip (Figure 1), even though the same amount of RD-PCR products was applied to each well.
However, the relative peak area ratios, representing the relative product yield ratios (ROY), were much more consistent (Table 2(a)). This was also supported by the analysis of average, standard deviation, and coefficient of variation (CV) (Table 2(b)). For example, the CV was 0.015 for the female sample, and was 0.014 for the male sample.
3.2. The Effect of Product Concentrations on Measured Peak Areas
In order to test the effect of product concentrations, each of three PCR samples was prepared over 8-fold concentrations. Again, the ROY was highly consistent, regardless of product concentrations or well positions (Table 3(a), Figure 2). The average, standard deviation, and CV were calculated (Table 3(b)). For example, the CV was 0.016 for Female 2, 0.018 for Male 2, and 0.035 for Male 3.
3.3. Detection of Somatic Gene Deletions in Non-Small Cell Lung Patients
RD-PCR first co-amplified a target of exon 2 of the KRAS gene and an endogenous internal control of exon 1 of the
Table 1. List of primers for RD-PCR.
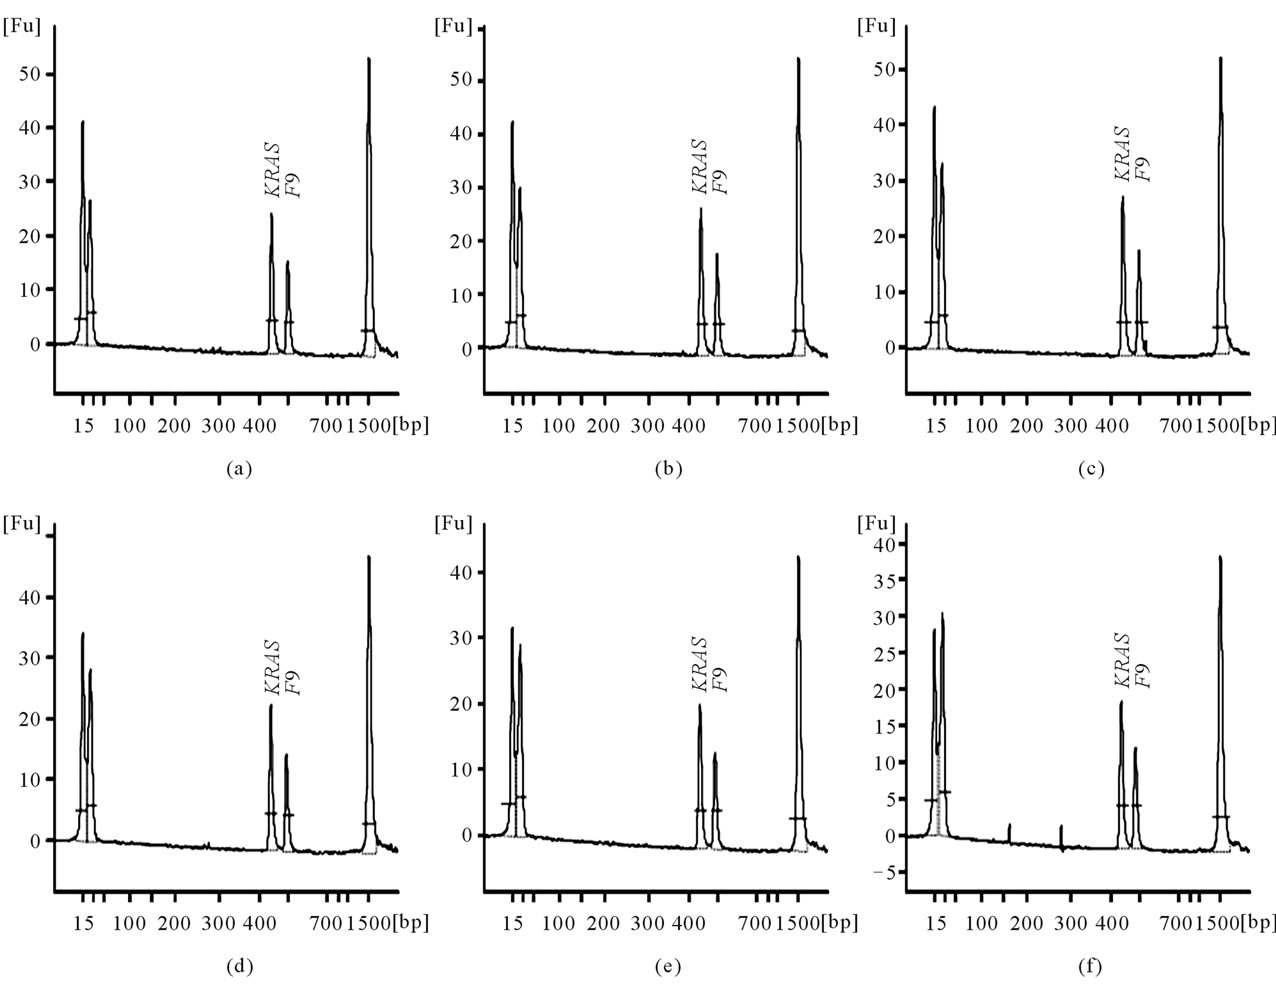
Figure 1. The effect of well positions. The X-axis represents the product size in bp and the Y-axis is the arbitrary fluorescence intensity. The KRAS and F9 signals are labeled. Panels (a) to (f) were conducted on the same chip from the same RD-PCR DNA sample Male 1 with the same volume of product added to each well. (a) Examples are from Well 2; (b) Well 4; (c) Well 6; (d) Well 8; (e) Well 10; (f) Well 12. The DNA markers that are at 15 bp and 15,000 bp are present.
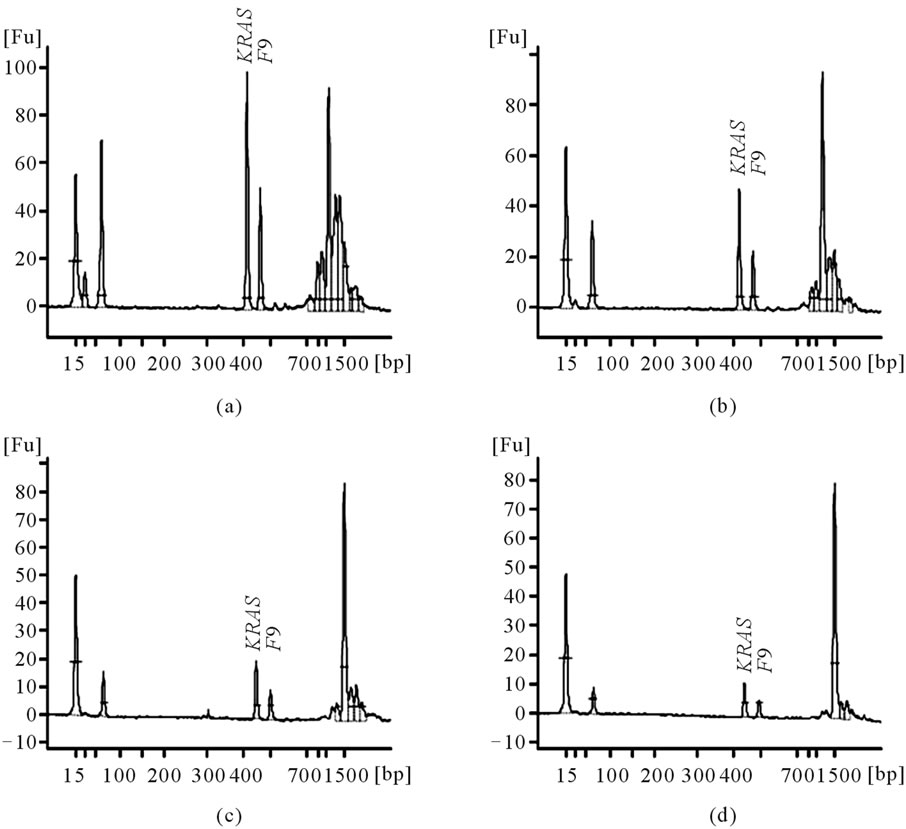
Figure 2. The effect of product concentrations. Panels A to D are of RD-PCR DNA sample Male 2, which were conducted on the same chip, but with differing concentrations. (a) Concentration of 1× in Well 2; (b) 1/2× in Well 5; (c) 1/4× in Well 8; (d) 1/8× in Well 11.
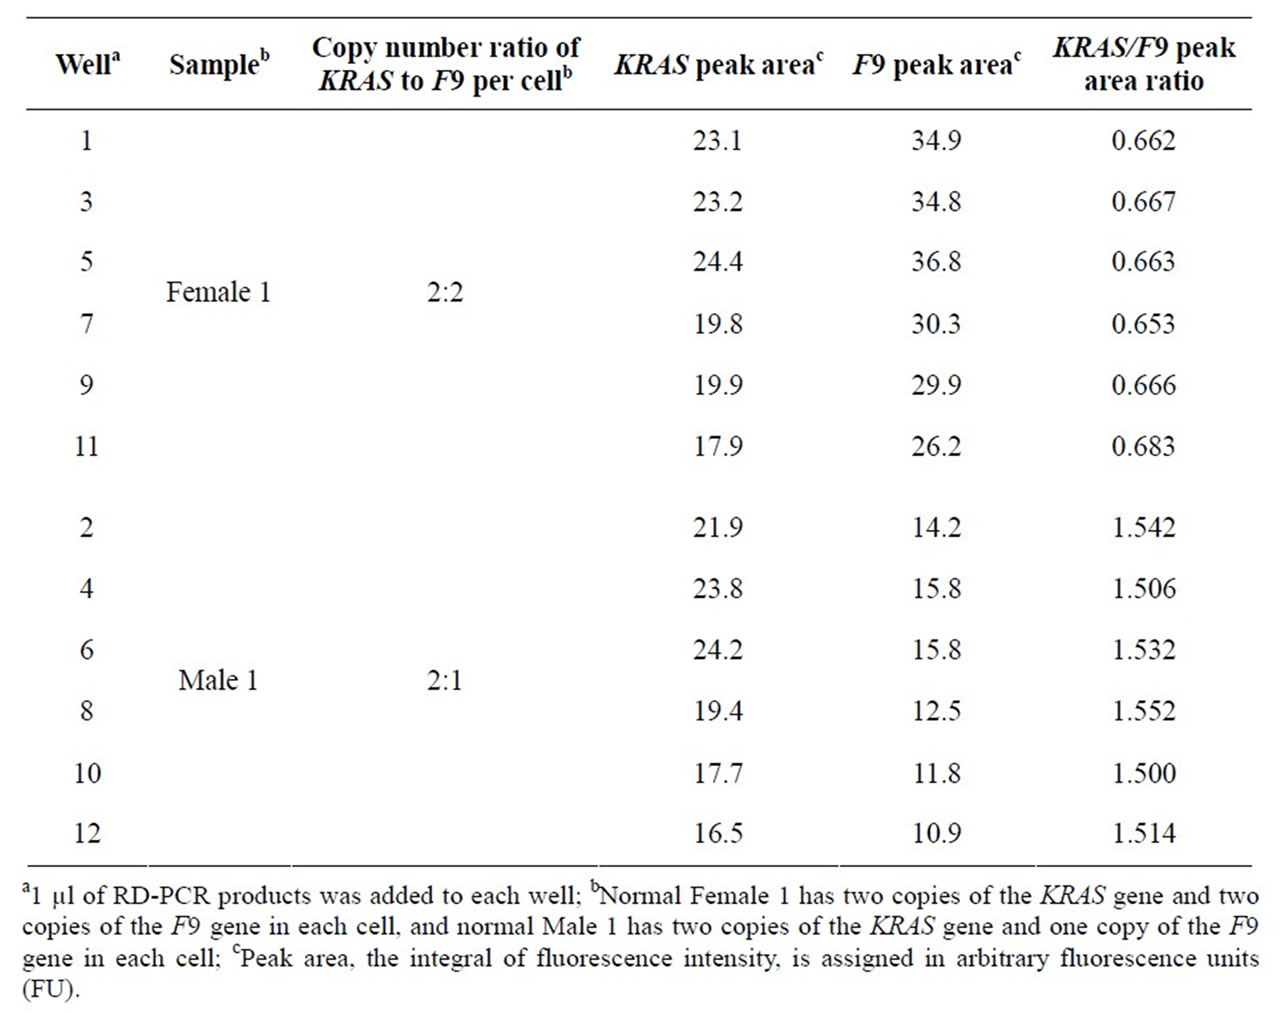
Table 2(a). The effect of well positions on ROY of the KRAS and F9 genes.
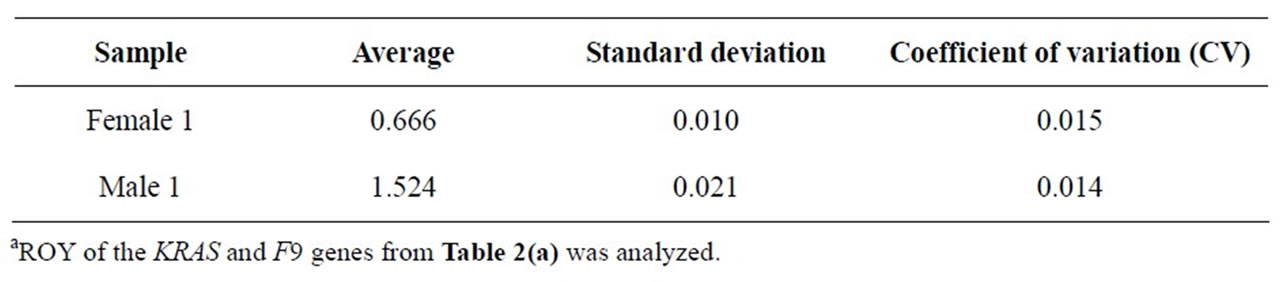
Table 2(b). Statistical analysis of ROY of the KRAS and F9 genesa.
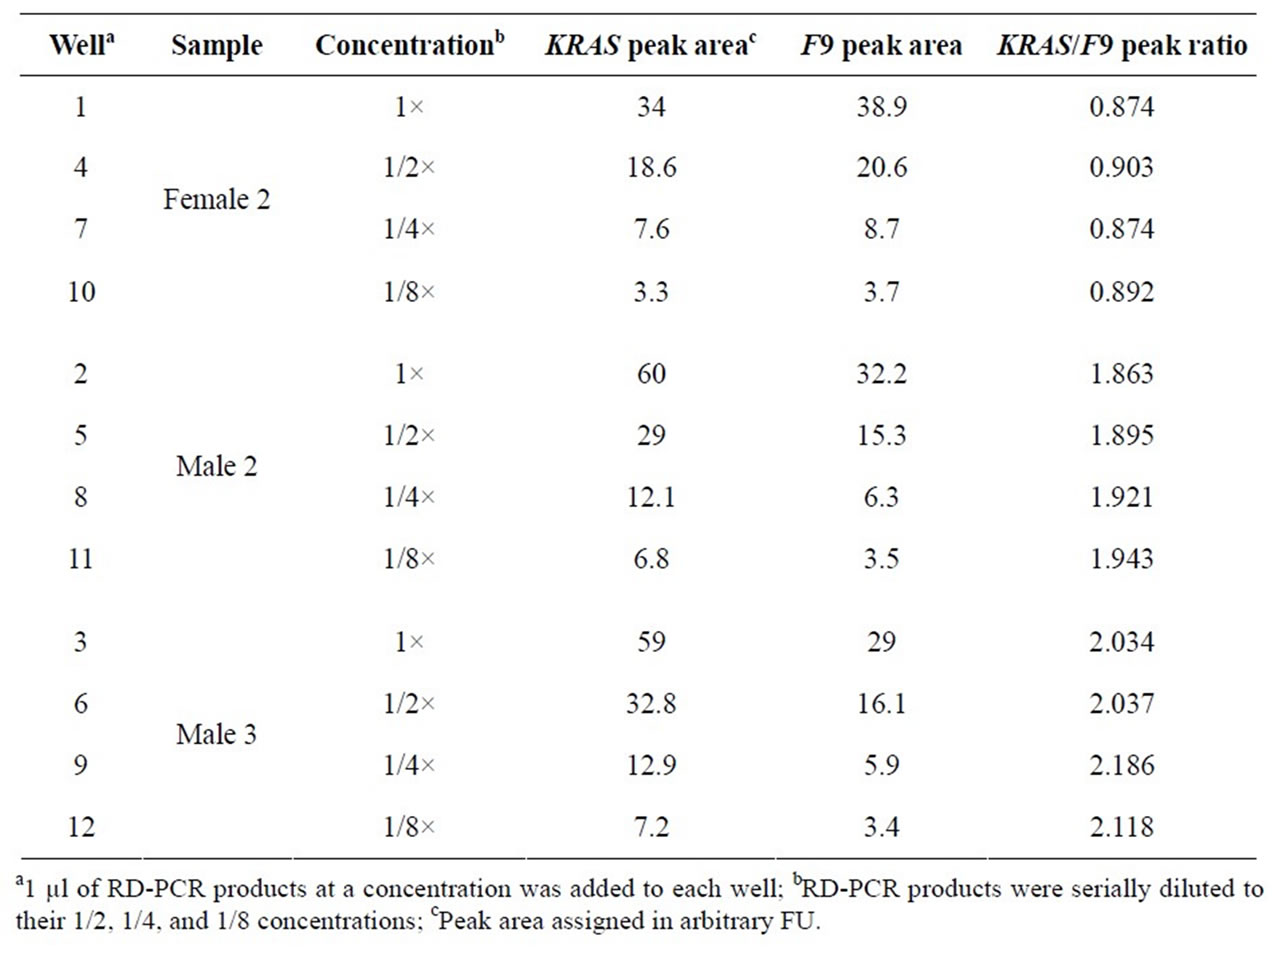
Table 3(a). The effect of product concentrations on ROY of the KRAS and F9 genes.
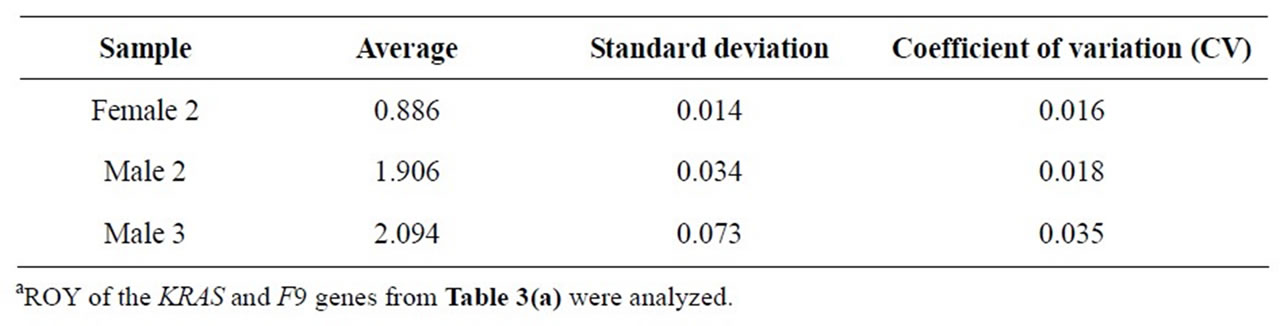
Table 3(b). Statistical analysis of ROY of the KRAS and F9 genesa.
F9 gene. Then the ROY was quantified and converted to its template copy number ratio (ROT) due to high linearity and high correlation. In detail, from analyzing the results of 6 male and 4 female NSCLC patient samples, the linear equation is set as ROY = 1.094∙ROT + 0.163 with R = 0.961. Thus, for an unknown patient sample, the linear equation was used to convert the ROY to its ROT. 85% ROT ratio of tumor tissues to their paired normal tissues (T/N ROT ratio) was set as detection limit for deletions, an equivalent when 30% of diploid cells delete one copy of the KRAS gene.
Thus, we identified six KRAS deletions in tumor tissues, but not in their paired normal tissues (Table 4), confirming our previous finding. In addition, our results were similar to those by gel electrophoresis and Typhoon™ 9410 Variable Mode Imager except for one patient with a boundary value (T/N ROT ratio = 0.96 by Agilent 2100 Bioanalyzer vs 0.85 by gel electrophoresis). The KRAS deletions were also verified by fluorescence in situ hybridization (FISH) in individual tumor cells (data not shown).
4. SUMMARY
We applied the Agilent 2100 Bioanalyzer, a microfluidicsbased electrophoresis instrument, rather than conventional gel electrophoresis, to detect somatic gene deletions.
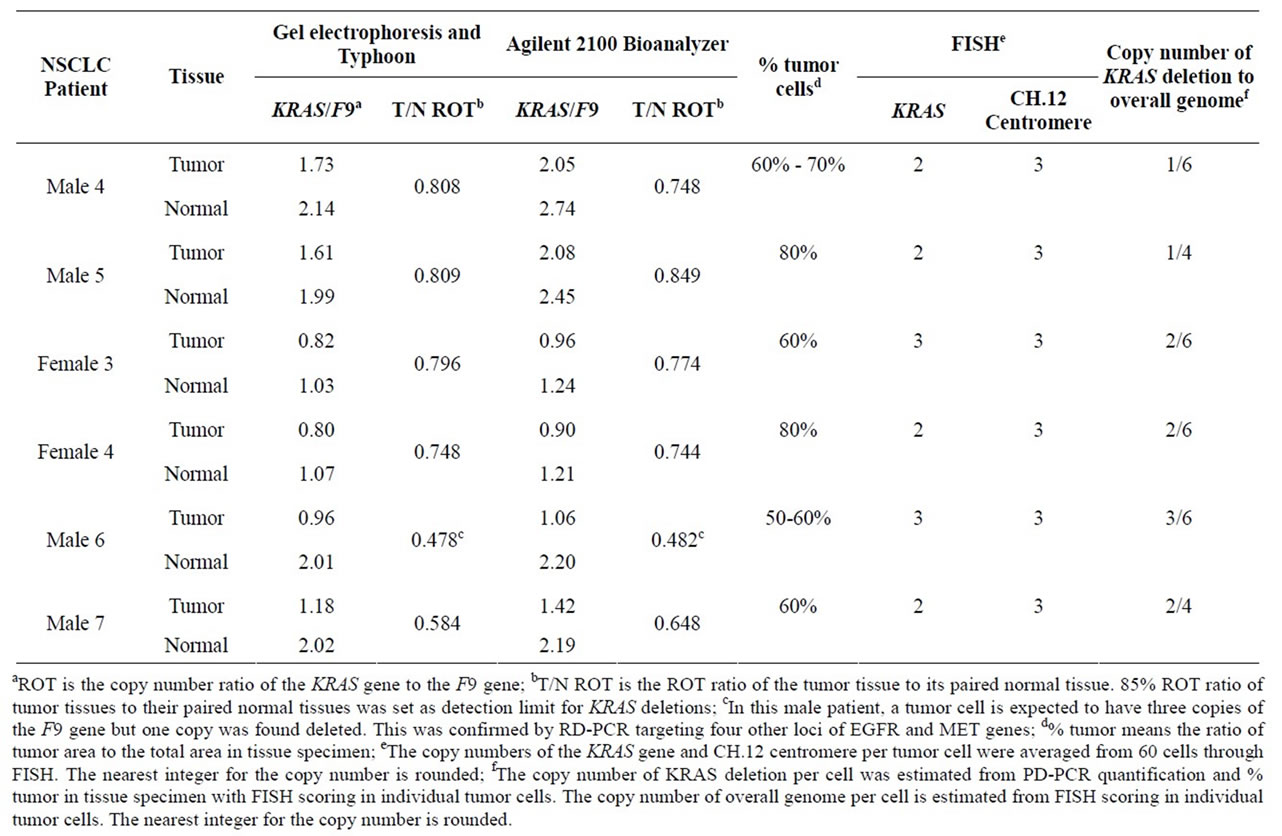
Table 4. Comparison of Agilent 2100 Bioanalyzer with conventional gel electrophoresis.
In this study, we extensively validated the consistency and accuracy of the approach. Furthermore, we applied this approach to identify six somatic KRAS deletions in NSCLC patients, confirming our previous finding. Thus, the Agilent 2100 Bioanalyzer is simple, reliable, quick, and ultimately able to replace conventional gel electrophoresis for the detection of somatic gene deletions.
REFERENCES
- Mertens, F., Johansson, B., Hoglund, M. and Mitelman, F. (1997) Chromosomal imbalance maps of malignant solid tumors: A cytogenetic survey of 3185 neoplasms. Cancer Research, 57, 2765-2780.
- Nguyen, V.Q., Liu, Q. and Sommer, S.S. (2009) Robust dosage PCR (RD-PCR) for highly accurate dosage analysis. In: Current Protocols in Human Genetics, John Wiley & Sons, Inc., New York.
- Liu, Q., Li, X., Chen, J.S. and Sommer, S.S. (2003) Robust dosage-PCR for detection of heterozygous chromosomal deletions. Biotechniques, 34, 558-562, 565-556.
- Nguyen, V. Q., Shi, J., Liu, Q. and Sommer, S.S. (2004) Robust dosage (RD)-PCR protocol for the detection of heterozygous deletions. Biotechniques, 37, 360, 362, 364.
- Shi, J., Shibayama, A., Liu, Q., Nguyen, V.Q., Feng, J., Santos, M., Temudo, T., Maciel, P. and Sommer, S.S. (2005) Detection of heterozygous deletions and duplications in the MECP2 gene in Rett syndrome by Robust Dosage PCR (RD-PCR). Human Mutation, 25, 505. doi:10.1002/humu.9338
- Mueller, O., Hahnenberger, K., Dittmann, M., Yee, H., Dubrow, R., Nagle, R. and Ilsley, D. (2000) A microfluidic system for high-speed reproducible DNA sizing and quantitation. Electrophoresis, 21, 128-134. doi:10.1002/(SICI)1522-2683(20000101)21:1<128::AID-ELPS128>3.0.CO;2-M
- Panaro, N.J., Yuen, P.K., Sakazume, T., Fortina, P., Kricka, L.J. and Wilding, P. (2000) Evaluation of DNA fragment sizing and quantification by the agilent 2100 bioanalyzer. Clinical Chemistry, 46, 1851-1853.
NOTES
*Corresponding author.