Advances in Entomology
Vol.2 No.1(2014), Article ID:41837,8 pages DOI:10.4236/ae.2014.21009
Genetic variations of Chrysomya megacephala populations in Malaysia (Diptera: Calliphoridae)
1School of Science, Monash University, Bandar Sunway, Selangor, Malaysia
2School of Medicine, Universiti Malaysia Sabah, Kota Kinabalu, Sabah, Malaysi; *Corresponding Author: chuath@gmail.com
Copyright © 2014 Yi Vern Chong et al. This is an open access article distributed under the Creative Commons Attribution License, which permits unrestricted use, distribution, and reproduction in any medium, provided the original work is properly cited. In accordance of the Creative Commons Attribution License all Copyrights © 2014 are reserved for SCIRP and the owner of the intellectual property Yi Vern Chong et al. All Copyright © 2014 are guarded by law and by SCIRP as a guardian.
Received 16 November 2013; revised 20 December 2013; accepted 31 December 2013
KEYWORDS
Populations Genetics; Chrysomya megacephala; COI; COII; ISSR; Malaysia
ABSTRACT
Samples of Chrysomya megacephala were collected from five sites in Malaysia, namely Penang, Selangor, Pahang, Johor, and Sabah. Molecular analysis was conducted using the cytochrome oxidase gene and ISSR-PCR to identify polymorphic markers for distinguishing the populations and to estimate the genetic relatedness among these populations. Two SNPs were detected at sequence position 952 (M1) and 1120 (M2), involving transitional substitutions with cytosine (C) being replaced with thymine (T) and guanine (G) replaced with adenine (A), but there was no amino acid variation. Penang and Selangor shared the same nucleotide T at the M1 position, while M2 variation was found in Pahang population only. The NJ tree based on the COI sequence showed two main groups with branch A comprised of Penang and Selangor populations while branch B consisted of Johor, Pahang and Sabah populations. ISSR analysis indicated that 18 scorable bands (size 200 to 1800 bp) were amplified with UBC808 and UBC835, 11 bands of which were polymorphic and the rest monomorphic. Sabah population was left out for further analysis due to small number of specimens. UPGMA dendrogram using ISSR data showed two branches, one consisted of Penang and Selangor populations, while the other consisted of Pahang and Johor individuals. The polymorphic loci (P) for Johor Baru were 5.56%, Penang 16.70%, Selangor and Pahang 22.2%. Nei’s H values are respectively 0.018, 0.060, 0.050 and 0.051. Similarly the Shannon index diversity values are respectively 0.028, 0.089, 0.085 and 0.087. The lowest genetic dis- tance (0.0997) was between Penang and Selangor populations, while the highest (0.613) was observed between Penang and Pahang populations. AMOVA shows low genetic differentiation among individuals within populations and that 85.6% of total genetic variance was among individuals between populations. This was also indicated by FST statistic of 0.8562. The gene flow between populations was low with Nm of 0.042, and Mantel’s test indicated a significant correlation between genetic distance and log geographic distance (P < 0.05 from 10,000 randomizations). In conclusion the Penang and Selangor fly populations are similar genetically, compared to the other populations.
1. INTRODUCTION
Chrysomya is endemically restricted to the Old World tropics, and several species including C. megacephala (Fabricius), C. rufifacies (Macquart), C. bezziana (Villeneuve), C. albiceps (Wiedemann) and C. putoria (Wiedemann) are among the most abundant forensically important flies in the world. Studies have shown that these species are rather invasive and have displaced the native species through competition for substrate and ecological niches [1,2]. C. megacephala (Fabricius, 1794) and C. rufifacies are also medically important and have been reported to cause myiasis, and act as mechanical carriers and reservoirs of pathogens which cause gastrointestinal diseases such as typhoid, dysentery and diarrhea [3-5].
Although C. megacephala is indigenous to South-East Asia, it is now widely distributed in the oriental and Australasian regions. It has been suggested that C. megacephala is continually expanding its range in the tropics and subtropics [6]. Since 1970’s, this fly species has been recorded in some African countries, Brazil and United States [7,8]. This species has been repeatedly reported to be involved in forensic investigations [9], pollination of mango seeds [10] and spreading enteric pathogens [11].
In the first Malaysian forensic entomological case of Nevin (1950) reported by Reid [12], C. megacephala larvae found in a dead woman were used in the estimation of PMI. Although many other dipteran species have been identified from human cadavers in Malaysia, this particular species is predominant. Lee et al. (2004) [13] reported that out of the 18 fly species consisting of 448 forensic specimens collected throughout the country in the period of 1972 to 2002, C. megacephala was the most common fly (48%).
Although C. megacephala is of greatest forensic importance in Malaysia, little is known about the genetics of the local populations. To date, only the larval morphology of some fly species collected from local hospitals and police stations has been characterized [13]. The genetic diversity and structure of the fly populations will give a preliminary view of the genetic background and provide a better understanding of the evolution origin of the species in Malaysia.
In this study, genetic variations among C. megacephala individuals sampled from various localities of Malaysia were investigated using the cytochrome oxidase gene (COI and COII subunits) sequence and inter-simple sequence repeat (ISSR) PCR. The main objectives of the present work were to identify polymorphic markers to distinguish the various populations of C. megacephala and to estimate the genetic relatedness among these populations. Such markers could be used in forensic investigations to identify the original place of death in cases where the body had been moved to a distant place.
2. MATERIALS AND METHODS
2.1. Sampling Sites
Five sampling sites were selected, namely Penang, Selangor, Pahang, Johor and Sabah, respectively representing northern, western, eastern, southern region of Peninsular Malaysia and East Malaysia (Figure 1). A total of 66 individuals of the flies collected from these sites were used in the molecular study (Table 1), some for both COX and ISSR analysis while some for either COX or ISSR analysis. Fish meat was used as bait to trap the flies as described by Almeida et al. [14]. The adults were identified based on the morphological keys of Kurashi et al. [15] and Sugiyama et al. [16]. For further confirmation of their identity, voucher specimens were sent to Department of Forensic Entomology, Institute of Medical Research (Malaysia). The specimens were either preserved in 96% alcohol or stored at −20˚C freezer prior to analysis. Voucher specimens of all specimens are maintained in School of Science, Monash University.
2.2. DNA Extraction
Genomic DNA of adult specimens was extracted from legs of each insect using QIAamp DNA Mini Kit (Qiagen, USA) following the manufacturer’s protocol for
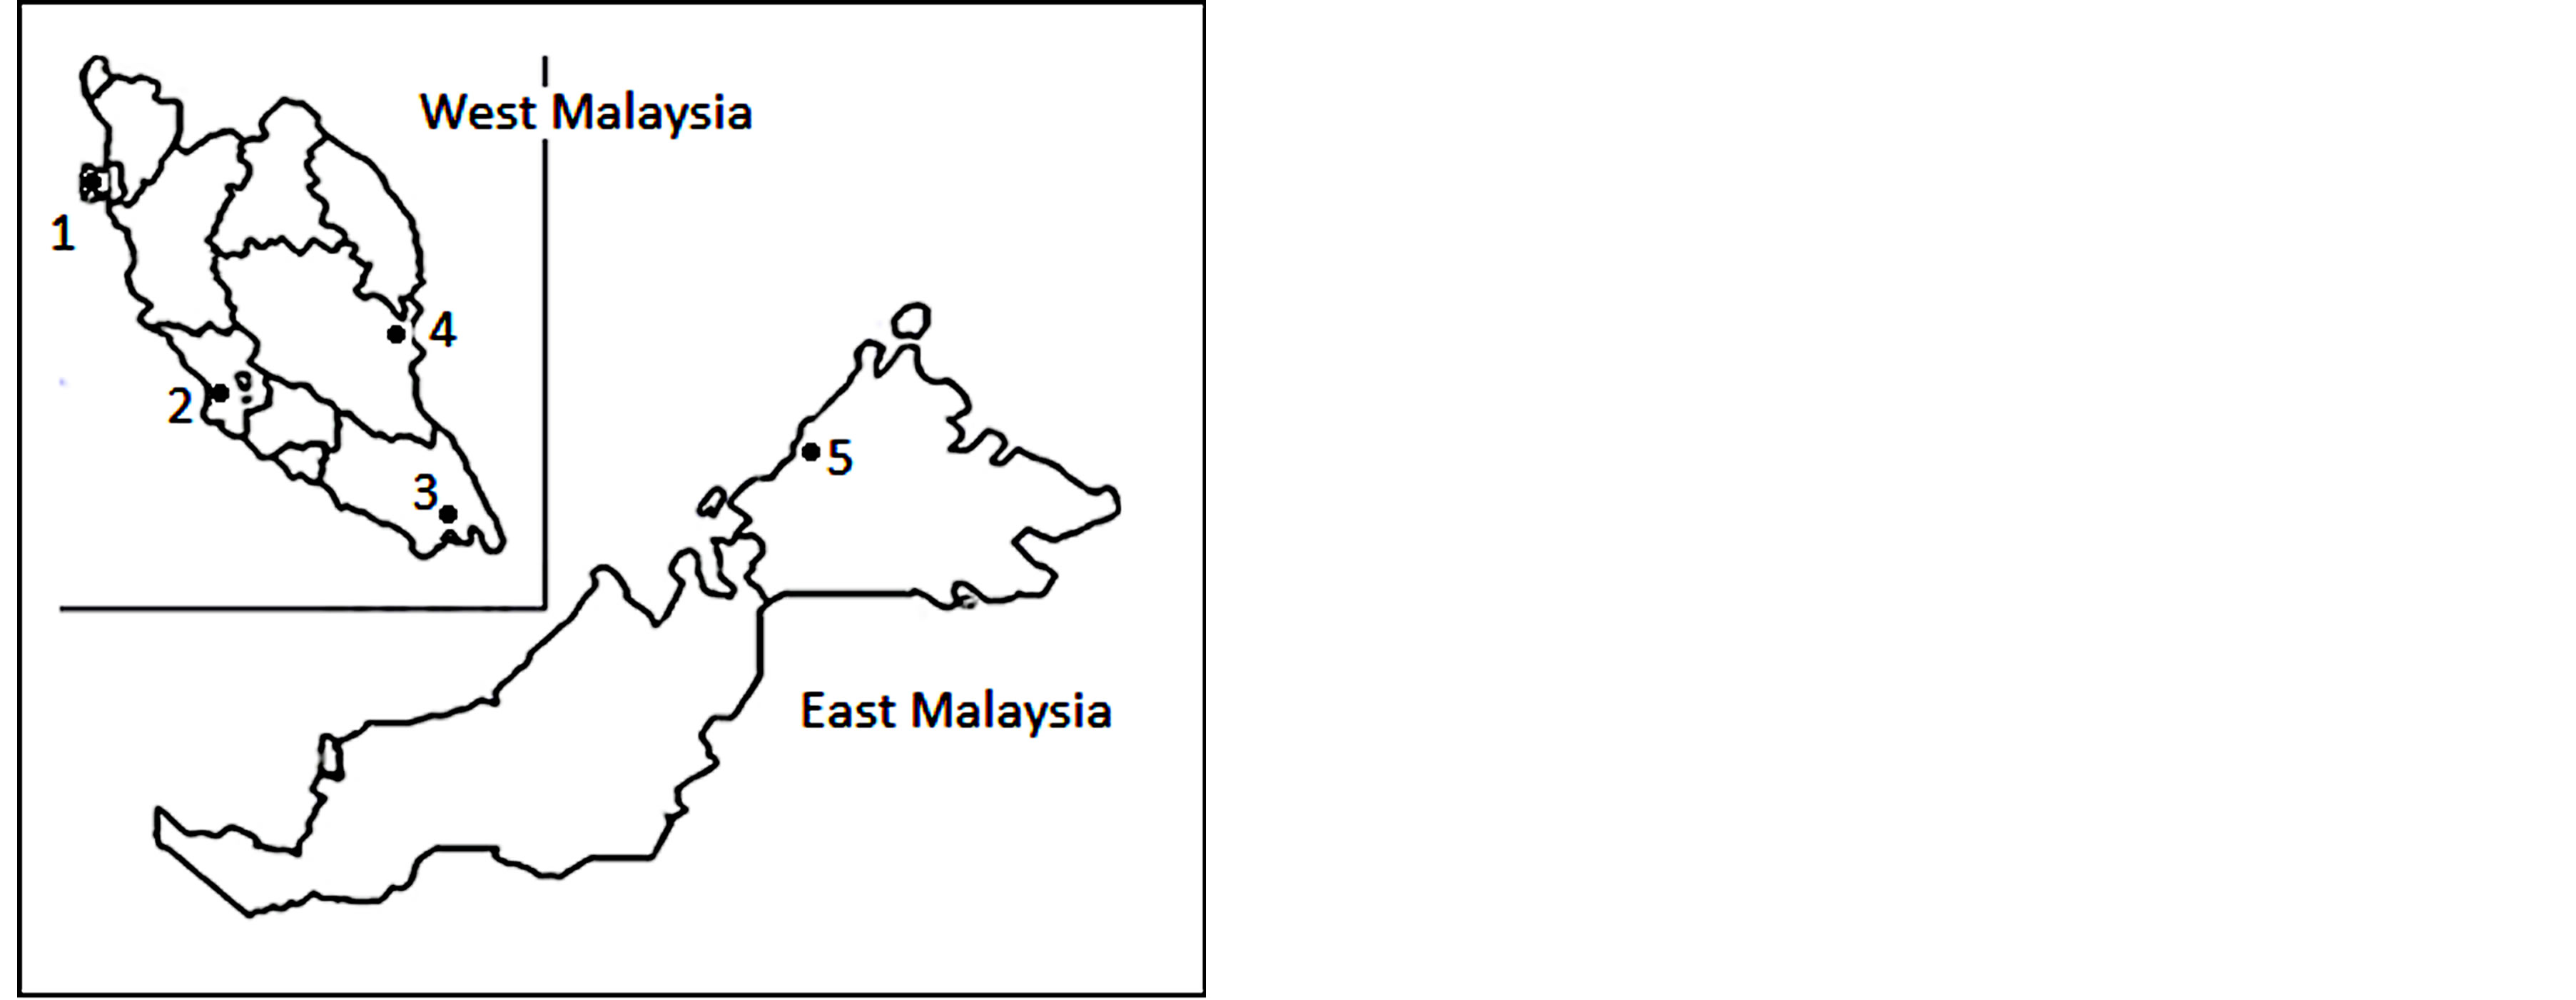
Figure 1. The sampling sites (indicated by ●) in Malaysia where C. megacephala individuals were collected for mtDNA and ISSR analysis. Four sites were in West Malaysia while one site was in East Malaysia. 1 = Penang, 2 = Selangor, 3 = Johor, 4 = Pahang, 5 = Sabah.
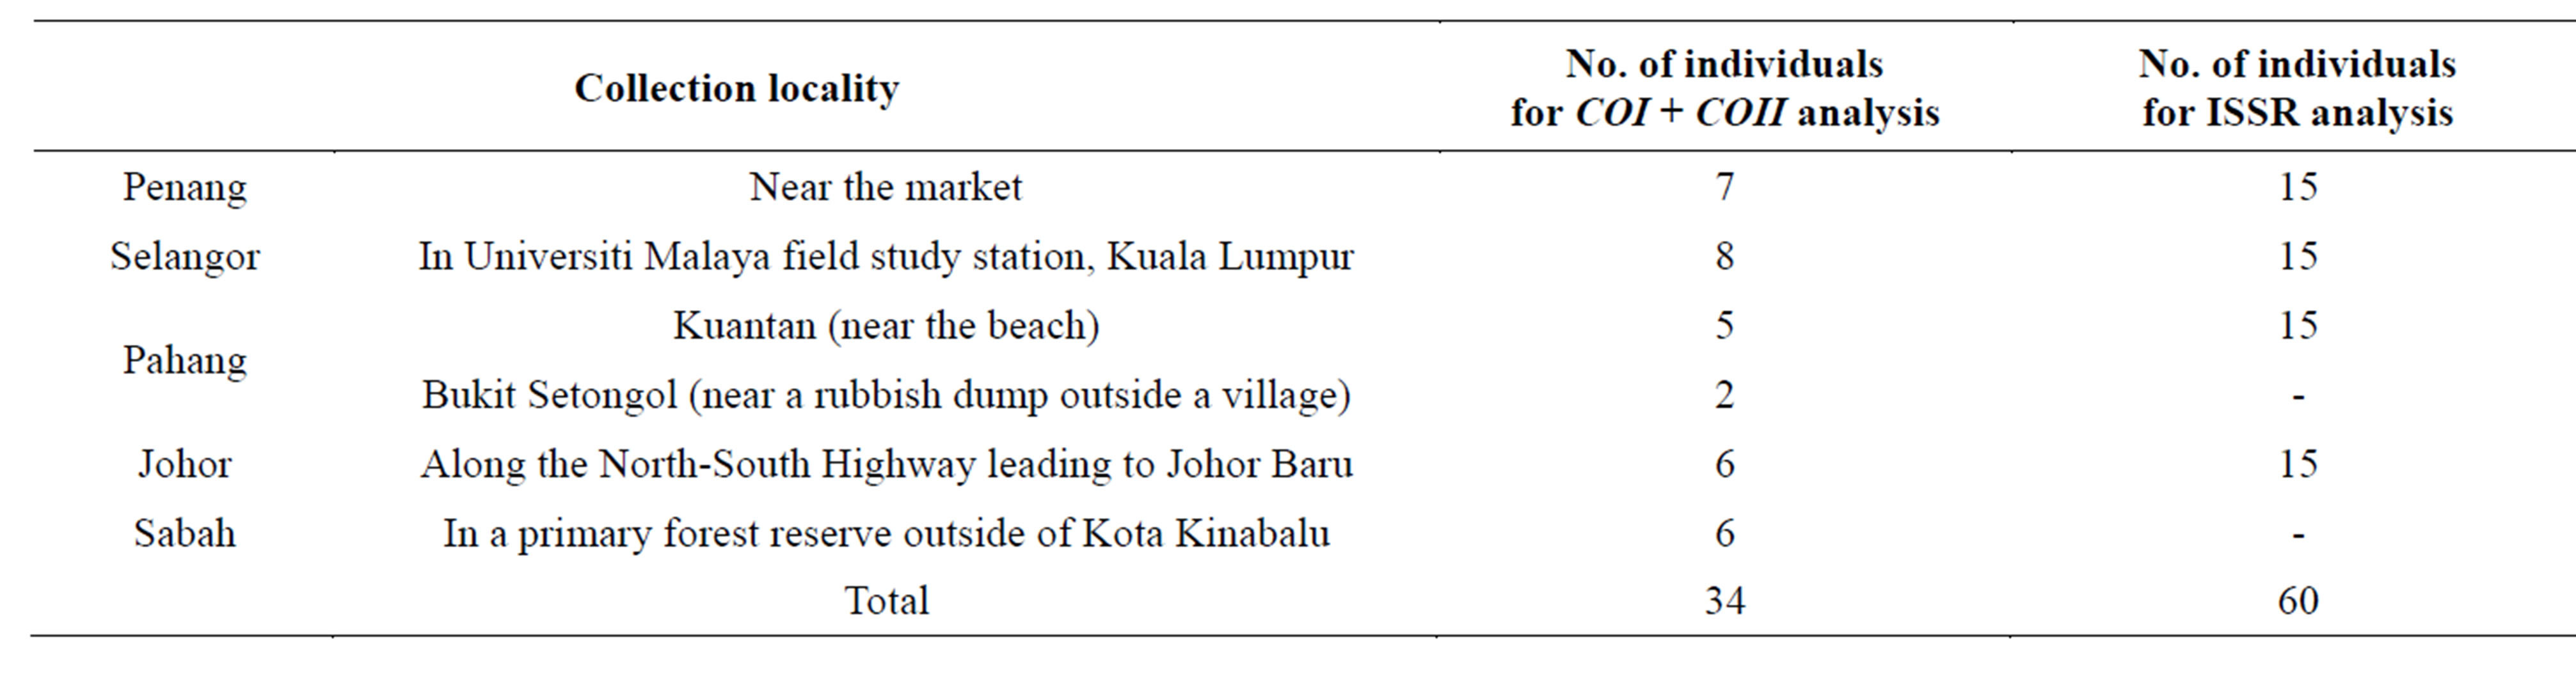
Table 1. Number of C. megacephala individuals collected from five sites in Malaysia which were used in the study.
animal tissue. The legs were placed into an autoclaved 1.5 ml microcentrifuge tube containing 180 µl of buffer ATL (Tissue Lysis Buffer from Qiagen) and 20 µl of proteinase K. Sample were then homogenized with pestles and incubated in a 55˚C water bath for 6 h or overnight. Extracted DNA was quantified using the Nanodrop 1000 spectrophotometer (Thermo Fisher Scientific, USA) and stored at −20˚C freezer prior to analysis.
2.3. DNA PCR Amplification and Sequencing of Cytochrome Oxidase I (COI) and Cytochrome Oxidase II (COII) Gene
A total of 34 C. megacephala individuals from the five populations were used for this (Table 1). PCR amplifications of COI gene were performed using primers as designed by Sperling et al. [17] (1994) (Table 2). The 25- µl reaction mixture contained 50 mM KCl, 10 mM TrisHCl (pH 9.0), 25 µM each of dATP, dCTP, dGTP and dTTP, 1.25 mM MgCl2, 0.4 µM of each forward and reverse primer, 1 U GoTaq DNA Polymerase (Promega, Madison, WI), and approximately 20 to 30 ng of DNA template. PCR amplifications were performed in a MJ Mini Personal Thermal Cycler (Biorad, USA) for an initial 5 min denaturation at 94˚C followed by 35 cycles of 1 min at 93˚C, 1 min at 48˚C and 2 min at 72˚C.
Amplifications of COII locus were performed using primers C1-J-2495 (5’-CAG CTA CTT TAT GAG CTT TAG G-3’) and TK-N-3775 (5’-GAG ACC ATT ACT TGC TTT CAG TCA TCT-3’). PCR reactions were carried out as for COI, except the annealing temperature was 54˚C.
The amplified products were separated by electrophoresis in 1% agarose gel run in TAE buffer, stained with GelRed (Biotium, USA), viewed under ultraviolet light and photographed. The DNA fragment sizes were estimated by comparing with 1kb commercial markers (Promega, Madison, WI). The band corresponding to the target PCR product was excised and purified using Qiagen QIAquick Gel Extraction Kit. All samples were then sent to First BASE Laboratories Sdn. Bhd. (Malaysia) for sequencing.
All nucleotide sequences obtained were manually edited using BioEdit [18], checked using BLAST search against the NCBI dataset for fly genomes. The sequences of the 34 individuals were aligned using CLUSTALW [19]. C. megacephala COI and COII gene sequences retrieved from GenBank were also included in the alignment. All sequences assembled were subject to Neighbour Joining analysis (NJ) using MEGA 5.0 program [20] with Tamura-Nei substitution model. Bootstrap proportions were calculated by 500 replicates from the data set.
2.4. DNA ISSR-PCR Amplification
A total of 32 oligonucleotides were randomly chosen from ISSR primer set developed by the University of British Columbia Biotechnology website (UBC primer set 9, accessible at http://www.scribd.com/doc/23812434/UBC-Primer-Set). These primers were screened and tested for their applicability in ISSR experiments. Two primers, namely UBC808 and UBC835, which produced bright and reproducible fragments, were selected and used in further amplification of the gene in the study.
PCR conditions, including the concentration of DNA (10 - 50 ng), MgCl2 (1.0 - 3.5 mM), primer (0.1 - 0.4 µM), dNTP (0.1 - 0.25 mM) and Taq DNA polymerase (0.5 - 1.5 U) were optimized. In addition, the optimal annealing temperature of each oligonucleotide was optimized to produce ISSR banding patterns of high intensity and clear background. Each reaction was carried out in 25 ml reaction mixture, containing 50 mM KCl, 10 mM Tris-HCl (pH 9.0), 25 µM each of dATP, dCTP, dGTP and dTTP, 2.5 mM MgCl2, 0.4 µM of the primer, 1 U GoTaq DNA Polymerase (Promega, Madison, WI), and approximately 20 - 30 ng of DNA template. Amplifications of DNA were carried out in GeneAmpÒ PCR System 2400 (Perkin-Elmer) thermal cycler for an initial 3 min denaturation at 94˚C followed by 40 cycles of 1 min at 93˚C, 3 min at 35˚C and 2 min at 72˚C. The amplified products were separated according to size on 1.5% agarose gels in TAE (pH 8.0) buffer, stained with GelRed (Biotium, USA), viewed under ultraviolet light and photographed. The DNA fragment sizes were estimated by comparing with 100 bp ladder (New England Biolabs,
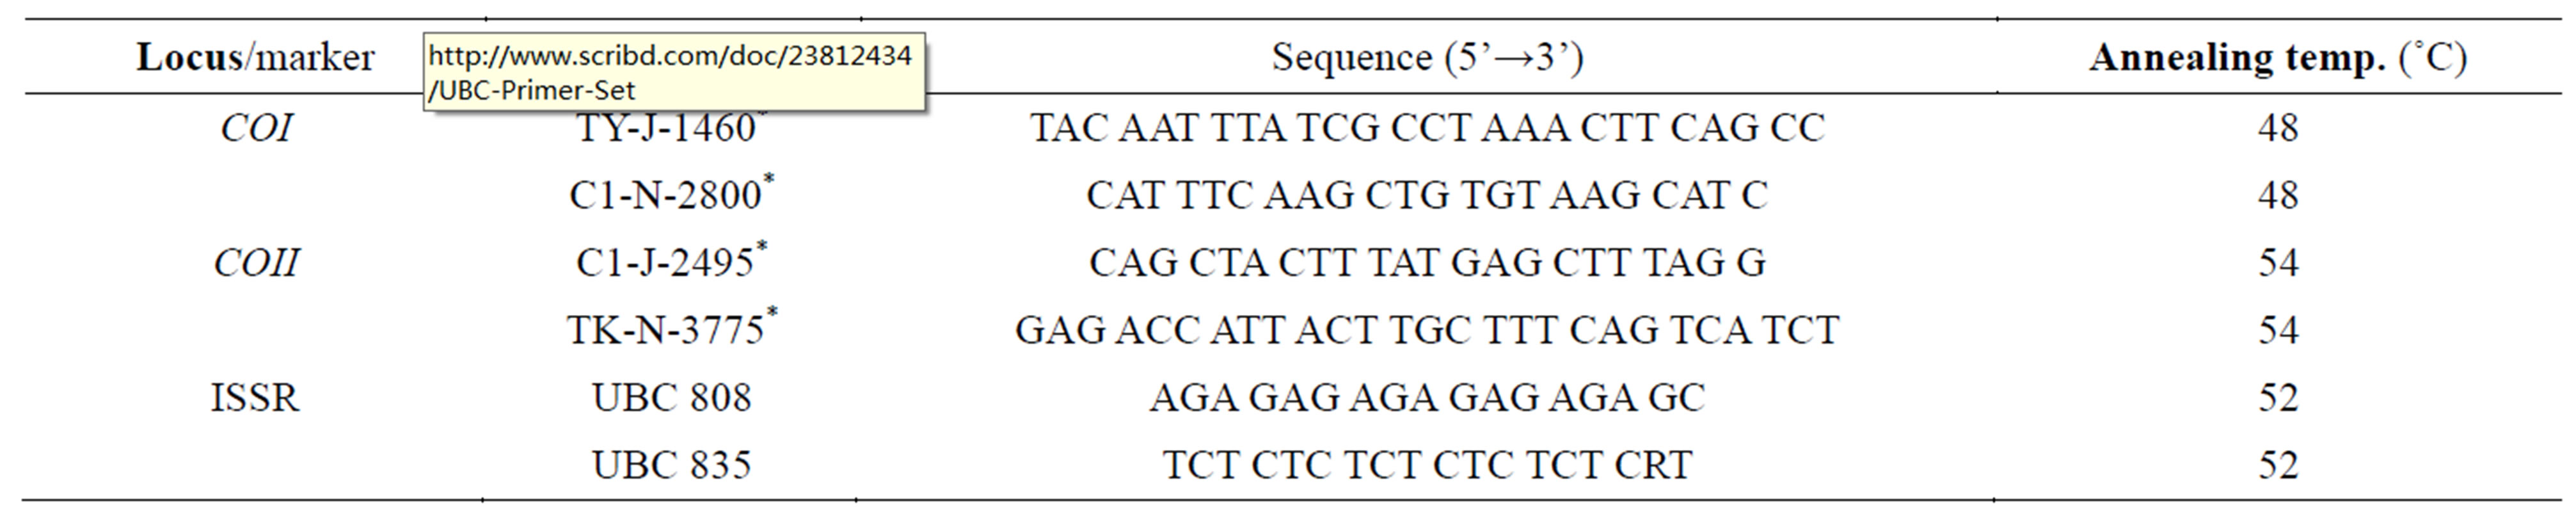
Table 2. List of primers used in PCR amplifications of COI and COII loci and ISSR analysis. Primers marked with * were designed by Sperling et al. (1994), while UBC primers were from University British Columbia, accessible at http://www.scribd.com/doc/23812434/UBC-Primer-Set.
MA). All PCR reactions were duplicated to ascertain the reproducibility of the amplification. Only reproducible bands were considered in this study. The data were scored as presence (1) or absence (0) of a certain band.
A total of 15 individuals collected from each of the four populations, namely Penang, Selangor, Pahang and Johor were used in ISSR analysis (Table 1). Individuals from Sabah were excluded because of the small number of individuals collected.
PCR reactions and agarose gel electrophoresis were repeated at least twice to ascertain the reproducibility of the ISSR profiles. Only reproducible ISSR fragments ranging in size from 200 to 2000 bp were scored. The presence or absence of the bands was recorded as present (1), absent (0) or missing data (?). These ISSR data were used to compile a binary matrix for the further analysis.
2.5. Population Genetics Analysis
Nei’s [21] genetic distance among the samples was calculated using the POPGENE Version 1.3 [22]. The genetic distances were then used to construct a dendrogram using the non-parametric Unweighted Pair Group Method with Arithmetic Mean (UPGMA). Genetic variability of the fly populations for the ISSR loci was measured by estimating the percentage of polymorphism (h), number of alleles (Ne) and Shannon’s index (I).
Genetic differentiation between populations was quantified using the coefficient of gene differentiation (GST) of Nei [23], which is regarded as a weighted average of FST for all alleles using Eq.1.
 (1)
(1)
where HT = total genetic diversity in the populations, HS = mean diversity within each population and DST = the total genetic diversity distributed among populations [24].
An estimate of theoretical gene flow (Nm) was obtained using an infinite island model [25] (Eq.2),
 (2)
(2)
where N is the effective population size and m is the migration rate.
To analyze the genetic structure and variability among populations and among individuals and within populations, analysis of molecular variance (AMOVA) program 3.5 [26] was performed using Arlequin. The variation component was partitioned among individuals within population and among (between) populations. Wright’s Fstatistic (FST) was calculated using the method by Weir & Cockerham [27] (Eq.3) and the Weir’s (1990) [28] nomenclature (FST = θ) was used:
 (3)
(3)
Finally, isolation by distance (IBD) was analysed by assessing the correlation matrix between pairwise genetic distances and geographical distance between populations using a Mantel’s test in the program IBD [29]. Statistical significance was assessed through 10,0000 random permutations of the data. Mantel test for matrix correspondence was also performed
3. RESULTS
3.1. COI and COII Sequence Amplification and Analysis
The aligned nucleotide sequence of the fly samples was of 1249-bp of the COI and 1140-bp of COII loci. No insertions or deletions were identified in both genes. All sequences were deposited in the GenBank database under accession numbers JX027548 to JX027581.
Multiple sequence alignment of the sequenced COI and COII fragments from the 34 C. megacephala individuals revealed two SNPs at sequence position 952 (M1) and 1120 (M2). Both were found to involve transitional substitutions [cytosine (C) is replaced with thymine (T) and guanine (G) is replaced with adenine (A) respectively], and did not result in amino acid variation.
All individuals from Penang and Selangor shared the same nucleotide T at the M1 position and differed from those of samples from other populations. However, sequence polymorphisms were detected at the M2 within the Pahang samples. Two out 34 individuals sequenced shared the same nucleotide G, while an A was detected in all other individuals in the study.
No further analysis was conducted on COII locus as no sequence variation of the gene was detected.
The NJ tree based on the COI sequence alignment (Figure 2) separated the 34 fly individuals into two main groups (A and B) with branch A comprised individuals from Penang and Selangor and branch B consisted of samples originated from Johor, Pahang and Sabah.
3.2. ISSR-PCR Amplification
The total number of scorable bands amplified with UBC808 and UBC835 in this study was 18, ranging in size from 200 to 1800 bp. Eleven of the bands (61.1%) were polymorphic and seven were monomorphic. The optimized ISSR protocol resulted in highly reproducible banding patterns (supplementary data).
3.3. Genetical Analysis of C. megacephala Populations
The percentage of polymorphic loci (P) varied between populations ranging from 5.56% to 22.2% (Table 3). Higher P values (22.20) were observed for both Selangor and Pahang populations compared to Penang and Johor Baru populations. All the populations studied are
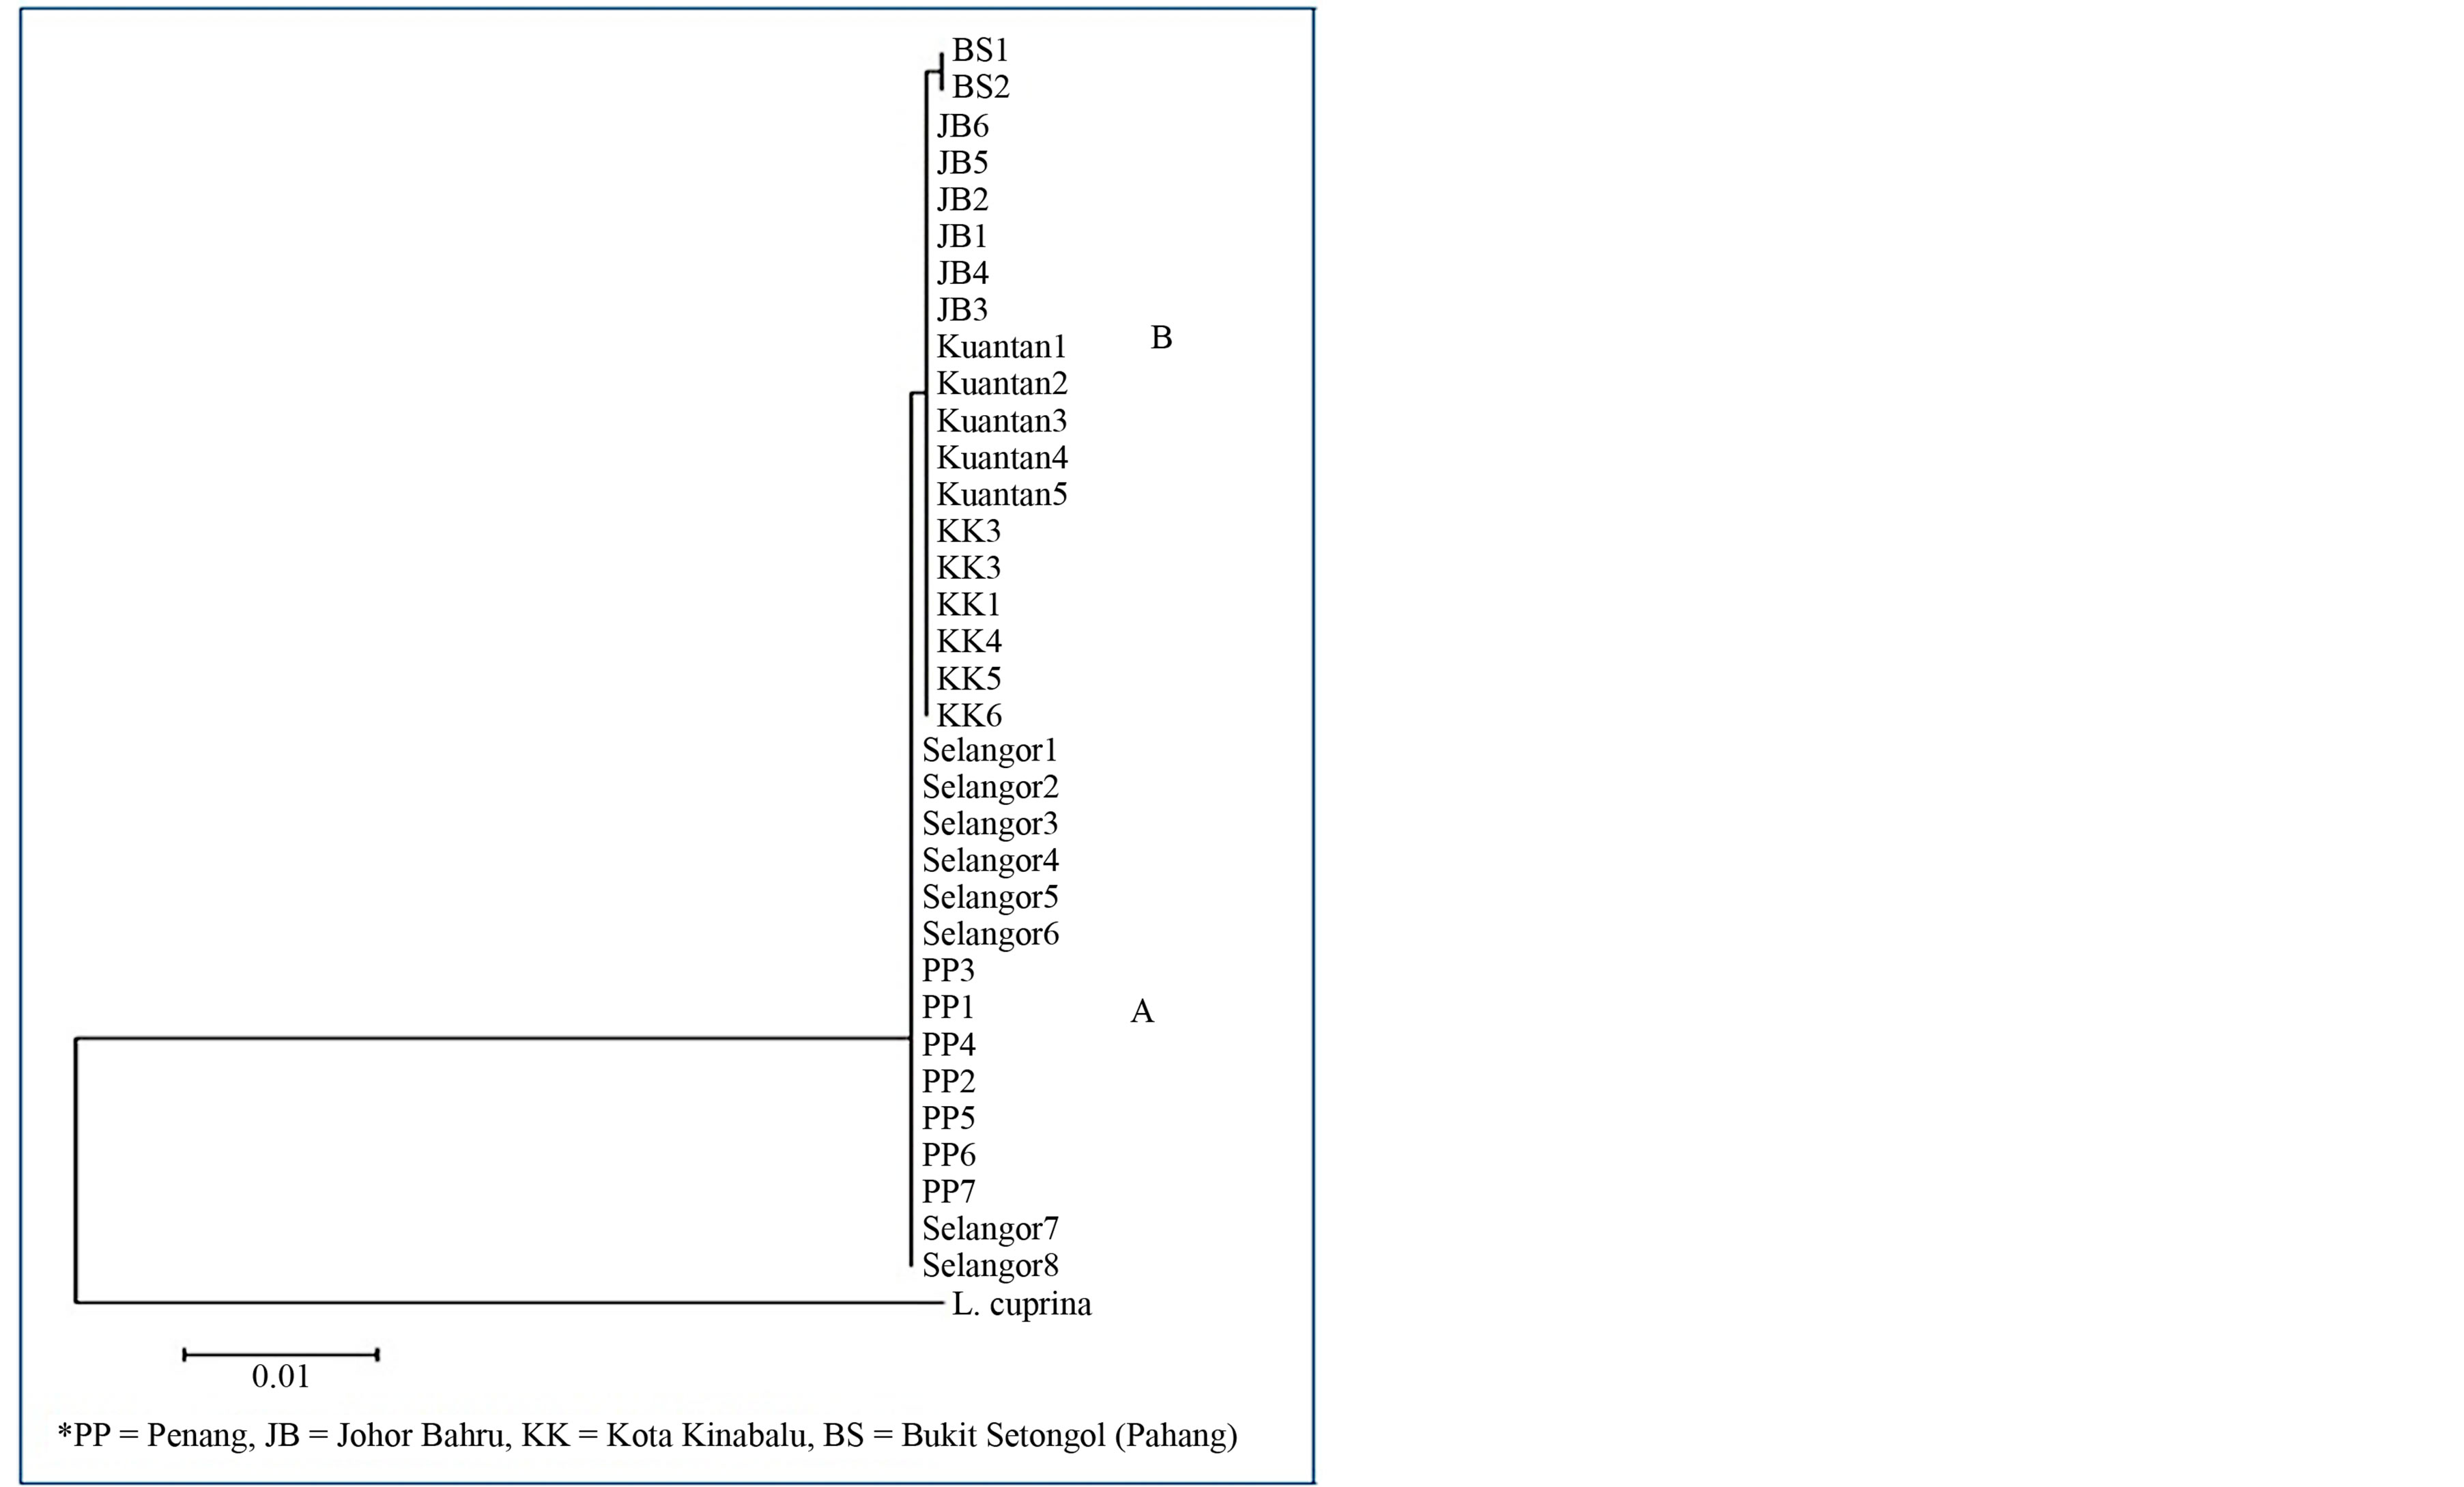
Figure 2. Neighbour joining tree based on COI gene of the C. megacephala individuals from four different states of Malaysia. Both Bukit Setogol (BS) and Kuantan are in Pahang. PP = Penang, KK = Kota Kinabalu, JB = Johor Baru. Lucilia cuprina was used as an outgroup.
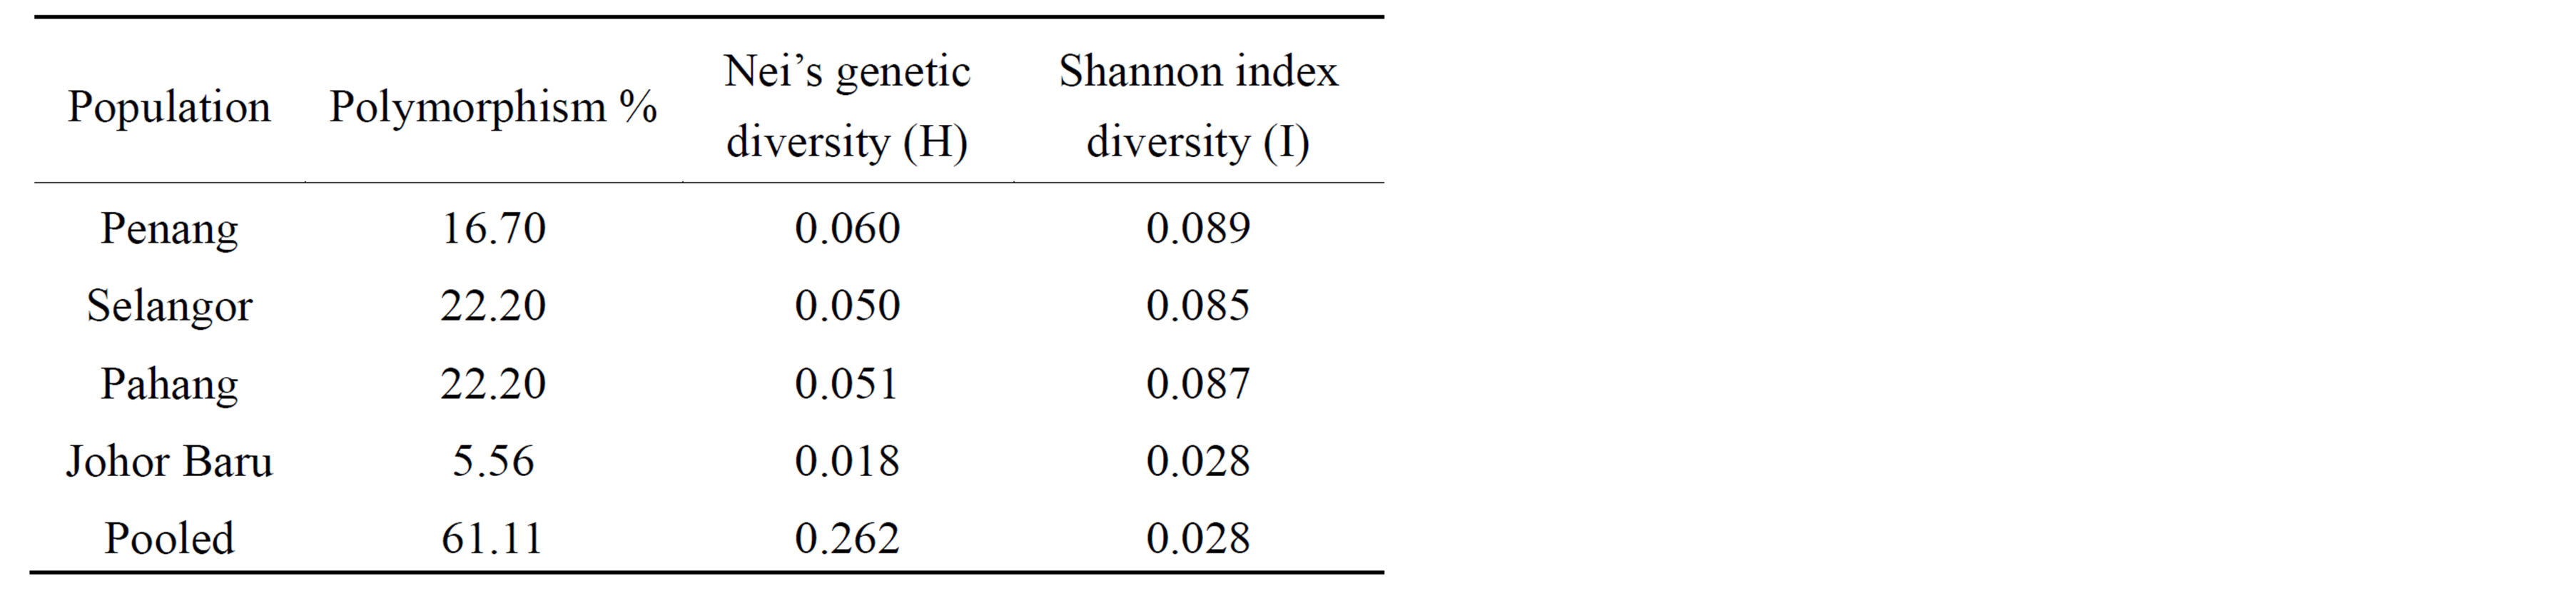
Table 3. Comparison of genetic parameters for the four populations: percentage of polymorphic loci (P); Nei’s genetic diversity (H), Shannon diversity index (I) for ISSR marker loci between C. megacephala individuals from four states of Malaysia.
relatively low in genetic diversity, with Nei’s H values ranging from 0.018 in Johor Baru to 0.060 in Penang, with an average genetic diversity across all states of 0.262. The lowest genetic distance (0.0997) was observed between Penang and Selangor populations, while the highest genetic distance (0.613) was observed between Penang and Pahang population (Table 4).
Shannon index diversity (I) showed a genetic similarity pattern similar to Nei’s genetic diversity (H) in which Penang and Johor populations have the highest (0.089) and lowest (0.028) index respectively (Table 3).
In the dendrogram based on ISSR analysis by using UPGMA (Figure 3), the flies were grouped in two major branches (X and Y). The tree topology was similar to the COI-based tree, with branch X contained Penang and Selangor populations and branch Y comprised of Pahang and Johor individuals.
The AMOVA partition suggests that there is low genetic differentiation among individuals within populations (Table 5) and that 85.6% of total genetic variance was among individuals between populations. This low genetic variation within populations was supported by the FST of 0.8562 indicating a large genetic differentiation between populations. The highest genetic differentiation was found between Penang and Selangor populations (0.6131) while the lowest genetic differentiation was between Penang and Johor populations (0.0997).
The gene flow between populations was low with Nm of 0.042, while the Nm values within populations ranged from 0.025 (Penang-Johor Baru) to 0.1695 (SelangorPenang) which are consistent with the results obtained from the AMOVA and FST statistics. These results suggest that there may be isolation by distance (IBD) relationships between fly populations in Malaysia. Analysis of isolation by distance using Mantel’s test indicated a

Table 4. Genetic and geographical distances between pairs of sampling sites.

Figure 3. ISSR based UPGMA dendogram of Nei’s genetic distance showing grouping of the four populations of Ch. megacephala.
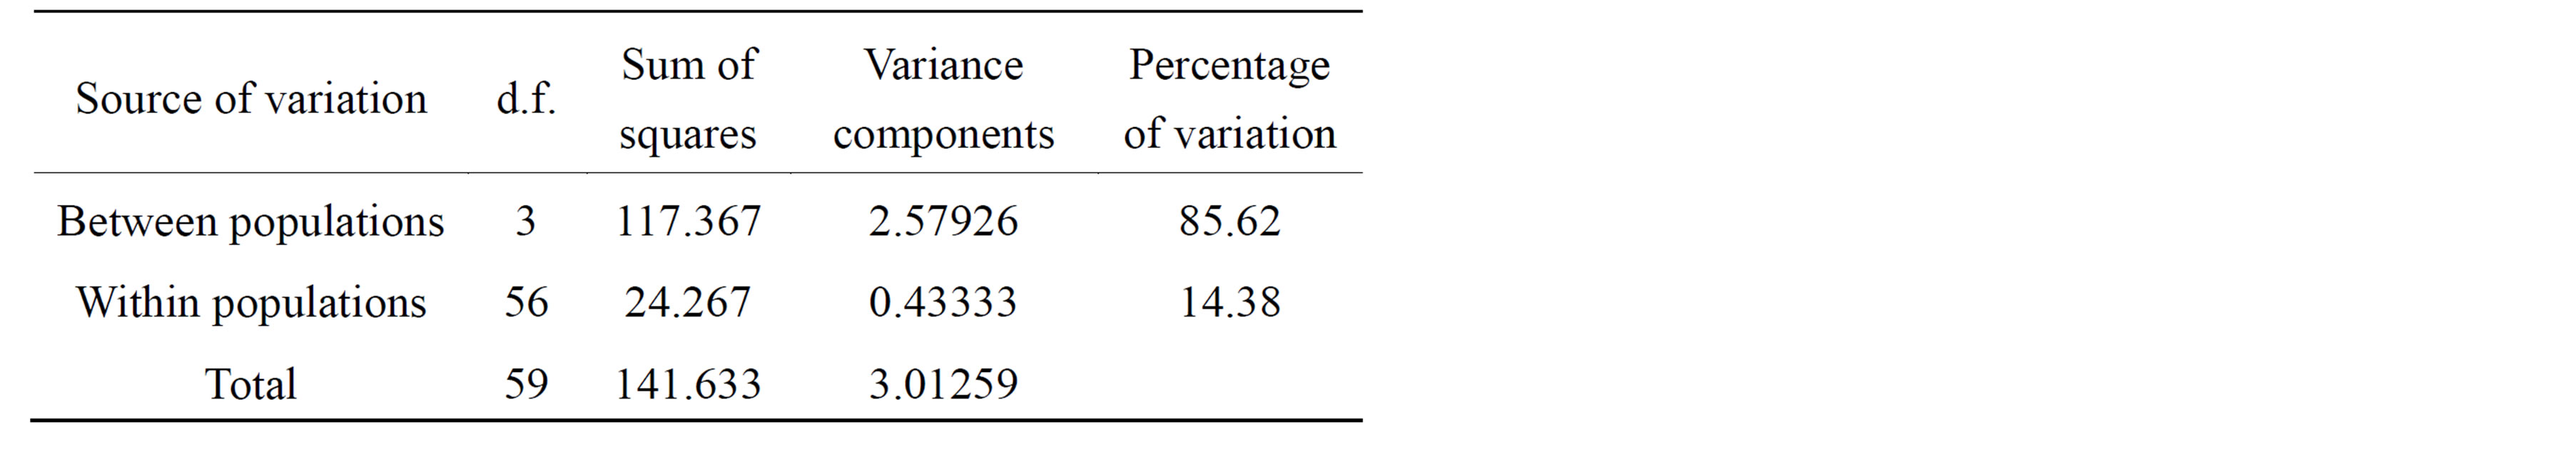
Table 5. Analysis of molecular variance (AMOVA) of Ch. megacephala fly populations from four States of Malaysia based on the ISSR loci.
significant correlation between genetic distance and log geographic distance (P < 0.05 from 10,000 randomizations).
4. DISCUSSION
C. megacephala has been reported as the most prevalent fly species sampled from cadavers at hospitals and police stations in Malaysia [13]. While these commonly found flies can be a powerful means in providing valuable information in criminal investigations, rapid and precise identification of the species can still be a problem due to the difficulty in obtaining sufficient fly tissue for morphological characterizations purposes. Therefore, knowledge in genetic variability and population structure of the species shall provide a strong basis to address the problem of fly identification. Results obtained from the present study can also be translated into genetic markers that potentially can be used to differentiate different populations of flies in Malaysia.
To investigate the genetic variation at the intraspecific level, the choice of the molecular marker is very important. It is crucial to use a molecular marker which evolves at an appropriate rate for the identification of the population structure [30]. The mitochondrial COI gene was shown to mutate at a rate which is suitable for this purpose. It has been used in population genetics studies for many insects such as tsetse fly and mosquito [31,32]. On the other hand, inter-simple sequence repeats (ISSR)-PCR technique could be used to complement sequence-based markers. It also potentially overcomes limitations of other PCR-based molecular techniques, such as the requirement of sequence data to synthesize primers for microsatellites, relatively higher cost of amplified fragment length polymorphism (AFLP) and low reproducibility of random amplified polymorphic DNA (RAPD) [33]. With a moderate concentration of MgCl2 (2.5 mM) and high amount of primer (0.4 µM), our optimized PCR protocol resulted in bright and highly reproducible banding patterns. Although only a small number of population-specific bands (6 out of 18 bands) were determined, these ISSR patterns have been successfully used as supplementary data to the COI gene sequence-based markers.
The COI gene analysis indicated that the 15 samples collected from Penang and Selangor shared the same M1 mutation sequence (replacement of A by T), which was different from those of individuals from Johor and Pahang populations. One potential explanation of this shared synonymous substitution among individuals in Penang and Selangor, which are 355 km apart, could be in support of the fact that these two states are interconnected by highway and roads and hence made migration of flies easy especially perishable goods transported daily between these two areas. The C. megacephala individuals from Pahang were collected from the seaside (Teluk Chempedak, facing the South China Sea) and the hilly area (Bukit Setongol), both of which were located furthest away from all the other places of collection in Peninsular Malaysia. Overall, the genetic diversity detected for the Malaysian C. megacephala using the COI and COII gene regions is low, indicating these regions are conserved.
For ISSR analysis, banding patterns from primer UBC835 showed lower genetic variation among populations as compared to banding patterns of primer UBC808. Primer 808 consists of poly (AG) repeats which is a common repeat motifs found in animal groups such as Drosophila melanogaster [34]. These ISSR markers revealed different levels of genetic variation among individuals of the four populations. The average number of alleles per locus was 1.6 which is much lower than the other Chrysomya spp. e.g. C. albiceps (5.7) and C. putoria (5.3) detected by microsatellite analysis [35,36].
The low genetic variation within populations revealed by AMOVA is in line with low Shannon index (ranging from 0.03 to 0.09) and Nei’s gene diversity (0.017 to 0.060). Our finding of low genetic diversity among individuals which were caught from periurban areas, is consistent with similar patterns of low genetic diversity among urban sand fly populations (Shannon Index ranged from 0.08 to 0.34) as revealed by Feitosa et al. [37]. It has been suggested that differential adaptation to changes in urban environments and urbanized habitat simplification is related to reduction in genetic variability, as noticed in genetic studies of urban mosquito populations [38] and cricket species [39]. To fully understand the effect of urbanization on C. megacephala, more representative data are required in order to provide genetic support based on the genetic variation of the fly species sampled from both urban and rural areas.
The AMOVA partition suggests that 85.6% of total genetic variance was found among populations. These observations are supported by results produced by FST analysis (0.86). This contrasts with a much lower genetic distance (0.098) obtained by Strong and Mahon [40] between populations of C. bezziana from southern Africa, the Middle East, Malaysia, Indonesia, and Papua New Guinea. In our study, the highest genetic distance (0.61) was observed for individuals between Penang and Pahang. Individuals from Penang and Selangor populations showed distinctly lower genetic distance (0.10) compared to Pahang and Johor Baru populations. Nm results suggest that there is a moderate gene flow among Penang and Selangor populations but a low gene flow between Penang and Pahang populations. These observations may be explained by that 1) there is an intensive daily transport of food materials (and also flies) between Penang and Selangor, and 2) Penang and Pahang are separated by the main Titiwangsa mountain range which essentially acts as a natural barrier between the East and West Coast of Peninsular Malaysia, and hinders the movement of flies between these two regions.
The population genetic structure of a species is influenced by a number of evolutionary factors including natural selection, gene flow, mating system and mode of reproduction [41]. Neighbour joining and maximum parsimony analysis based on the COI gene showed similar results as the dendogram from UPGMA, which suggest that the Malaysian C. megacephala individuals could be differentiated into two groups: group A consisting of Penang and Selangor population and group B consisting of Pahang, Johor Baru and Sabah populations. This grouping could be the result of the natural barrier afforded by Titiwangsa range as mentioned above. Natural barriers such as mountain ranges and rivers have also been reported to cause a similar population structure in the oriental fruit fly, Bactrocera dorsalis in Yunnan [42].
This study on the genetic variations of C. megacephala using the mitochondrial COI + COII genes and the ISSR showed that the Penang and Selangor populations are similar in that they display M1 mutation, and these populations are different from those of Pahang, Johor Baru and Sabah. These results would provide a preliminary understanding and useful information for further investigation of the C. megacephala population structure and dispersal in Malaysia.
ACKNOWLEDGEMENTS
We thank Monash University and Universiti Malaysia Sabah for providing the research facilities for the work. We are also grateful to Institute of Medical Research for help in identifying the specimens
REFERENCES
- Guimarães, J.H., Prado, A.P. and Buralii, A.M. (1979) Dispersal and distribution of three newly introduced species of Chrysomya Robineau-Desvoidy in Brazil (Diptera, Calliphoridae). Revista Brasileira de Entomologia, 23, 245-255.
- Laurence, B.R. (1988) The tropical African latrine blowfly, Chrysomya putoria (Wiedemann). Medical and Veterinary Entomology, 2, 285-291. http://dx.doi.org/10.1111/j.1365-2915.1988.tb00197.x
- Sulaiman, S., Pawanchee, Z.A., Othman, H.F., Jamal, J., Wahab, A., Sohadi, A.R. and Pandak, A. (2000) Field evaluation of deltamethrin/S-bioallethrin/piperonyl butoxide and cyfluthrin against dengue vectors in Malaysia. Journal of Vector Ecology, 25, 94-97.
- Sukontason, K.L., Sukontason, K., Narongchai, P., Piangjai, S., Lertthamnongtham, S. and Olson, J.K. (2001) Chrysomya rufifacies as a forensic important fly species in Thailand: A case report. Journal of Vector Ecology, 26, 162-164.
- Sukontason, K.L., Narongchai, P., Sripakdee, D., Boonchu, N., Chaiwong, T., Ngern-Klun, R., Piangjai, S. and Sukontason, K. (2005) First report of human myiasis caused by Chrysomya megacephala and Chrysomya rufifacies (Diptera: Calliphoridae) in Thailand, and its implication in forensic entomology. Journal of Medical Entomology, 42, 702-704. http://dx.doi.org/10.1603/0022-2585(2005)042[0702:FROHMC]2.0.CO;2
- Kurahashi, H. (1982) Blow flies from Vanuatu NewHebrides with descriptions of 3 new species of the genus Onesia Diptera Calliphoridae. Pacific Insects, 24, 235- 249.
- Prins, A.J. (1979) Discovery of the oriental latrine fly Chrysomyia megacephala (Fabricius) along the southwestern coast of South Africa. Annals of the South African Museum, 78, 39-47.
- Guimarães, J.H., Prado, A.P. and Linhares, A.X. (1978) Three newly introduced blowfly species in Southern Brazil (Diptera: CaLIiphoridae). Revista Brasileira de Entomologia, 22, 53-60.
- Anderson, D.L., Sedgley, M., Short, J.R.T. and Allwood, A.J. (1982) Insect pollination of mango in northern Australia Mangifera indica, includes Apis mellifera. Australian Journal of Agricultural Research, 33, 541-548. http://dx.doi.org/10.1071/AR9820541
- Greenberg, B. (1973) Flies and disease, Volume 1, ecology, classification and biotic associations, Volume 2, Biology and disease transmission. Princeton University Press, Princeton.
- Bryd, J.H. and Castner, J.L. (2010) Forensic entomology: The utility of arthropods in legal investigations. 2nd Edition, CRC Press, Boca Raton.
- Reid, J.A. (1953) Notes on houseflies and blow flies in Malaya. Bulletin of Institute for Medical Research Malaya, 7, 1-26.
- Lee, H.L., Krishnasamy, M., Abdullah, A.G. and Jeffery, J. (2004) Review of forensically important entomological specimens in the period of 1972-2002. Tropical Biomedicine Supplement, 69-75.
- D’Almeida, J.M., José, R. and Salviano, B. (1996) Feeding preference of the larvae of Chrysomya megacephala (Fabricius) (Diptera: Calliphoridae) and Ravinia belforti (Prado e Fonseca) (Diptera: Sarcophagidae) concerning different diets. Memórias do Instituto Oswaldo Cruz, 91, 137-138. http://dx.doi.org/10.1590/S0074-02761996000100025
- Kurahashi, H., Benjaphong, N. and Omar, B. (1997) Blow flies (Insecta: Diptera: Calliphoridae) of Malaysia and Singapore. Raffles Bulletin of Zoology, School of Biological Sciences, University of Singapore, Singapore, 1-88.
- Sugiyama, E., Shinonaga, E. and Kano, R. (1990) Sarcophagine flies from Malaysia and Singapore with descriptions of six new species (Diptera, Sarcophagidae). Japanese Journal of Sanitary Zoology, 41, 81-91.
- Sperling, F.A.H., Anderson, G.S. and Hickey, D.A. (1994) A DNA-based approach to the identification of insect species used for post-mortem interval estimation, Journal of Forensic Sciences, 39, 418-427.
- Hall, T. (2007) Bioedit, Version 7.0.9. [Online]. Ibis Biosciences, Carlsbad, 1997-2007 http://www.mbio.ncsu.edu/BioEdit/bioedit.html
- Thompson, J.D., Higgins, D.G. and Gibson, T.J. (1994) CLUSTAL W: Improving the sensitivity of progressive multiple sequence alignment through sequence weighting, positions-specific gap penalties and weight matrix choice. Nucleic Acid Research, 22, 4673-4680. http://dx.doi.org/10.1093/nar/22.22.4673
- Tamura, K., Peterson, D., Peterson, N., Stecher, G., Nei, M. and Kumar, S. (2011) MEGA5: Molecular evolutionary genetics analysis using maximum likelihood, evolutionary distance, and maximum parsimony methods. Molecular Biology and Evolution, 28, 2731-2739. http://dx.doi.org/10.1093/molbev/msr121
- Nei, M. (1978) Estimation of average heterozygosity and genetic distance from a small number of individuals. Genetics, 89, 583-590.
- Yeh, F.C. (1998) POPGENE16. Version 1.31. Agriculture and Forestry Molecular Biology and Biotechnology Center, University of Alberta and Center for International Forestry Research, Canada. http://www.ualberta.ca/~fyeh
- Nei, M. (1973) Analysis of gene diversity in subdivided populations, Proceedings of the National Academy of Sciences, USA, 70, 3321-3323.
- Culley, T.M., Wallace, L.E., Gengler-Nowak, K.M. and Crawford, D.J. (2002) A comparison of two methods of calculating Gst, a genetic measure of population differentiation. American Journal of Botany, 89, 460-465. http://dx.doi.org/10.3732/ajb.89.3.460
- Ruiz-Garcia, M., Payan, C.E., Murillo, O.A. and Alvarez, D. (2006) DNA microsatellite characterization of the jaguar (Panthera onca) in Colombia. Genes and Genetics Systems, 81, 115-127. http://dx.doi.org/10.1266/ggs.81.115
- Excoffier, L., Smouse, P.E. and Quattro, J.M. (1992) Analysis of molecular variance inferred from metric distances among DNA haplotypes: Application to human mitochondrial DNA restriction data. Genetics, 131, 479- 491.
- Weir, B.S. and Cockerham, C.C. (1984) Estimating Fstatistics for the analysis of population structure. Evolution, 38, 1358-1370. http://dx.doi.org/10.2307/2408641
- Weir, B.S. (1990) Genetic data analysis: Methods for discrete population genetic data. Sinauer Associates, Inc., Sunderland.
- Bohonak, J.A. (2002) IBD (isolation by distance): A program for analyses of isolation by distance. Journal of Heredity, 93, 153-154. http://dx.doi.org/10.1093/jhered/93.2.153
- Avise, J.C. (2000) Phylogeography: The history and formation of species. Harvard University Press, Cambridge.
- Wohlford, D.L., Krafsur, E.S., Griffiths, N.T., Marquez, J.G. and Backer, M.D. (1999) Genetic differentiation of some Glossina morsitans populations. Medical and Veterinary Entomology, 13, 377-385. http://dx.doi.org/10.1046/j.1365-2915.1999.00185.x
- Scarpassa, V.M., Cardoza, T.B. and Cardoso, R.P. (2008) Population genetics and phylogeography of Aedes aegypti (Diptera: Culicidae) from Brazil. The American Journal of Tropical Medicine and Hygiene, 78, 895-903.
- Zietkiewicz, E., Rafalski, A. and Labuda, D. (1994) Genomic fingerprinting by simple sequence repeat (SSR)- anchored 2010 polymerase chain reaction amplification. Genomics, 20, 176-183. http://dx.doi.org/10.1006/geno.1994.1151
- Schug, M.D., Hutter, C.M., Wetterstrand, K.A., Gaudette, M.S., Mackay, T.F.C. and Aquadro, C.F. (1998) The mutation rates of di-, triand tetranucleotide repeats in Drosophila melanogaster. Molecular Biology and Evolution, 15, 1751-1760. http://dx.doi.org/10.1093/oxfordjournals.molbev.a025901
- Torres, T.T. and Azeredo-Espin, A.M.L. (2008) Characterization of polymorphic microsatellite markers for the blowfly Chrysomya albiceps (Diptera: Calliphoridae), Molecular Ecology Resources, 8, 208-210. http://dx.doi.org/10.1111/j.1471-8286.2007.01926.x
- Rodríguez-Sánchez, F., Guzmán, B., Valido, A., Vargas, P. and Arroyo, J. (2009) Late Neogene history of the laurel tree (Laurus L. Lauraceae) based on phylogeographical analyses of Mediterranean and Macaronesian populations. Journal of Biogeography, 36, 1270-1281. http://dx.doi.org/10.1111/j.1365-2699.2009.02091.x
- Feitosa, M.A.C., Juliao, G.R., Costa, M.D.P., Belem, B. and Pessoa, F.A.C. (2012) Diversity of sand flies in domiciliary environment of Santarém, state of Pará, Brazil: Species composition and abundance patterns in rural and urban areas. Acta Amazonica, 42, 507-514. http://dx.doi.org/10.1590/S0044-59672012000400008
- Chaves, L.F., Hamer, G.L., Walker, E.D., Brown, W.M., Ruiz, M.O. and Kitron, U.D. (2011) Climatic variability and landscape heterogeneity impact urban mosquito diversity and vector abundance and infection. Ecosphere, 2, art70. http://dx.doi.org/10.1890/ES11-00088.1
- Vandergast, A.G., Bohonak, A.J., Weissman, D.B. and Fisher, R.N. (2007) Understanding the genetic effects of recent habitat fragmentation in the context of evolutionary history: Phylogeography and landscape genetics of a southern California endemic Jerusalem cricket (Orthoptera: Stenopelmatidae: Stenopelmatus). Molecular Ecology, 16, 997-992.
- Strong, K.L. and Mahon, R.J. (1991) Genetic variation in the old world screw-worm fly, Chrysomyia bezziana (Diptera: Calliphoridae). Bulletin of Entomological Research, 81, 491-496. http://dx.doi.org/10.1017/S0007485300032053
- Hamrick, J.L. and Godt, M.J. (1989) Allozyme diversity in plant species. In: Brown, A.H.D., Clegg, M.T., Kahler, A.L. and Weir, B.S., Eds., Plant Population Genetics, Breeding and Germplasm Resources, Sinauer, Sunderland, 43-63.
- Shi, W., Kerdelhué, C. and Ye, H. (2010) Population genetic structure of the oriental fruit fly Bactrocera dorsalis (Hendel) (Diptera: Tephritidae) from Yunnan province (China) and nearby sites across the border. Genetica, 138, 377-385. http://dx.doi.org/10.1007/s10709-009-9429-0