Open Journal of Statistics
Vol.1 No.2(2011), Article ID:6348,5 pages DOI:10.4236/ojs.2011.12013
Empirical Analysis of Impact of Conversion of Convertible Bonds on Corporate Performance of Different Industries in China
1Department of Economics and Management, Northeast Forestry University, Harbin, China
2Department of Mathematics and Statistics, University of Calgary, Calgary, Canada
E-mail: dhua@nefu.edu.cn, lux@ math.ucalgary.ca
Received May 18, 2011; revised June 7, 2011; accepted June 13, 2011
Keywords: Behavior of Converting, Convertible Bonds, Corporate Performance, PCA, WSRT
Abstract
We apply the methods of principle component analysis (PCA) and Wilcoxon’s signed rank test (WSRT) to study influence of conversion of convertible bonds on corporate performance of different industries in China. In this paper, 33 convertible bonds that were issued by non-financial sectors from 2002 to 2009 in China with the convertible rate more than 50% within a year were selected as a research sample. In order to provide a reference for the parties concerned, the influence of conversion of convertible bonds on corporate performance in different industries was studied from the industrial properties point of review.
1. Introduction
Convertible bonds began to appear after the establishment of the stock market and started relatively late in China. With the gradual improvement of institutional securities, convertible bond has become one of the most important financing tools for listed companies due to its unique financial properties [1]. In recent years, scholars in finance area have been mainly studying on the changes of corporate performance through issuing convertible bonds. However, few research has been done on the influence of conversion of convertible bonds on corporate performance [2]. In this paper, the influence of conversion of convertible bonds on corporate performance in different industries was studied from the industrial properties point of view.
2. Design of the Study
2.1. Data Sources and Sample Selection
Information of issuing bond and conversion of convertible bond derive mainly from the bond network, relevant index data come from Sohu Securities Network – an annual report of listed companies disclosed publicly. Specifically, from January 1, 2002 to December 31, 2009, a total of 60 listed companies in Shenzhen and Shanghai Stock Exchange issued 61 convertible bonds (Vanke bond was issued twice), which were mainly distributed in the steel, power, metal, transportation and silk industries. Selection of this sample is based on the following criteria [3]:
1) Exclude the listed companies distributed in the financial sector due to the comparability of financial indicators;
2) Choose the listed companies whose conversion rate is more than 50% within one-year period, taking into account the fact that the greater conversion ratio, the greater impact on performance of the company;
3) Listed companies issuing convertible bonds do not withdraw from the market;
4) Listed companies are classified according to the classification of three types of industries: primary, second and tertiary.
There are 33 convertible bonds meeting the above four criteria, none of these companies belongs to the primary industry. A total of 21 companies have the nature of the secondary industry mainly including steel, power, energy and chemical industry and a total of 12 companies belong to the tertiary industry including real estate, pharmaceutical, food and environmental protection, etc.
2.2. Choice of Corporate Performance Indicators
According to the “Performance Evaluation of StateOwned Capital Rules for the Operation” and the DuPont Analysis System, the following six variables are selected as major financial performance indicators to reflect the financial performance of listed companies in profitability, solvency, financial security, growth and competitiveness[4]. These variables are: ROTA(return on total assets), ROE(return on equity), EPS(earnings per share), OCFPS(operating cash flow per share), NPGR(net profit growth ratio) and RGR(revenue growth ratio). Table 1 shows the detailed information of these variables.
2.3 Research Methods
The empirical research methods adopted in the paper are the methods of PCA (Principal Component Analysis) and WSRT (Wilcoxon’s Signed Rank Test).
PCA is a method which can combine many various indicators into a few important composite indicators by reducing dimensionality. In order to provide a comprehensive and systematic view for the performance of a company, several representatives of corporate performance indicators are selected. But too many variables cause computation burden and increase complexity of analysis, so only principal components from multiple indicators of performance are selected to calculate integrated values [5]. Corporate performance can be examined by comparing integrated values of the year before conversion, the current year of the conversion and the following year after the conversion.
In reality, there are often indicators of different scales, for example, return on total assets and earnings per share. So all indicators of the same raw data must first be standardized to calculate the impact of the unit. Suppose that X1, X2, ··· , Xp are the values of p standardized variables, then there are p principle components given by
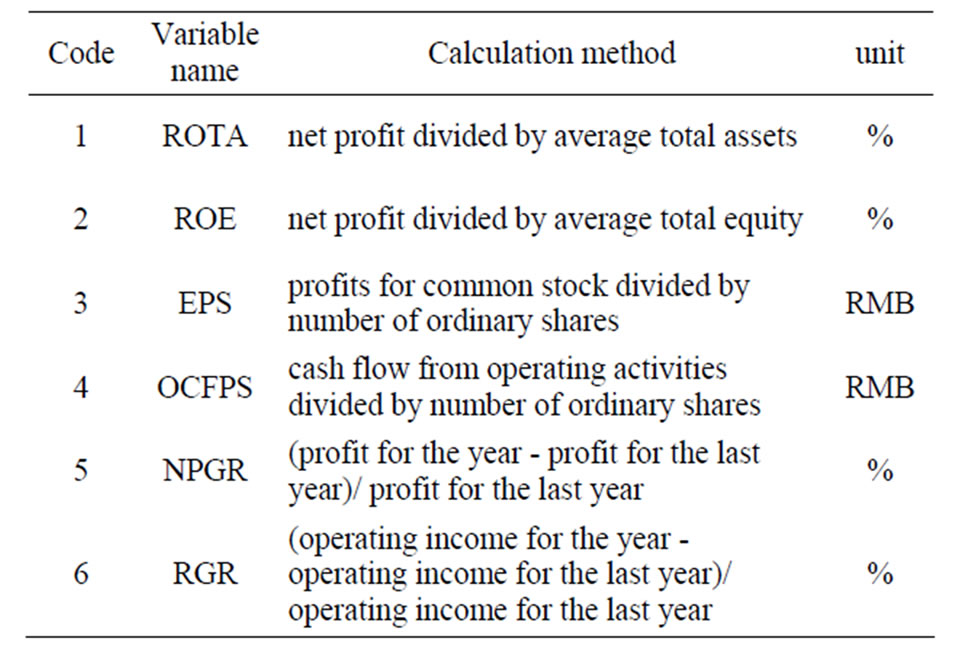
Table 1. Corporation performance indicators.
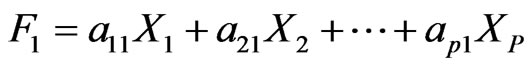 (1)
(1)
 (2)
(2)

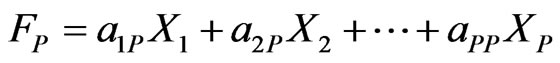 (P)
(P)
where ai =(a1i, a2i,···,api)’ (i = 1,···,p) are the coefficients of Xi’s, they are the eigenvectors corresponding the eigenvalues of the covariance matrix of Xi’s, λ1 > λ 2>···> λP. In this article, six financial performance indicators or variables are selected, i.e., p = 6, X1 represents the total return on assets, X2 represents return on net assets, X3 represents earnings per share, X4 represents operating cash flow per share, X5 represents net profit growth ratio, X6 represents revenue growth ratio, see Table 1 for details.
WSRT was proposed in 1945 by Wilcoxon [6]. This method can compare two distributions in matched pairs studies. The test is based on the sum of the ranks of the positive or negative difference, where ranks are calculated for the absolute values of the differences. Specific steps are: 1) calculate the difference between two sets of paired data; 2) rank the absolute value of the difference; 3) find evidence of difference between the two samples by comparing the sum of the positive ranks with the sum of the negative ranks.
3. Empirical Analysis and Test
3.1 Principle Component Analysis
First, we conduct PCA to calculate the principle components of the six performance variables for the companies belonging to the second industry and tertiary industry in three years: the current year, the last year before conversion and the following year after conversion. Table 2 shows the eigenvalues and percentages of variance explained by the six principle components. We see that there are two eigenvalues greater than 1 for
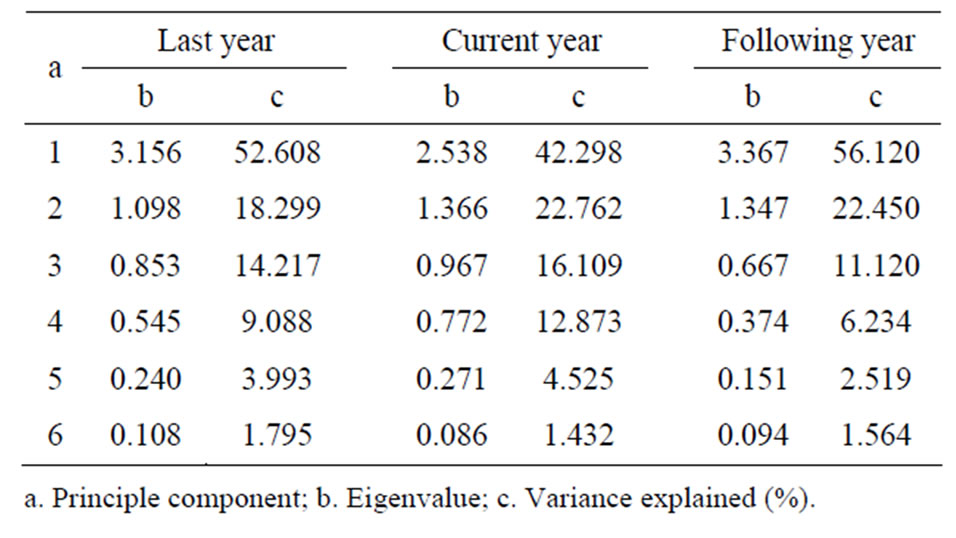
Table 2. The eigenvalues and percentages of variance explained by the principle component for the performance data of 33 convertible bonds in three years.
each year’s data, we may use the first two principle components to compare the performance of these companies among three different years. To use WSRT, we can use only one component each time. For simplicity, we choose the first principle component for comparison.
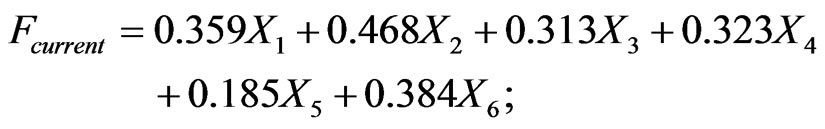
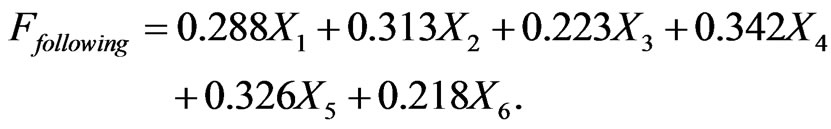
The integrated value of corporate performance is defined to be the first principle component, it is calculated by the following models for the three different years:
for the last year before conversion,
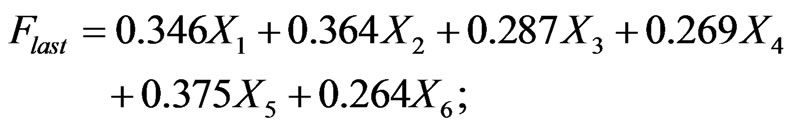
for the current year of conversion,
for the following year after conversion,
We put the values of the standardized variables into the above models of principal components to calculate synthetic value of corporate performance for the secondary industrial companies (as in Table 3) and the tertiary industrial companies (as in Table 4) covering three years.
3.2. Wilcoxon’s Signed Rank Test
After we obtain the integrated values of incorporate performance, we use them to compare performance of the secondary and tertiary industrial companies, respectively among three years. The results are presented in Tables 5 and 6 for the secondary and tertiary industrial companies, respectively.
From Table 5, we conclude that, at 0.05 level, there is no significant change in the secondary industrial companies’ performance through bond converting between the current year and the last year before conversion (Pvalue = 0.741). However, there is a significant change between the following year after conversion and the current year (P-value = 0.049), as well as between the following year after conversion and the last year (P-value = 0.039).
From Table 6, the P-values for the three comparisons are 0.308, 0.814 and 0.583, respectively. Therefore, there is not enough evidence to support any difference among three years in the tertiary industrial companies’ performance.
4. Conclusions
By using PCA and WSRT, we have compared the fina-
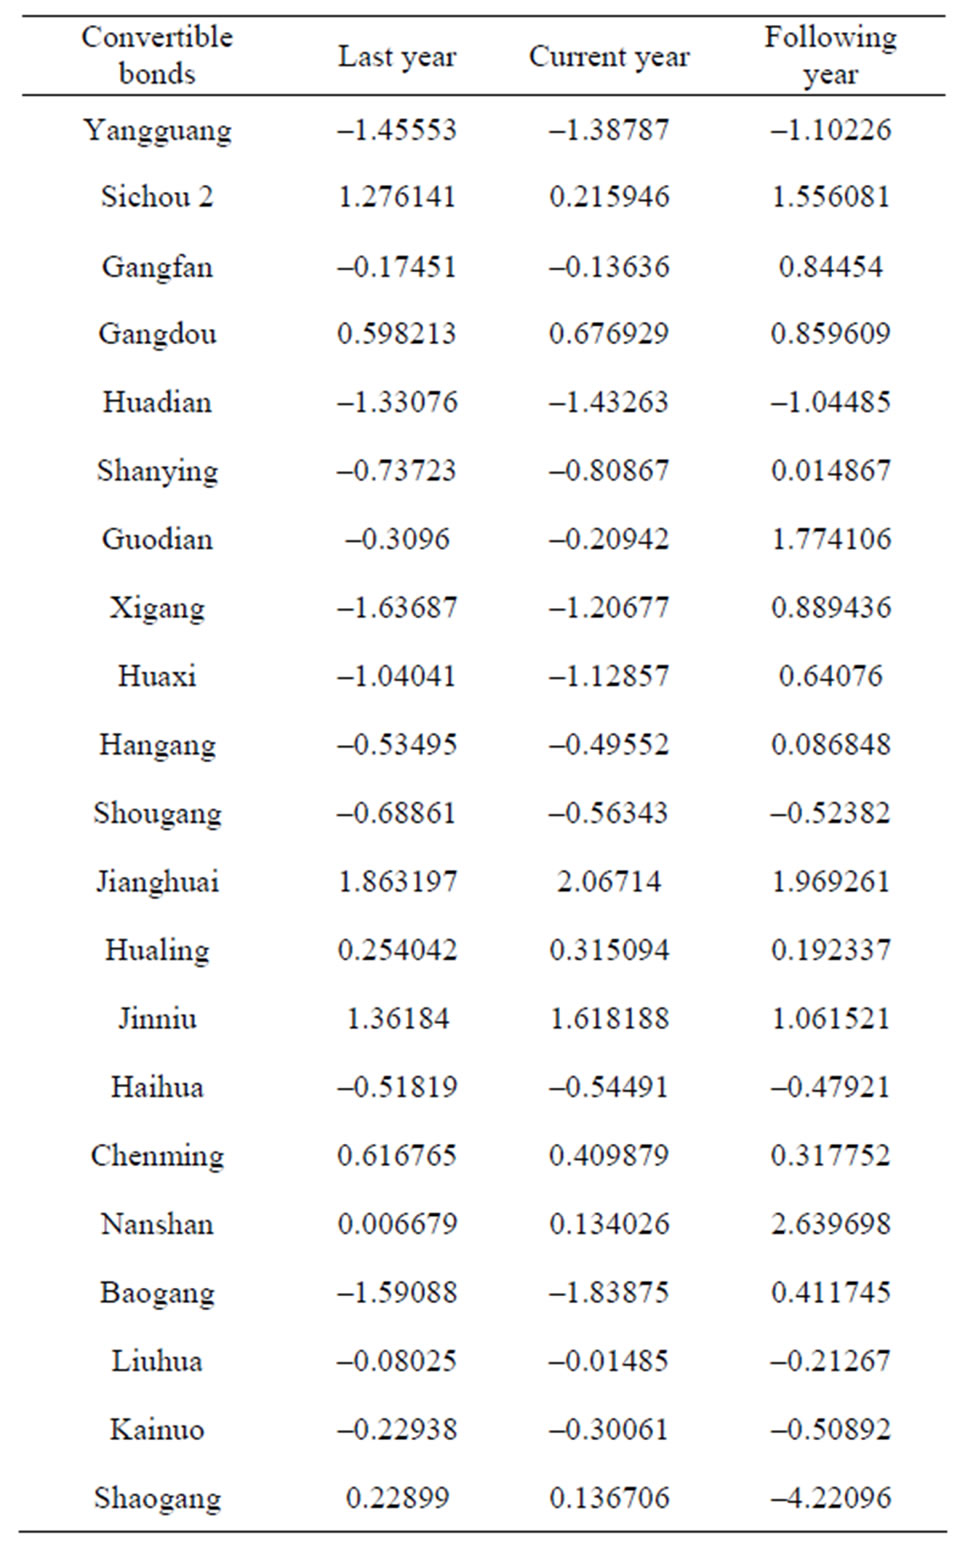
Table 3. Integrated value of corporate performance for the 21 secondary industrial companies.
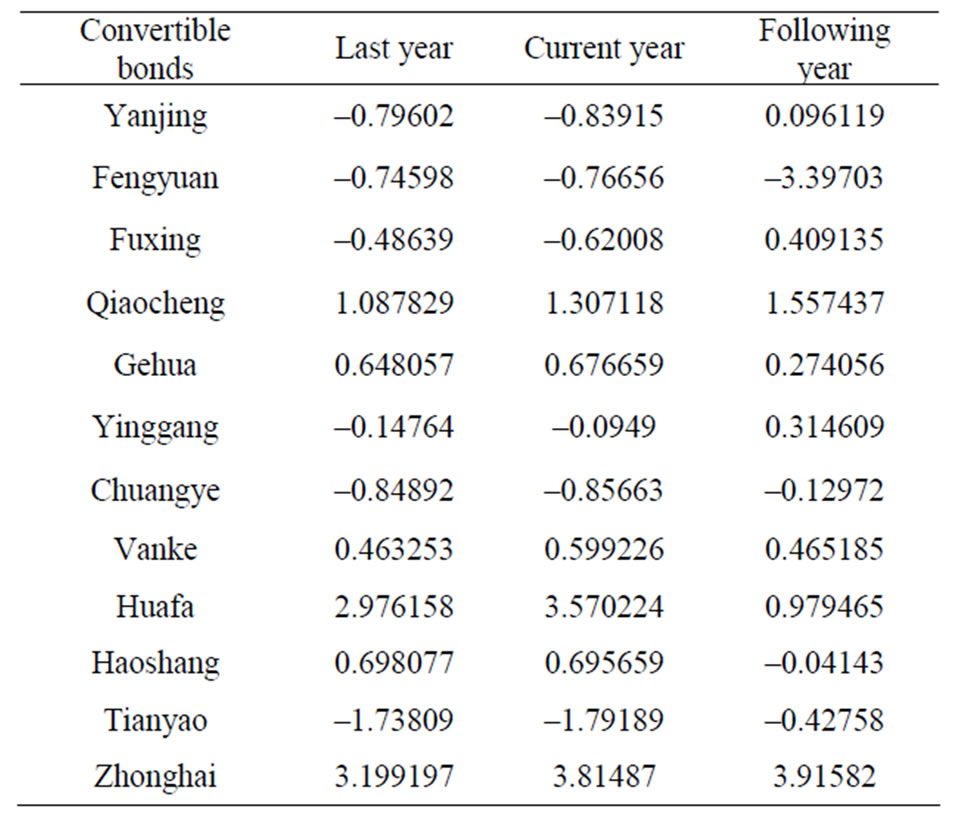
Table 4. Integrated value of corporate performance for the 12 tertiary industrial companies.
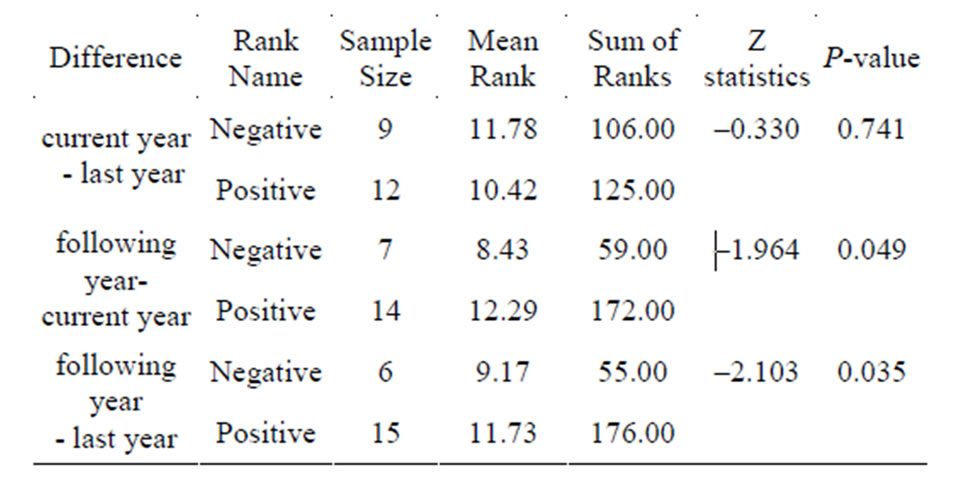
Table 5. Ranks and Wilcoxon’s signed rank test for the secondary industrial companies.
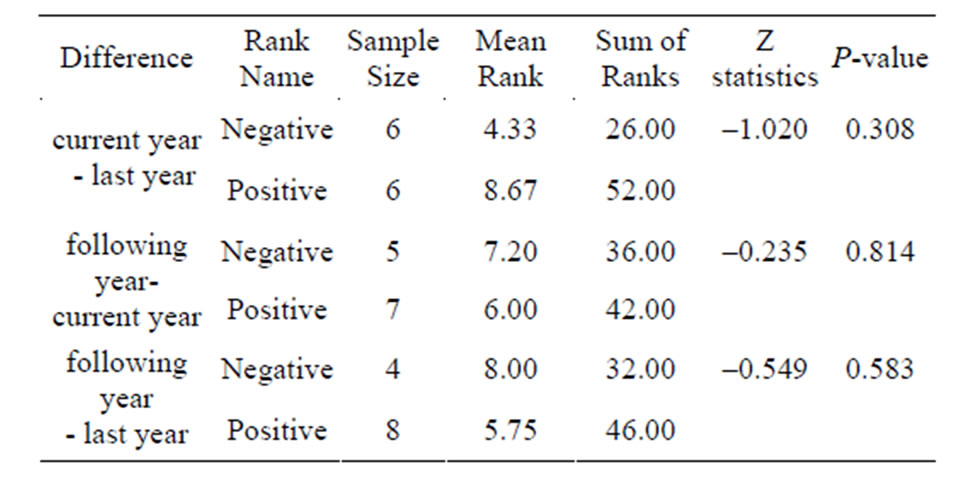
Table 6. Ranks and Wilcoxon’s signed rank test for the tertiary industrial companies.
ncial performance of the secondary industry (mainly including iron and steel, power, etc.) with that of tertiary industry (mainly including the pharmaceutical, food, etc.) covering three years, we find that the secondary industrial companies had greatly improved their financial performance through the conversion, while the tertiary industrial companies had no significant improvement in corporate performance. The possible causes are: 1) the nature of property ownership has taken an important role. Behavior of conversion has changed claim-liability relationship into investment relationship, which is a fundamental change in the role of stakeholders, that is, the interests between the main bodies of property rights had been re-contributed. Therefore, different levels of industrial property ownership and the status of property rights reforming decided the outcome of conversion. From the current view of reality of China, the secondary industry, as the focus of State-Owned Enterprise reform, compared with the tertiary industry, has a better reforming of property ownership and more efficient coordination of stakeholders, Therefore, to some extent, the secondary industries have higher yields after conversion. 2) The nature and scale of company also contribute to the variances. In general, company scale of steel and electric power industry is relatively large, the size of the issued of convertible bonds is correspondingly large compared with the tertiary industry. In accordance to the conditions of the issuing of convertible bonds, each issue amount should not be less than 100 million RMB, and assetliability ratio should be no more than 70% after the issue. The secondary industrial companies release a huge amount of convertible bonds and their financial burden is relatively heavy due to interest charge. But because of the conversion, they have no need to pay interest costs, which directly increases companies’ profits. 3) Elasticity coefficient of the profitability and debt-scale is also a relevant factor. When EBIT (earnings before interest and tax) rate is above the bond interest rate, the greater the amount of bonds, the greater the profits to the shareholders, that is, the interest expense of bonds is fixed after its being issued, but the profit from the equity converted from bonds is unknown. If EBIT is more than its interest expense, the surplus of course adds the profit of stockholders. In this case, debt results in a greater financial leverage. Because the secondary industrial companies have a large-scale debt as a whole and their total debt-income ratio is relatively large, the secondary industrial companies could lead to higher debt-income level.
In our research, we have used 21 companies in the secondary industrial area, while 12 in the tertiary industrial area. They included all companies from 2002 to 2009 in the Chinese stock market, which issued convertible bonds and their creditors changed claim-liability relationship into investment relationship through the behavior of conversion. Although the sample sizes are moderate or small, since we have used the Wilcoxon’s signed rank test, the method is nonparametric and quite robust, we believe that the above conclusion should reflect the real influence of conversion of convertible bonds on corporate performance in different industries in China.
5. Acknowledgements
Hua Ding’s work was supported by China Scholarship Council. Xuwen Lu’s work was supported in part by a grant from the Natural Sciences and Engineering Research Council of Canada.
6. References
[1] H. Ding and J. Han, “Study on the Impact of Conversion of Bonds Convertible on Corporate Performance,” Accounting Monthly, Vol. 9, 2010, pp. 23-26.
[2] J. Wang, “Research on Convertible Behavior of Convertible Company Bonds,” Chinese Science and Technology Information, Vol. 3, 2005, pp. 19-22.
[3] Q. P. Hu, “Convertible Bonds - Convertible Effect and Price,” Shihezi University Journals, Vol. 3, 2007, pp. 21-25.
[4] X. F. Zhang and C. J. Liu, “Empirical Studies on the Company Performance Change Trend after Convertible Bonds Issued,” Shanghai Financial, Vol. 3, 2006, pp. 7-10.
[5] W. L. Zhang, “Principal Component Analysis Is Applied Using SPSS Software,” Market Research, Vol. 3, 2005, pp. 31-34.
[6] W. Frank. “Individual Comparisons by Ranking Methods,” Biometrics Bulletin, Vol. 1, No. 6, 1945, pp. 80-83. doi:10.2307/3001968