Open Journal of Geology
Vol.3 No.3(2013), Article ID:34335,7 pages DOI:10.4236/ojg.2013.33027
A Study of the Relationship between Landslide and Active Tectonic Zones: A Case Study in Karaj Watershed Management
1Department of Geology, Science and Research Branch, Islamic Azad University, Tehran, Iran
2Department of Geology, North Tehran Branch, Islamic Azad University, Tehran, Iran
Email: *r.sharifi1346@semnaniau.ac.ir
Copyright © 2013 Rahman Sharifi et al. This is an open access article distributed under the Creative Commons Attribution License, which permits unrestricted use, distribution, and reproduction in any medium, provided the original work is properly cited.
Received February 25, 2013; revised March 28, 2013; accepted April 26, 2013
Keywords: Nilsen Method; Slide Zones; Active Tectonic; Landslide; Active Tectonic Hazard Zonation Map
ABSTRACT
This research shows a noticeable comparison between slide zones produced with the results using the Nilsen method with active tectonic hazard zonation map. A determination landform of geometry or morphometry factors is one of the best methods for study and evaluation active tectonics. The first image provided is a Dem maps from GIS software showing topography, geology and tectonic maps participant with field activities. The second image provided shows an active tectonic map also generated by the same above mentioned factors into three classes A, B, C, D and a landslide hazard zonation map which shows five classes: Stable zone, generally stable zone, stable moderately stable zone, moderately stable zone and talented to liquefaction zone. The study and comparison and conformity landslide hazard zonation map with hazard zonations into active tectonic hazard zonation map showed about 79 percent (56,880 hectare) moderately unstable zone and talented for liquefaction zone settled in A zone (very high tectonic activity) and B zone (high tectonic activity) active tectonic map and 21 percent (15,130 hectare) remain unsettled sequential 12 percent (8640 hectare) and 9 percent (6480 hectare) in C (moderate tectonic activity), D (lowest tectonic activity) zone of active tectonic hazard zonation produced from above mentioned factors. This research showed a relationship between slide zones produced in landslide hazard zonations using the Nilsen method to measure active tectonic hazard zonation in the study region.
1. Introduction
The slopes, instability and their movement are posed to different names such as the massive movement, slope of movement, dip movement, landslide and etc. [1]. However, among these names, the landslide is more common technical and professional that in the present study, instead of all above-mentioned names, mostly the landslide term has been used. Landslide phenomenon depends on several factors such as dip, geology, rain, vegetation, earthquake etc. [2]. Moreover, it is as slide (transitional and rotational), flowing (debris flow, soil flow, mud flow, soil and mud flow etc.), rock fall types, which are more frequent in the flowing type area and rock falls in a landslide is higher than the other types.
Here we consider the landslide phenomenon as a highly significant point in the form of erosion in watershed management projects. Slide zones under title erosion types are related to more active tectonic factors. For example drainage basin shape [3], mountain front sinuosity (Smf), the ratio of valley-floor width to valley height (Vf), stream length-gradient [4], hypsometric integral (Hi) and drainage basin asymmetry (Af).
This phenomenon of unexpected disasters is a considerably expensive one when measured by annual human financial and natural resource losses and damages in Iran and all over the world [5]. Therefore, the study of landslide subject is important. Although, in order to achieve reduced damage and losses, requires proper landslide general planning and applying the lessons learned from the past by studying existing data for landslide management is crucial; but we can also suggest that one of the most important actions in this regard is identifying the areas with the potential of landslide risk, preparing zonation maps and planning for the appropriate operation in such future areas as well [6]. Preparation of landslide hazard zonation maps has been on for four decades by different researchers in different parts of the worlds. Since numerous factors are involved in the occurrence of landslide, the zonation methods for identifying the hazards of landslide have not been standardized yet [7]; especially, considering the fact that climate and different geological formations can have several impacts and zonation with these factors demands a particular characteristic and style in each different geological area. In general, tectonically and in a wide scale, the region has located in the Alborz zone [8], and definitely has been influenced by the events and processes of the given zone that the presence of crushed rocks in many sites and disturbance of the units and sedimentary formations and different faults with various mechanisms and dominant general strike of northwest-south and east to west is also indicated by the subject. On the other hand, the study and comparison and relationship of landslide zones with those of tectonic active zones resulting from active tectonic factors (active tectonic hazard zonation map) is posed. In this respect, it remains to add that Iran is located at the middle part of Alps-Himalayas belt in terms of structural state, and its current shape is the result of orogenic activity, especially final Alp orogenic [9]. The structural geology condition and instability of Iran lands due to being located in an active tectonic area, is not quiet in terms of seismicity. In terms of seismotectonic and its mechanism, it is also dependent on the general seismotectonic of the mentioned zone [this zone comprises about 10.43 percents of the earthquakes in Iran] and has abundant earthquakes but mainly with magnitude 4 to 5.5 at Richter scale and with low focal depth (earthquakes with focal depth lower than 50 km) [10]. As a result, the issue of active tectonics is notable in the region and most indices of active tectonics such as drainage basin shape [3], mountain front sinuosity (Smf), ratio of valley-floor width to valley height (Vf), stream length-gradient [4], hypsometric integral (Hi) and drainage basin asymmetry (Af) are presented in study region.
2. Geography Location of Study Area
Watershed management of Karaj has located in north of Tehran city and about Karaj-Chalus road in regions of Amirkabir dam to Ahowan apex, it has 50˚57'46'' - 51˚ 29'54'' longitude and 35˚44'58'' - 36˚8'22'' altitude and area about 125,000 hectare (Figure 1). Watershed management of Karaj separate by Shemiranat Mountains from Jajrood River in east and by Kaharbozorg Mountain from Taleghan River in west and by Alborz Mountains from Chalus River in north.
3. Geomorphology and Geological of Region
The study area is the north part of Tehran city and in the
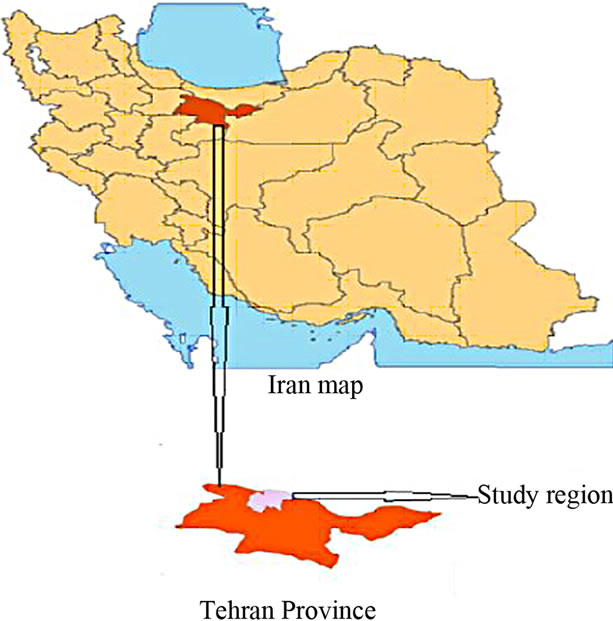
Figure 1. Location map of study area.
part of middle Alborz Mountains. It is separate by Shemiranat Mountains from Jajrood River in east and by Kaharbozorg Mountain from Taleghan River in the west and by the Alborz Mountains from Chalus River in north. Lithological area has different groups of sedimentary rocks; igneous rocks metamorphic and structural tectonic zone of Alborz fold. This area is located in Alborz folding zone and contains different folds and faults with a general strike of the NW-SE and E-W in the parts south and north of the study area passes over great faults such as Abiek fault-Firoozkooh-Shahrood and Tehran north fault with general way E-W. From geology view based on geology maps of Tehran, Karaj, Marzanabad, Ghazvin, Saveh, Amol. Aerial photos as well as field activities show different information and units from Precambrian to quaternary with different lithology such as sedimenttary, igneous and metamorphic but mostly sedimentary in region.
4. Material and Methods
For comparison between slide zones produced by Nilsen method with active tectonic hazard zonation map, The first provided maps dem and projection of geology map (Figure 2), surface distribution landslide (Figure 3) by geology maps of Tehran, Karaj, Ghazvin,Saveh, Marzanabad, Amol and aerial photos and topography maps as well as geology and geography surveys and field activeties in the soft ware GIS with 9.3 version. Then slope map into three class map of slide and unslide units or deposit provided with comparison surface distribution landslide map and geology map. Landslide hazard zonation map with Nilsen method (Nilsen method is for pro-
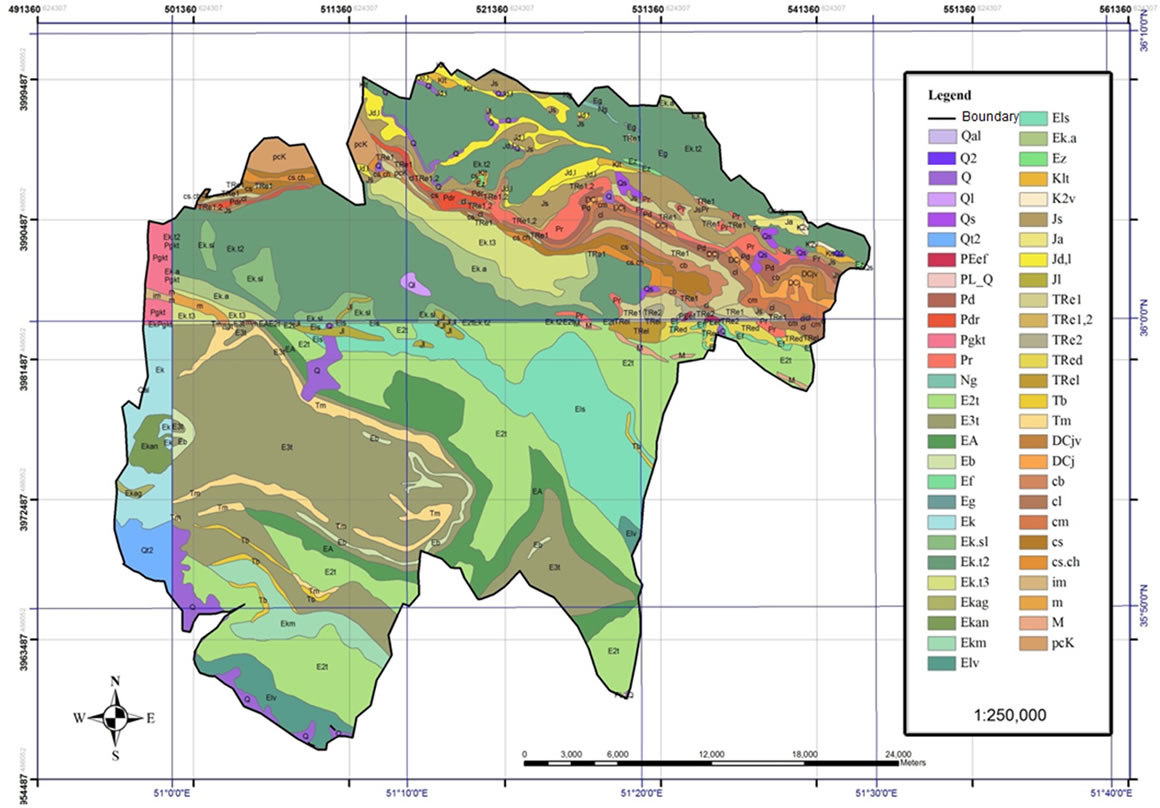
Figure 2. Geology map of study area.
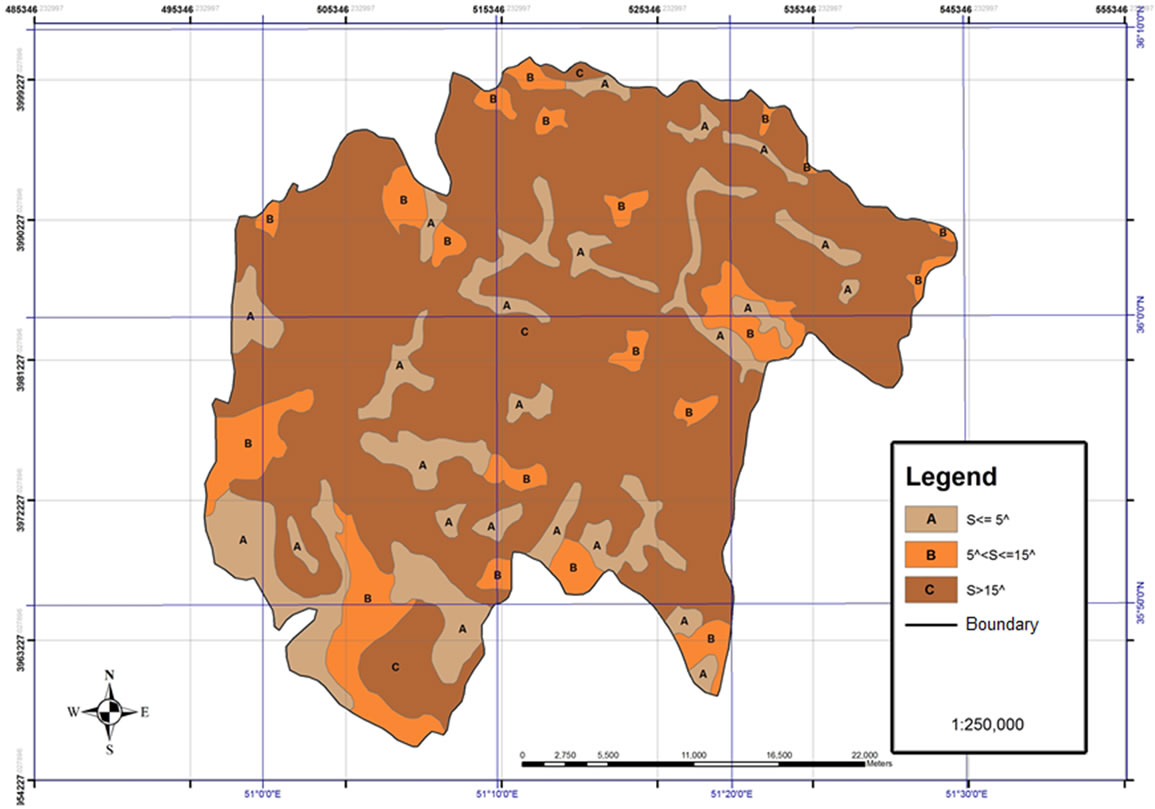
Figure 3. Slope into class three.
vide landslide hazard zonation map in the framework Table 1), tectonic hazard zonation map with affective factors and maps area all above-mentioned provided by dem of maps See below explanation.
5. Slope Map
For preparation landslide map by Nilsen, slope map into class three percent 5, percent 5 to 15 and more percent 15 is necessary that provided from demand map topography in the GIS softeware (Figure 3).
6. Geology Map
Study region Geology map by geology maps of Tehran, Karaj, Marzanabad, Ghazvin, Saveh, Amol, and aerial photos as well as field activities. It has 54 numbers of geology formation and unit from Precambrian to quaternary with different lithology sedimentary, igneous and metamorphic (Figure 2).
7. Surface Distribution Landslide Map
Surface distribution landslide map by study region geology maps and aerial photos as well as field activities provided into groups four active landslides, ancient landslides, debris flows and rock falls (Figure 4).
8. Slide and Unslide Deposit Map
Slide and non slide deposits or units map provided from comparison geology map and surface distribution landslide map, two above-mentioned map, slide deposits or units are geology formations and units that have very landslide area but deposits or units non slide are geology formations and units that have a little or less landslide area and upshot of talented liquefaction units are near rivers (Figure 5).
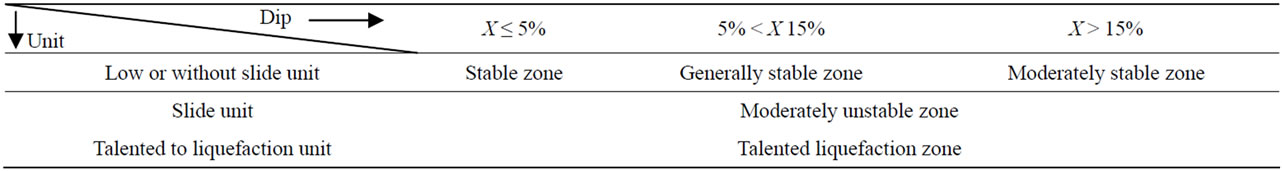
Table 1. Overlying dip and slide units in the Nilsen method.
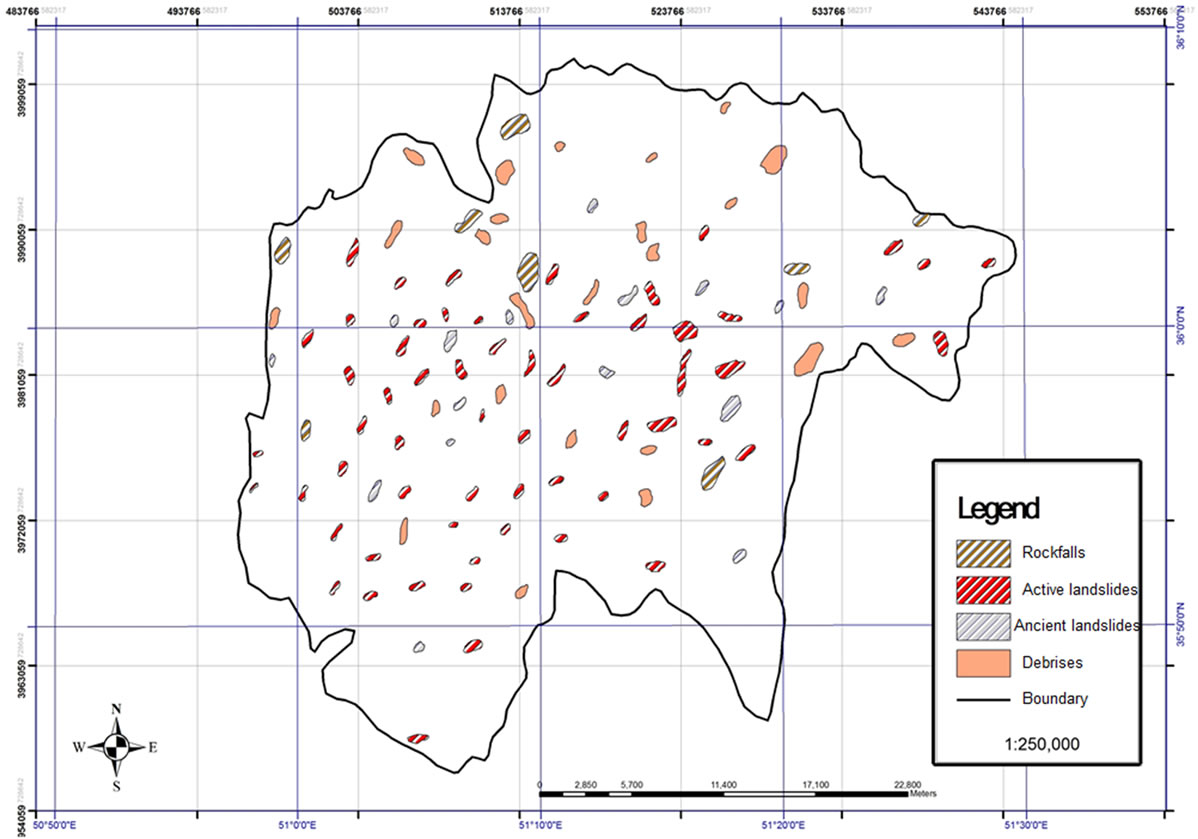
Figure 4. Surface distribution landslide map of study region.
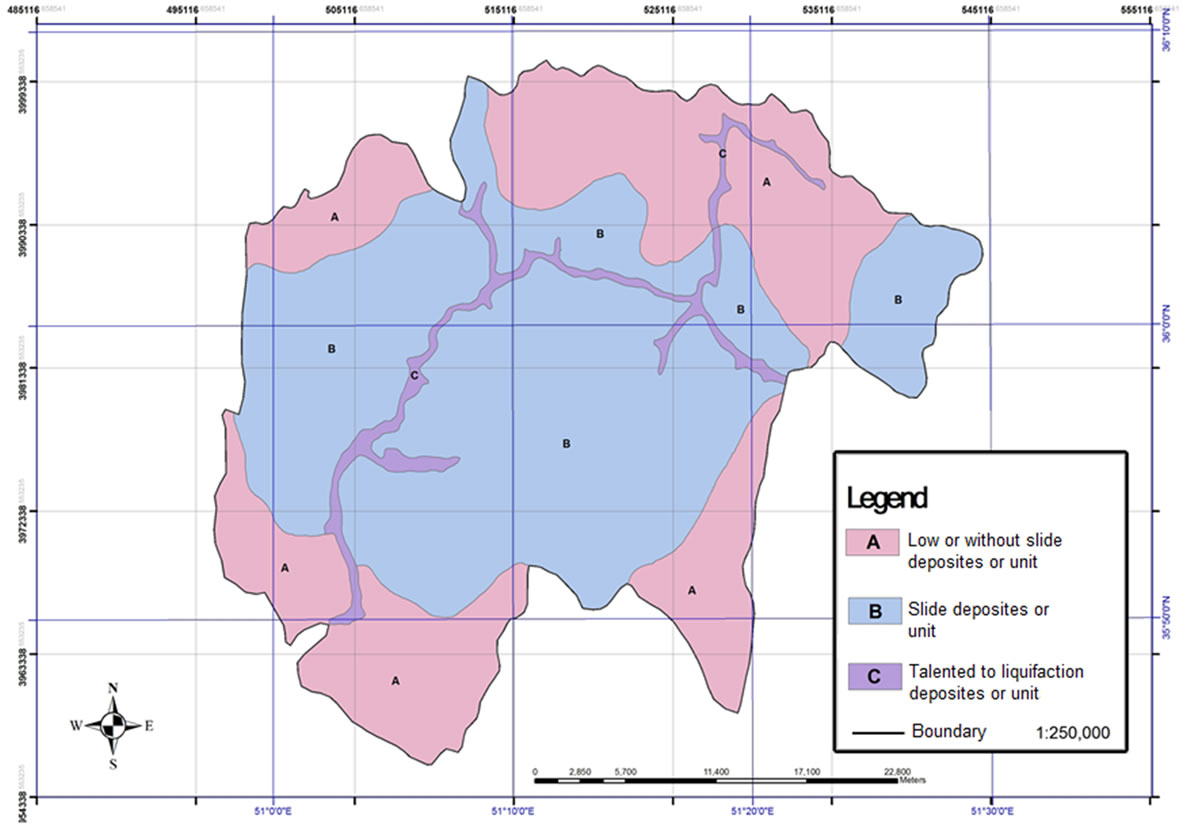
Figure 5. Slide and non slide units or deposit.
9. Landslide Hazard Zonation Map
In general the study of landslide subject is of special importance. Although, in order to achieve the reduced damages and losses caused by landslide, general planning and applying the landslide management is crucial, but one can say that one of the most important actions in this regard is identifying the areas with the potential of landslide risk, preparing zonation maps and planning for the appropriate operation in such areas [6]. Due to landslide hazard zonation map by Nilsen method is acceptable accuracy in region, based on number 1 table provided landslide hazard zonation map into five class stable zone, generally stable zone, moderately stable zone, moderately unstable zone, talented liquefaction zone (Figure 6).
10. Active Tectonic Zonation Map
In terms structural geology zones, there have been too many tectonic disasters in variate geology areas and in terms active tectonic indexes such as drainage basin shape [3], mountain front sinuosity (Smf), ratio of valley-floor width to valley height(Vf), stream length-gradient [4], hypsometric integral (Hi) and drainage basin asymmetry (Af) is active and variation. Because one of the best methods to study and evaluate of active tectonic is, to determine the land form of geometry or morphemetry factors. The active tectonic hazard zonation map (Figure 7) provided into four classes with very high tectonic activity (A), high tectonic activity (B), moderate tectonic activity (C) and lowest tectonic activity zone (D) the base of above mentioned factors.
11. Discussion and Conclusions
As mentioned, landslide phenomenon depends on the various factors of active tectonic indices. In this research work, landslide phenomenon has been compared in the framework of landslide hazard zonation to method Nilsen method which is acceptable and with high accuracy in the region. Overlying and comparison landslide hazard zonation map (Figure 6) with active tectonic hazard zonation map (Figure 7) showing that:
A. About percent 79 (56,880 hectare) moderately unstable zone and talented for liquefaction zone settled in A zone (very high tectonic activity) and B zone (high tectonic activity) active tectonic map.
B. About percent 21 (15,130 hectare) remain settled sequential 12 percent (8640 hectare) and 9 percent (6480 hectare) in C (moderate tectonic activity), D (lowest tectonic activity) zone of active tectonic hazard zonation map.
C. In other word this research showing relationship
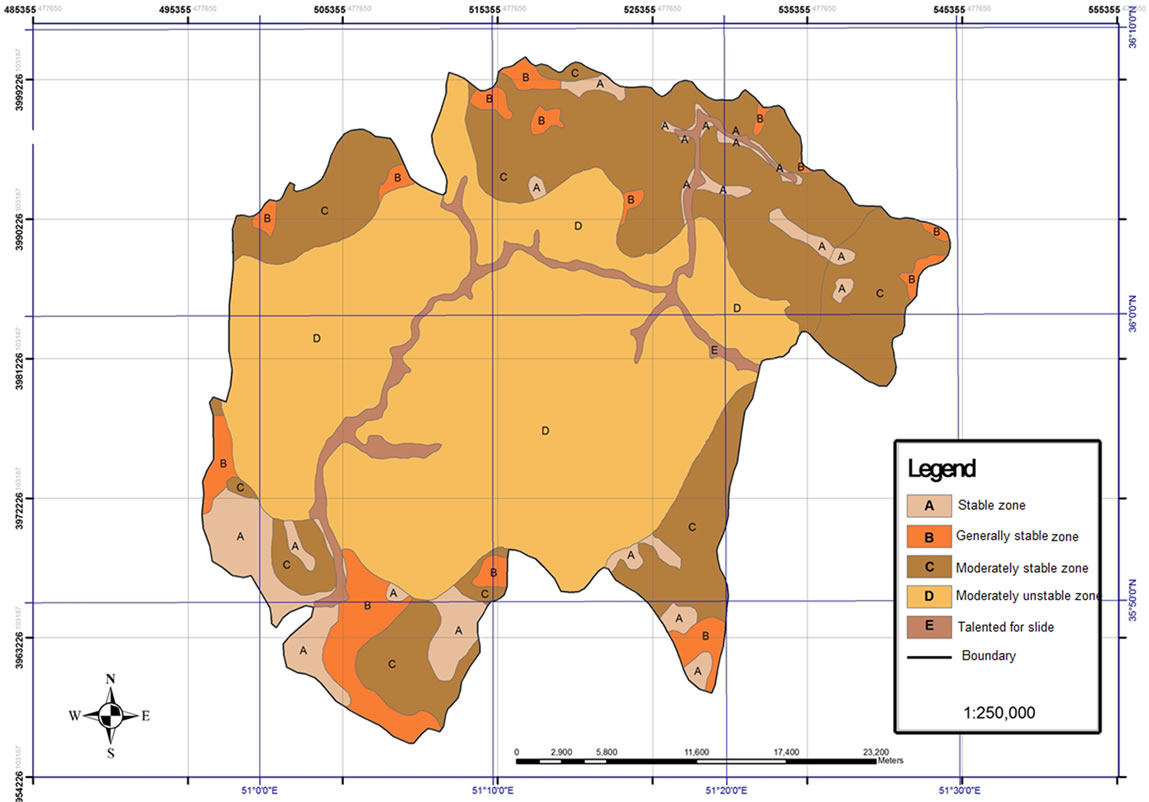
Figure 6. Landslide hazard zonation map by Nilsen method.
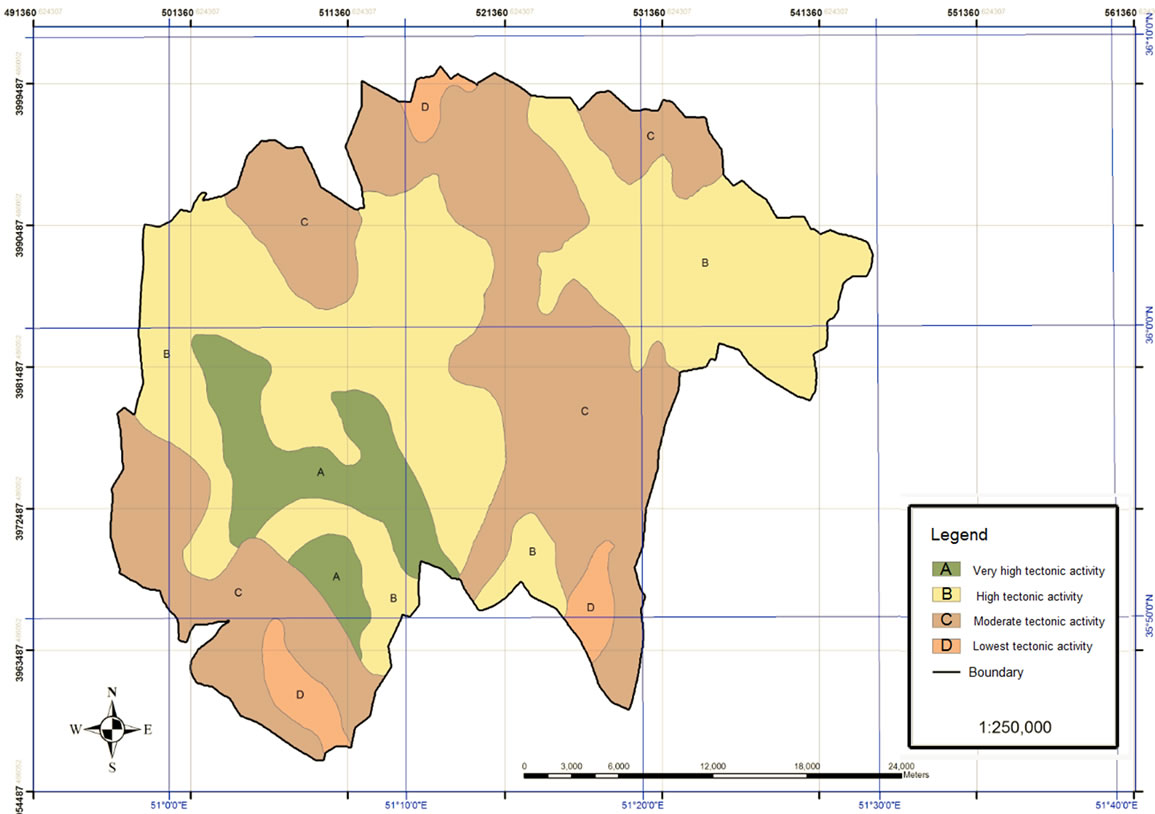
Figure 7. Active tectonic hazard zonation map.
landslide zones produce landslide hazard zonation using the Nilsen method to show active tectonic hazard zonation maps in the study region.
D. The summary of conclusion showing that:
D.1 More determinations indices of active tectonics showing highly active tectonic activity in the region.
D.2 Overlying and comparison landslide hazard zonation map using the Nilsen method to show active tectonic hazard zonation maps which also show that slide zones have highly significant relationship with active tectonic zones.
D.3 Active landslides in the region have more space in moderately unstable zones, showing that the Nilsen method accuracy in the region.
D.4 Landslides rock fall and debris flow type distributed in more watershed management region.
D.5 More landslide zonations of region settled in moderately unstable zones.
D.6 Talented for liquefaction zones have least space.
REFERENCES
- V. Bogoslovsky and A. Ogilvy, “Geophysical Methods for the Investigation of Landslides,” Geophysics, Vol. 42, No. 3, 1977, pp. 562-571. doi:10.1190/1.1440727
- D. K. Keeper, “Landslides Caused by Earthquakes,” Geological Society of America Bulletin, Vol. 95, No. 4, 1984, pp. 406-421. doi:10.1130/0016-7606(1984)95<406:LCBE>2.0.CO;2
- W. L. Freedman, et al., “Final results from the Hubble Space Telescope key project to measure the Hubble constant,” The Astrophysical Journal, Vol. 553, No. 1, 2008, p. 47. doi:10.1086/320638
- E. Armandillo, A. Kearsley and C. Webb, “A Simple Technique for Measuring the Gain of RGH Lasers,” Journal of Physics E: Scientific Instruments, Vol. 15, No. 2, 2000, p. 177. doi:10.1088/0022-3735/15/2/007
- F. Guzzetti, et al., “Landslide Hazard Evaluation: A Review of Current techniques and their application in a Multi-Scale Study, Central Italy,” Geomorphology, Vol. 31, No. 1, 1999, pp. 181-216. doi:10.1016/S0169-555X(99)00078-1
- Ercanoglu, M. and C. Gokceoglu, “Assessment of Landslide Susceptibility for a Landslide-Prone Area (North of Yenice, NW Turkey) by Fuzzy Approach,” Environmental Geology, Vol. 15, No. 2, 2002, pp. 720-730. doi:10.1007/s00254-001-0454-2
- Duman, T., et al., “Landslide Susceptibility Mapping of Cekmece Area (Istanbul, Turkey) by Conditional Probability,” Hydrology and Earth System Sciences Discussions Discussions, Vol. 2, No. 1, 2005, pp. 155-208. doi:10.5194/hessd-2-155-2005
- M. H. Nabavi, “Introduction to the Geology of Iran,” Geological Survey of Iran, 1977.
- J. Jackson and D. McKenzie, “The Relationship between Plate Motions and Seismic Moment Tensors, and the Rates of Active Deformation in the Mediterranean and Middle East,” Geophysical Journal, Vol. 93, No. 1, 2007, pp. 45-73. doi:10.1111/j.1365-246X.1988.tb01387.x
- N. N. Ambraseys and C. P. Melville, “A History of Persian Earthquakes,” Cambridge University Press, Cambridge, 2005.
NOTES
*Corresponding author.