Journal of Surface Engineered Materials and Advanced Technology
Vol.2 No.2(2012), Article ID:18811,7 pages DOI:10.4236/jsemat.2012.22019
A Fast Algorithm for Automated Quality Control in Surface Engineering
![]()
DSP Lab, Virginia State University, Petersburg, USA.
Email: ESheybani@vsu.edu
Received January 31st, 2012; revised March 2nd, 2012; accepted March 8th, 2012
Keywords: Surface Characterization; Advanced Techniques
ABSTRACT
In this article an approach to surface image quality assessment for surface pattern and object recognition, classification, and identification has been described. The surface quality assessment finds many industrial applications such as automated, advanced, and autonomous manufacturing processes. Given that in most industrial applications the target surface is an unknown variable, having a tool to measure the quality of the surface in real time has a significant value. To add to the complication, in most industrial applications, the surface (and therefore its image) suffers from several physical phenomena such as noise (of several different kinds), time, phase, and frequency shifts, and other clutter caused by interference and speckles. The proposed tool should also be able to measure the level of deterioration of the surface due to these environmental effects. Therefore, evaluation of quality of a surface is not an easy task. It requires a good understanding of the processing methods used and the types of environmental processes affecting the surface. On the other hand, for a meaningful comparative analysis, some effective parameters have to be chosen and qualitatively and quantitatively measured across different settings and processes affecting the surface. Finally, any algorithm capable of handling these tasks has to be efficient, fast, and simple to qualify for the “real-time” applications.
1. Introduction
This research aims at providing image processing tools for comparison and assessment of a surface processed under different grades of a manufacturing process all the way up to optimal processing. Ability to measure the surface quality in real-time has many applications in manufacturing automation and product optimization, especially in processes in which the surface qualities such as roughness, grain size, thickness of coding, impurities size and distribution, hardness, and other mechanical properties are of importance. Surface analysis in manufacturing environments requires specialized filtering techniques. Due to the immense effect of rough environment and corruptive parameters, it is often impossible to evaluate the quality of a surface that has undergone various grades of processing. The algorithm presented here is capable of performing this comparison analytically and quantitatively at a low computational cost (real-time) and high efficiency. The parameters used for comparison are the degree of blurriness and the amount of various types of noise associated with the surface image. Based on a heuristic analysis of these parameters the algorithm assesses the surface image and quantifies the quality of the image by characterizing important aspects of human visual quality. Extensive effort has been set forth to obtain real-world noise and blur conditions so that the various test cases presented here could justify the validity of this approach well. The tests performed on the database of images produced valid results for the proposed algorithm consistently. This paper presents the description and validation (along with test results) of the proposed algorithm for surface image quality assessment.
This effort starts by assigning a value to the visual quality of several images from the same object whose surface has undergone different grades of the same process. Ideally, this algorithm is capable of identifying when an object is optimally processed. In doing so, we have identified some of the important parameters that affect the quality of a surface image and ways in which they can be measured quantitatively. The remainder of this paper is organized as follows: Section 2 gives the reader a little background on the requirements and components for this research and some of the challenges in surface image quality assessment; Section 3 discusses the methodology and the innovative techniques used in this research to overcome some of the challenges in surface image quality assessment; Section 4 describes the results obtained from this research; and Section 5 is reserved for conclusive remarks for this research and the direction of the future work in this field.
2. Background
In many advanced and automated industrial and manufacturing processes image processing algorithms are employed to analyze object surfaces and use the information obtained to improve the quality of the product such as finish, texture, color, placement, temperature, cracks, etc. [1-3]. One major disadvantage of these techniques is that collective environmental noise, speckles, and other artifacts from different sensors degrade the surface image quality in tasks such as surface pattern restoration, detection, recognition, and classification [4,5]. While many techniques have been developed to limit the adverse effects of these parameters on image data, many of these methods suffer from a range of issues such as computational involvement of algorithms to suppression of useful information [6,7]. Therefore, there is a great demand for a tool that could perform an accurate surface quality assessment. Since most surface images in industrial environments suffer from clutter, noise, and phase/pixel shifts, we have based this surface quality assessment algorithm on these parameters [8,9].
Furthermore, to achieve a comprehensive model and an algorithm that can handle a wide-range of surface imaging applications, we have proposed adaptive parameters and thresholds that can be adjusted to the type of object surface, manufacturing process, and optimal grade of operation. The noise in this case consists of Gaussian, salt and pepper, and shot noise. The blur consists of different levels of pixel displacements and angular rotations. We have used a variety of the most prevalent techniques recommended in the literature to include noise and blur in the images [10,11]. Wavelet transforms have been employed for analyzing noise in image data as suggested by relevant literature [12-15]. This research requires several hardware and software components that set up the framework for image processing and analysis. These include Matlab analysis and modeling software, a laptop equipped with at least 2 GB of memory to run computationally intensive calculations, and programming (C/C++) environments to run programs and extract data. The digital signal processing algorithms serve to manipulate data so that they would be a good fit for image processing and analysis. In these algorithms a wavelet based approach has been considered for de-noising the image datasets. A detailed description of the technique follows in the next section.
3. Methodology
Figures 1 and 2 below show the placement of the proposed algorithm in a given industrial image processing setup and its functional block diagram. Ideally, the proposed algorithm should be able to look at an image received from the processing sensor of the manufacturing cell (which is cluttered with various noise and blur effects of the environment), compare it to the outcome of various grades of the same cell (A1, A2, and A3) for the same surface (Image 1, Image 2, and Image 3), and decide which one is closer to the optimal threshold set for that particular process. As such, to validate the capability of the proposed algorithm in assessing and comparing the quality of surface images, it must be tested with known images as compared to their cluttered and processed versions.
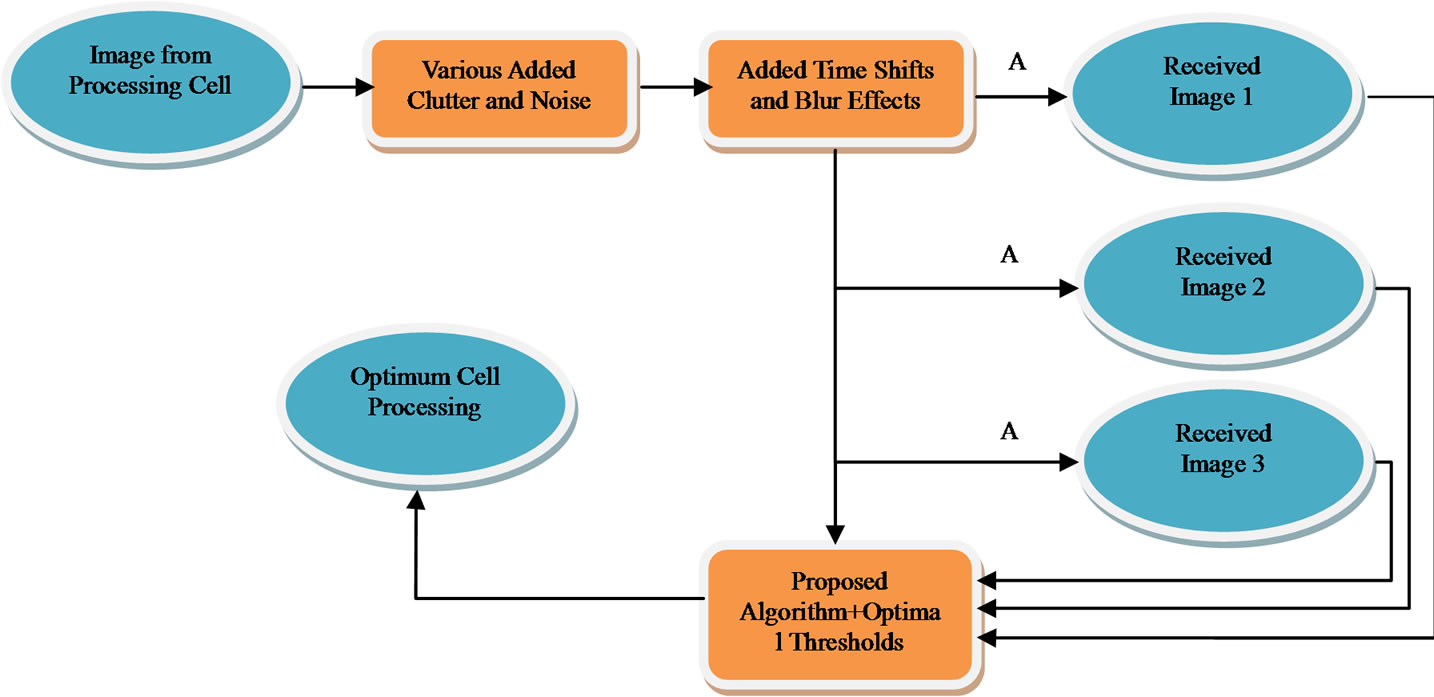
Figure 1. The general path for an image from processing cell to manufacturing cell, the alternative paths for processing, and the proposed algorithm for surface quality assessment.
Figure 3 shows the block diagram of the validation approach combined with the details of the proposed algorithm shown in Figure 2. Consistency in quality measure figures is the key to the successful validation of this approach and its applicability to a wide range of surface images from different manufacturing processes. The objective is to have one algorithm that works with surface images from different set of surface processes. To show consistency in results, the tests have been repeated with the original image (O), original image plus noise (O + N), original image plus blur (O + B), and original image plus noise and blur (O + N + B) and the results have been shown for all cases in Table 1. As depicted in Figure 2, the proposed algorithm consists of several modules, each unique in its design and purpose, while applicable to a broad array of surface images. These modules are described below:
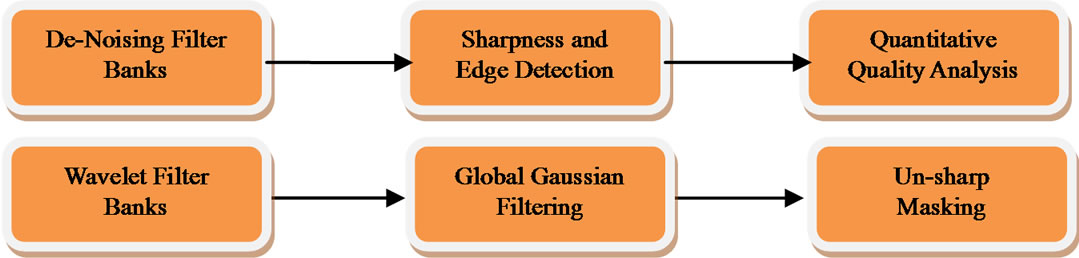
Figure 2. Components of the proposed algorithm for image quality assessment and details of the de-noising filter banks.
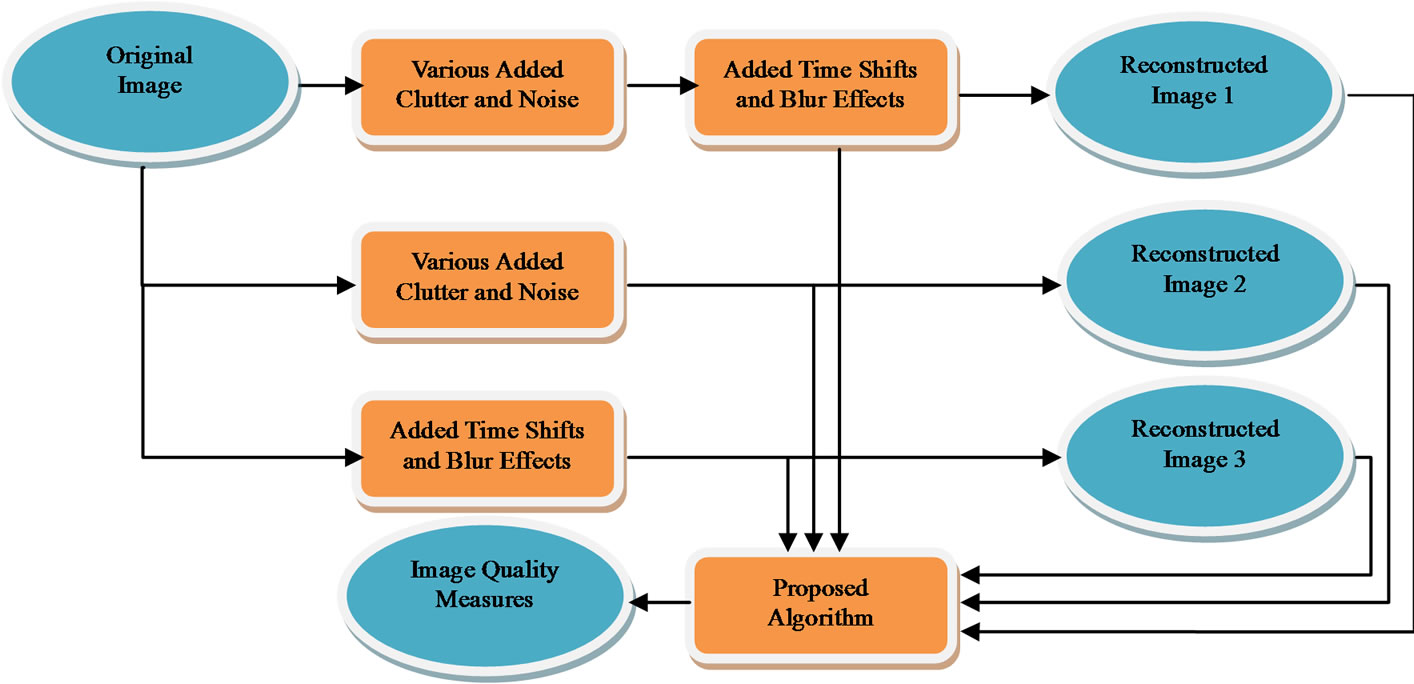
Figure 3. The validation approach functional block diagram for the proposed algorithm for surface image quality assessment.
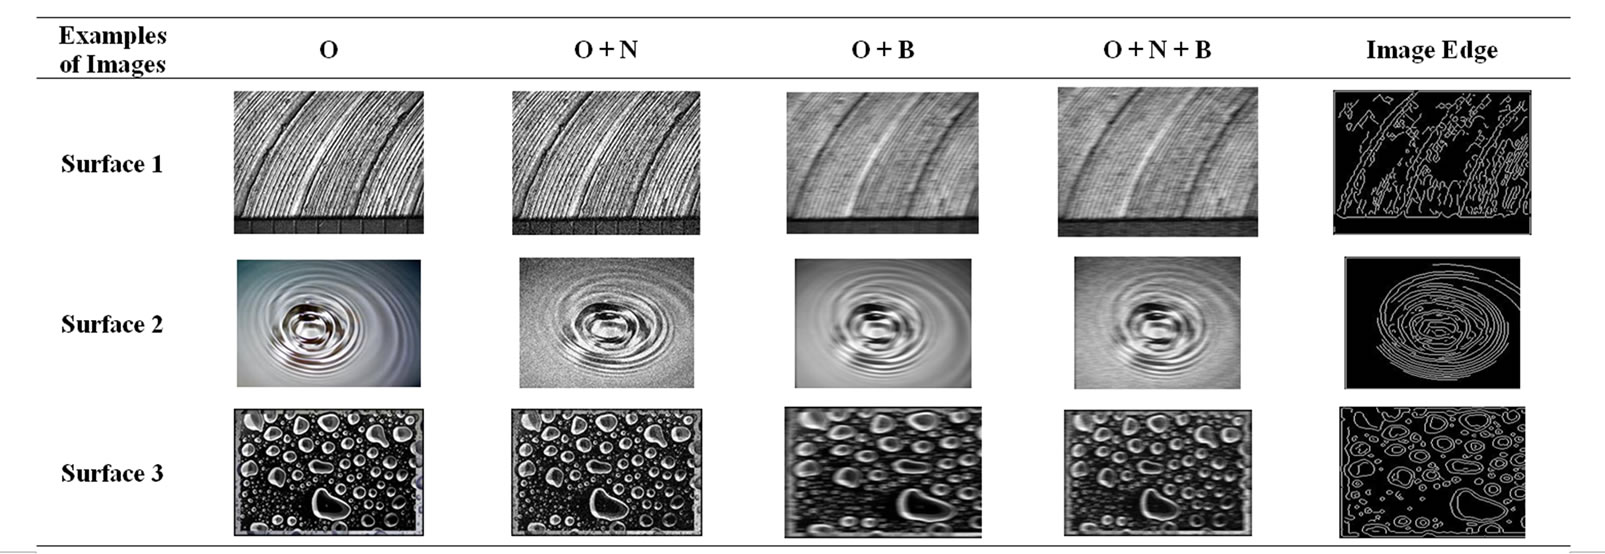
Table 1. Examples of images used for validation of the proposed algorithm for surface image quality assessment. The algorithm has been tested with original image (O), original image plus noise (O + N), original image plus blur (O + B), and original image plus noise and blur (O + N + B).
De-noising Filter Banks: A noisy image can be simply modeled as S(i,j) = f(i,j) + σe(i,j), where S is corrupted image with noise e, and σ is the noise level. To de-noise is to remove σe(i,j) and recover f(i,j). Noise is a wide-band phenomenon. Therefore, de-noising would require a delicate balance of high, low, and mid band filters with proper threshold that would minimize interference with the main signal. The proposed filters in this research use a combination of wavelet based filter banks and Wiener/Gaussian filters as a means of multiband noise suppression and wide band noise reduction, respectively.
The Wiener filters are specialized in (additive) noise smoothing (compression low-pass filter) and blur inversion (deconvolution highpass filter) while reducing the mean square error. In the Fourier transform domain the Wiener filters can be expressed as:
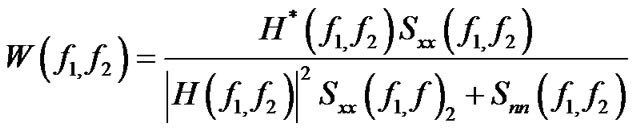
where  and
and  are power spectrum of the original image and noise, respectively and
  is the blurring filter [17].
The Gaussian filters perform signal smoothing by applying convolution (blurring) and therefore removing high frequency noise (mean filtering). The 2D Gaussian filter can be expressed as
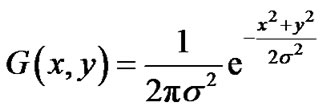
where the standard deviation (σ) determines the degree to which the image is smoothed. The Gaussian filters smooth the image more gently than the mean filter and preserve the edges better. Therefore, the Gaussian filter is not only better for edge detection due to its sharp cutoff frequency, but also it is the perfect pair for Wiener filter as it neutralizes the blur effect of these filters and reduces the noise in bands that Wiener filter is not effective [16-19].
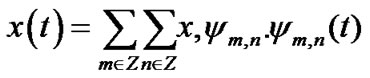
Wavelet de-noise method is proven to be one of the better methods [15-17]. This method involves three steps. First, a mother wavelet is used to generate the discrete wavelet transform (DWT) which in turn is employed to decompose the image. Then hierarchical DWT representations of the image make it possible to determine de-noise layer number by a proper soft threshold and threshold function algorithm. Finally, reconstructing the image by applying the threshold coefficients and inverse discrete wavelet transform (IDWT), reconstructs the de-noised image. Wavelet transforms are the result of translation and scaling of a finite-length waveform known as mother wavelet. A wavelet divides a function into its frequency components such that its resolution matches the frequency scale and translation. To represent a signal in this fashion it would have to go through a wavelet transform. Application of the wavelet transform to a function results in a set of orthogonal basis functions which are the time-frequency components of the signal. Due to its resolution in both time and frequency wavelet transform is the best tool for decomposition of signals that are non-stationary or have discontinuities and sharp peaks. In this work the wavelet transform has been used to de-noise images. The approach consists of decomposing the signal of interest into its detailed and smoothed components (high-and low-frequency). The detailed components of the signal at different levels of resolution localize the time and frequency of the event. Therefore, the wavelet filter can extract the “short-time”, “extreme value”, and “high-frequency” features of the image. Usually a subset of the discrete coefficients is used to reconstruct the best approximation of the signal. This subset is generated from the discrete version of the generating function:
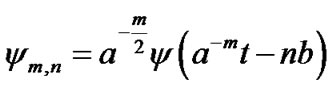
where a and b are scale and shift, and m and n represent the number of levels and number of coefficients used for scaling and shifting of wavelet basis, respectively. Applying a subset of this set to a function x with finite energy will result in wavelet transform coefficients from which one can closely approximate (reconstruct) x using the coarse coefficients of this sequence [12,13]:
Sharpness and Edge Detection: The proposed blind image quality assessment approach is based on immediate human visual factors such as lighting, contrast, tone, noise, and blurriness. These parameters have been carefully simplified, filtered, merged, and optimized to result in a quantitative measure for quality of a broad range of images. As part of the filtering and simplification process, the edge detection and sharpening filters have been employed.
The sharpness filtering or un-sharp masking can be used to remove uneven pixels and noise from an image while preserving the original data and avoiding deformity and shrinkage. This is done by applying linear or nonlinear filters that amplify the high frequency components of the image and therefore give the impression of an image with a higher resolution. The procedure requires setting thresholds that limit the sharpness of unwanted elements in image (such as image grains). Therefore, this technique increases the sharpness effect of an image by raising the contrast of small brightness changes. The image appears more detailed, since the human perception is aligned to the recognition of edges and lines. Un-sharp masking could increase the detail contrast in general and amplify image interference of the original and therefore result in very bumpy and unnatural image effects. In fact, too much masking could cause “halo” effect (light/dark outlines near edges). It can also bring in slight color shifts by emphasizing certain colors while diminishing others. The proposed filters in this research have been carefully designed to optimize masking without causing “halo” effect and to emphasize luminance channel rather that color to avoid any color shift [20].
Edge detection is an essential part of any feature detection or extraction in image processing or computer vision algorithms. The technique consists of recognizing the points at which the brightness of a digital image changes abruptly (points of discontinuity). These changes could be an indication of important incidents in an image such as sudden changes in depth or surface orientation, properties of material, or illumination of the scene. Despite different techniques presented to solve this nontrivial problem, one of the early ones by Canny is considered the state-of-the-art edge detector [21]. In his approach, Canny considered an optimal smoothing filter given the criteria of detection, localization, and minimizing multiple responses to a single edge. He proved that this filter can be implemented as the sum of four exponential terms and approximated by first-order derivatives of Gaussians. He used central differences as a gradient operator to estimate input image gradients [21,22]:
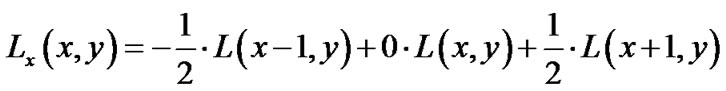
The gradient magnitude and orientation then can be computed as
Quantitative Quality Analysis: For the purposes of comparison and assessment of various surface images from a processed object, it is desired to have a quantitative measure based on parameters involved in visual quality. In this research, the ideal quantitative measure has been analytically calculated based on a delicate balance between the signal to noise ratio (SNR) and norm of the reconstructed image. Furthermore, important factors in human visual system such as scene lighting, contrast, and edges have been considered to come up with these parameters. As depicted in Figure 2, a cluttered image is de-noised to an optimal level (measured by SNR) and then using the un-sharp masking its useful information has been extracted to realize a factor that is an indication of the portion of the true image that is embedded inside the cluttered version. The closer this number is to one, it shows a higher portion of the true image inside the reconstructed version. A number larger than one (as shown in the case of exceptional images in Table 1) is an indication that the image has picked up a few extra pieces in addition to what was intended in the original image.
SNR is a measure of how well a signal is preserved as it travels through a noisy environment. It is the ratio of signal power to background noise power measured in dB. It is calculated as follows:
where Ps and Pn are signal and noise power, and As and An are signal and noise amplitude, respectively.
Since all data acquisition systems suffer from environmental noise, SNR can be partially improved by limiting the amount of noise injected into the system from the environment. This can be done by reducing the sensitivity of the system and/or filtering out the noise. Another type of noise (additive noise) is introduced to the system at the quantization phase. This type of noise is non-linear and signal-dependent and therefore, requires more selective filtering for noise cancellation. The filters used in this research for noise reduction are a delicate balance between Weiner, Gaussian, and wavelet filter banks which optimally adjust themselves to the level of noise in signal and noise frequency bands for maximum noise cancellation and minimum signal deterioration [23].
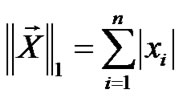
Thinking of an image as a two dimensional matrix, norm can be used to measure the “size” of the image or the “distance” or “difference” between two images. 1-Norm of a vector is given by
Accordingly, 1-norm of a matrix would be
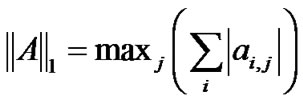
This amounts to the maximum of column sums. Following the same pattern, the 2-norm of a vector is
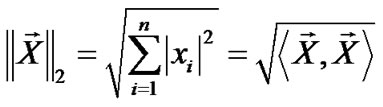
Which amounts to matrix 2-norm being

Otherwise known as singular values of matrix A [24].
4. Results and Future Work
Table 1 shows examples of images from the image database used for this experiment. Figure 4 shows examples of the validation results for this research as depicted in
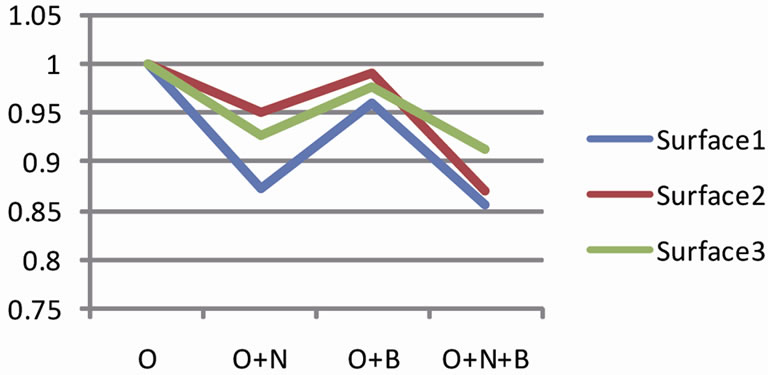
Figure 4. Examples of the normalized validation results for the proposed algorithm for surface image quality assessment. The algorithm has been tested for original image (O), original image plus noise (O + N), original image plus blur (O + B), and original image plus noise and blur (O + N + B).
Section 3 of the paper. As shown in Figure 3, the set of images for this experiment were cluttered in 3 different ways (Table 1) and all processed with the proposed surface image quality assessment algorithm. Quantitative results prove to be consistent for each and every image type tested. Here are some observations from these test results:
1) The algorithm consistently rates the original better than the noisy (O + N), blurry (O + B), and noisyblurry (O + N + B). Depending on the type and quality of the image, the qualitative measure obtained is not rating the O + N, O + B, and O + N + B consistently. In most cases, as the quality of the image is degraded (by introducing more clutter such as noise and blur or both), the quality measure keeps decreasing. The lack of consistency here remains a question until further improvements to the algorithm and a comparison to human visual system (HVS) are performed.
2) The results also indicate that the proposed quality assessment figure is a robust and reliable measure based on limited visual parameters for a fast convergence suitable for real-time applications with limited sensor data. The measure has proved to differentiate between different grades of processing of the same object (surface images) very accurately. Accordingly, it can also detect anomalies in the image in the same way that human eye can.
The authors plan to further examine the validity of this algorithm in comparison to human visual system (HVS). This is rather an important task as it finds applications in many automated systems in which human observation and validation is part of the process (CIM cells, manufacturing, etc.). Once validated, the algorithm will be matched to relevant applications in the real world.
5. Conclusions
Object surface image extraction, recognition, and processing are of great interest to many industrial and manufacturing fields such as surface detection, smoothness, finish, and classification. The long-term goal of this research is to enable increased autonomy and quality of image processing systems, with special emphasis on automated processing, validation, and reconfiguration. The overall theme of this work is automatic extraction and processing of high-resolution surface images by adding a real-time surface image quality assessment algorithm. Wiener, Gaussian, un-sharp masking, and Multi-resolution wavelet filter banks have been proposed to enable an efficient and fast solution to this problem. A delicate balance of these filters in the proposed algorithm is capable of recognizing the quality of an optimal surface (image) in comparison to unfinished versions of it.
This research has led to accelerate research in theories, principles, and computational techniques for surface quality assessment in image processing. The results obtained indicate that the proposed algorithm can effectively assess the quality of any given surface from a wide range of variations in finish. Additionally, the proposed algorithm is fast, efficient, and robust and can be implemented in hardware for real-time applications.
6. Acknowledgements
The authors would like to acknowledge Commonwealth Center for Advanced Manufacturing (CCAM), and NASA CIPAIR, Fellowship, and NSTI grants for the financial support of the research in surface engineering and image processing applications.
REFERENCES
- J. D. Maxwell, Y. Qu and J. R. Howell, “Full Field Temperature Measurement of Specular Wafers during Rapid Thermal Processing,” IEEE Transactions on Semiconductor Manufacturing, Vol. 20, No. 2, 2007, pp. 137-142. doi:10.1109/TSM.2007.895204
- K.-C. Huang, C.-L. Chang and W.-H. Wu, “Novel Image Polarization Method for Measurement of Lens Decentration,” IEEE Transactions on Instrumentation and Measurement, Vol. 60, No. 5, 2011, pp. 1845-1853. doi:10.1109/TIM.2011.2108070
- Y. Cheng and M. A. Jafari, “Vision-Based Online Process Control in Manufacturing Applications,” IEEE Transactions on Automation Science and Engineering, Vol. 5, No. 1, 2008, pp. 140-153. doi:10.1109/TASE.2007.912058
- D.-M. Tsai and J.-Y. Luo, “Mean Shift-Based Defect Detection in Multicrystalline Solar Wafer Surfaces,” IEEE Transactions on Industrial Informatics, Vol. 7, No. 1, 2011, pp. 125-135. doi:10.1109/TII.2010.2092783
- F. Bernardini, I. M. Martin and H. Rushmeier, “HighQuality Texture Reconstruction from Multiple Scans,” IEEE Transactions on Visualization and Computer Graphics, Vol. 7, No. 4, 2001, pp. 318-332. doi:10.1109/2945.965346
- J. P. W. Pluim, J. B. A. Maintz and M. A. Viergever, “Mutual-Information-Based Registration of Medical Images: A Survey,” IEEE Transactions on Medical Imaging, Vol. 22, No. 8, 2003, pp. 986-1004. doi:10.1109/TMI.2003.815867
- S. Reed, I. T. Ruiz, C. Capus and Y. Petillot, “The Fusion of Large Scale Classified Side-Scan Sonar Image Mosaics,” IEEE Transactions on Image Processing, Vol. 15, No. 7, 2006, pp. 2049-2060. doi:10.1109/TIP.2006.873448
- H. R. Sheikh and A. C. Bovik, “Image Information and Visual Quality,” IEEE Transactions on Image Processing, Vol. 15, No. 2, 2006, pp. 430-444. doi:10.1109/TIP.2005.859378
- Z. Wang and A. C. Bovik, “A Universal Image Quality Index,” IEEE Signal Processing Letters, Vol. 9, No. 3, 2002, pp. 81-84. doi:10.1109/97.995823
- R. Samadani, T. A. Mauer, D. M. Berfanger and J. H. Clark, “Image Thumbnails That Represent Blur and Noise,” IEEE Transactions on Image Processing, Vol. 19, No. 2, 2010, pp. 363-373. doi:10.1109/TIP.2009.2035847
- M. Mignotte, “A Post-Processing Deconvolution Step for Wavelet-Based Image Denoising Methods,” IEEE Signal Processing Letters, Vol. 14, No. 9, 2007, pp. 621-624. doi:10.1109/LSP.2007.896183
- V. Chappelier and C. Guillemot, “Oriented Wavelet Transform for Image Compression and Denoising,” IEEE Transactions on Image Processing, Vol. 15, No. 10, 2006, pp. 2892-2903. doi:10.1109/TIP.2006.877526
- E. J. Balster, Y. F. Zheng and R. L. Ewing, “FeatureBased Wavelet Shrinkage Algorithm for Image Denoising,” IEEE Transactions on Image Processing, Vol. 14, No. 12, 2005, pp. 2024-2039. doi:10.1109/TIP.2005.859385
- E. Sheybani, “Enhancement of Data in Integrated Communications, Navigation, and Surveillance Systems,” Proceedings of NASA/IEEE/AIAA ICNS 2011, Washington DC, 10-12 May 2011.
- N. C. Pramod and G. V. Anand, “Nonlinear Wavelet Denoising for DOA Estimation by MUSIC,” 2004 International Conference on Signal Processing & Communications (SPCOM), Bangalore, 11-14 December 2004, pp. 388-392.
- E. Davies, “Machine Vision: Theory, Algorithms and Practicalities,” Academic Press, New York, 1990, pp. 42- 44.
- R. Gonzalez and R. Woods, “Digital Image Processing,” Addison-Wesley Publishing Company, Reading, 1992, p. 191.
- R. Haralick and L. Shapiro, “Computer and Robot Vision,” Addison-Wesley Publishing Company, Reading, 1992.
- F. Jin, P. Fieguth, L. Winger and E. Jernigan, “Adaptive wiener filtering of noisy images and image sequences,” Proceedings of IEEE ICIP 2003, Barcelona, 14-17 September 2003.
- LaserSoft Imaging, “SilverFast Unsharp Masking,” 2011. http://www.silverfast.com/highlights/
- D. Ziou and S. Tabbone, “Edge Detection Techniques: An Overview,” International Journal of Pattern Recognition and Image Analysis, Vol. 8, No. 4, 1998, pp. 537- 559.
- J. Canny, “A Computational Approach to Edge Detection,” IEEE Transactions on Pattern Analysis and Machine Intelligence, Vol. 8, 1986, pp. 679-714. doi:10.1109/TPAMI.1986.4767851
- Wikipedia, “Signal-to-Noise Ratio,” 2011. http://en.wikipedia.org/
- J. Stensby, “Notes on Matrix Norms,” 2011. http://www.ece.uah.edu